


 |
市場調查報告書
商品編碼
2120432
固體氧化物燃料電池(SOFC):市場佔有率分析、行業趨勢和統計數據以及成長預測(2026-2031 年)Solid Oxide Fuel Cells (SOFC) - Market Share Analysis, Industry Trends & Statistics, Growth Forecasts (2026 - 2031) |
||||||

※ 本網頁內容可能與最新版本有所差異。詳細情況請與我們聯繫。
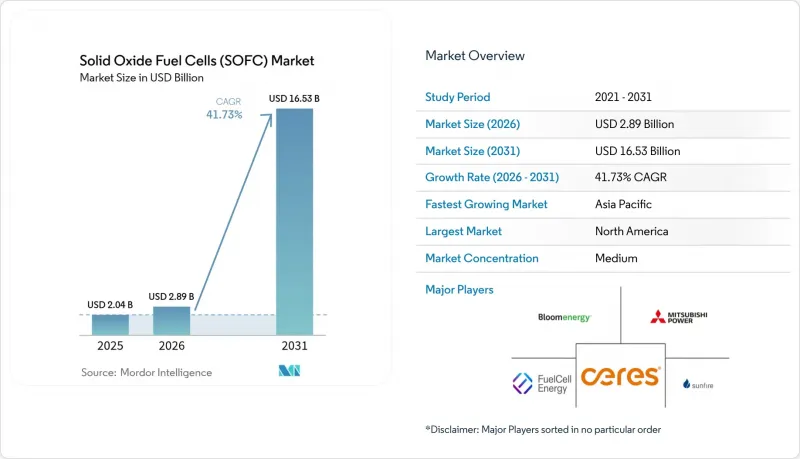
據 Mordor Intelligence 稱,2025 年固體氧化物燃料電池(SOFC) 市值為 20.4 億美元,預計到 2031 年將達到 165.3 億美元,而 2026 年為 28.9 億美元,預測期(2026-2031 年)的複合年成長率為 41.73%。
本報告按電池設計(平面、管狀、整合/RSOFC)、應用(固定電源、運輸動力傳動系統和APU、可攜式和微型電源)、最終用戶(住宅、商業和工業、公用事業規模電力、國防和航太)以及地區(北美、歐洲、亞太地區、南美、中東和非洲)進行分類。
全球固體氧化物燃料電池(SOFC)市場趨勢與洞察
政府補貼和強制性淨零排放目標正在加速固定式固態氧化物燃料電池(SOFC)的普及應用。
高達30%的聯邦投資稅額扣抵和每公斤3美元的氫氣生產稅額扣抵正在縮短投資回收期,並加速基於固體氧化物燃料電池(SOFC)的熱電聯產(CFC)系統在商業設施中的應用。德國90億歐元的氫能發展藍圖和日本延長至2025年的補貼計劃,正在支持大規模訂單並重振大規模生產線,從而推動陶瓷燃料電池堆成本向每千瓦1000美元的目標邁進。
資料中心和微電網對容錯性和高效電力的需求。
超大規模業者要求99.999%的運轉率,並將SOFC微電網視為實現備用電源脫碳和減少對柴油依賴的有效途徑。喬治亞理工學院的200千瓦設施已證明其併網運作效率高達60%,而Bloom Energy公司報告稱,其面向資料中心的銷售額已佔總收入的38%,平均訂單規模正朝著1兆瓦的方向發展。
陶瓷疊層結構高成本,且有資本投資障礙。
陶瓷元件的製造成本仍佔系統成本的近60%,初始投資價格仍維持在每千瓦4000至6000美元。美國能源局(DOE)的藍圖旨在透過自動化和替代電解液,到2030年將成本降低75%,但目前的供應商面臨產量限制,導致毛利率低於30%。
細分市場分析
到2025年,由於其高功率密度和與網版印刷生產線的兼容性,平面堆將佔據固體氧化物燃料電池(SOFC)市場67.60%的佔有率。管式電池因其抗熱衝擊性能仍備受青睞,但預計僅佔約20%的銷售額。受季節性儲能需求的驅動,整合可逆設計預計將以48.30%的複合年成長率成長。 FuelCell Energy的3千瓦原型機實現了85%的電解效率,證實其技術已具備開展兆瓦級先導計畫的能力。同時,Sunfire已成功資金籌措2.15億歐元,計劃在2027年前實現10兆瓦模組的量產。
製造商正致力於消除平面堆中易碎的玻璃密封件,將使用壽命延長至6萬小時以上,並透過自動化提高處理能力。管式平台避免了密封失效,但補償是功率密度降低和製造流程複雜度增加。 Ceres Power的鋼支撐電池採用壓縮密封,降低了熱循環帶來的應力,從而降低了30%的材料成本。隨著供應商的價格趨於每千瓦1000美元,可逆堆有望重新定義設計主導,並將固體氧化物燃料電池(SOFC)市場推向混合「電電能轉氣氣」架構。
區域分析
到2025年,北美將佔全球銷售額的74.65%。這得歸功於Bloom Energy超過1吉瓦的裝置容量記錄,以及聯邦政府為電解槽和燃料電池製造提供的7.5億美元津貼項目。加州的「自發電獎勵計畫」提供每瓦高達1.50美元的補貼,將商業性投資回收期縮短至不到六年。加拿大根據「無污染燃料法規」提供合規積分,墨西哥正在為偏遠礦區運營一個10兆瓦的試點項目,但授權的延誤仍然是一個瓶頸。
亞太地區是成長最快的地區,預計到2031年複合年成長率將達到48.90%。在日本,到2024年,「EneFarm」住宅安裝量將超過50萬套,並計劃在2030年達到530萬套,透過大規模生產保持技術累積。在韓國,固體氧化物燃料電池(SOFC)發電廠被納入可再生可再生組合標準(RPS),因此可以進行盈利的證書交易,並為新建40兆瓦專案提供資金。中國正根據其「十四五」分散式發電規劃推進SOFC示範項目,但管道天然氣供應覆蓋範圍有限,阻礙了其廣泛應用。
歐洲約佔全球銷售額的12%,主要得益於德國、英國和北歐國家將固體氧化物燃料電池(SOFC)與氫氣儲存和離岸風力發電結合。德國90億歐元的氫能策略正為進入電力和天然氣市場的可逆電堆創造核心需求。在英國,差價合約(CfD)保障了收入利潤,丹麥和挪威正在進行氫氣發電與離岸風力發電相結合的示範計畫。拉丁美洲、中東和非洲合計佔市場佔有率不到3%,但巴西、沙烏地阿拉伯和南非正在開發總合規模的設施,預計將為固體氧化物燃料電池(SOFC)市場帶來新的出口機遇,並提高電網的韌性。
其他好處:
- Excel格式的市場預測(ME)表
- 3個月的分析師支持
目錄
第1章:引言
- 研究假設和市場定義
- 調查範圍
第2章:調查方法
第3章執行摘要
第4章 市場狀況
- 市場概覽
- 市場促進因素
- 政府補貼和強制性淨零排放目標正在加速固定式固態氧化物燃料電池(SOFC)的普及應用。
- 資料中心和微電網對容錯性和高效電源的需求
- 綠色氫能基礎設施的擴展將使我們能夠利用固態氧化物燃料電池的燃料柔軟性。
- 採用固態氧化物燃料電池(SOFC)進行廢熱回收的工業爐,具備碳回收能力。
- 由於國際海事組織硫排放法規,船舶輔助動力源需要進行改造。
- 可逆固體氧化物燃料電池(SOFC)的出現及其在季節性儲能的應用。
- 市場限制因素
- 陶瓷堆體成本高昂,且有資本投資障礙。
- 在 600-800 度C的工作溫度範圍內,耐久性/劣化如何?
- Scandia穩定氧化鋯的供應鏈價格波動劇烈。
- 對氫氣-天然氣管道混合燃料不確定性的接受
- 供應鏈分析
- 監理情勢
- 技術展望
- 波特五力模型
第5章 市場規模與成長預測
- 細胞設計
- 平面
- 管狀
- 整合/rSOFC
- 透過使用
- 固定式發電
- 交通運輸動力傳動系統及輔助動力裝置
- 可攜式微型電源
- 最終用戶
- 住宅
- 商業和工業用途
- 公用事業規模發電
- 國防/航太
- 按地區
- 北美洲
- 美國
- 加拿大
- 墨西哥
- 歐洲
- 英國
- 德國
- 法國
- 西班牙
- 北歐國家
- 俄羅斯
- 其他歐洲國家
- 亞太地區
- 中國
- 印度
- 日本
- 韓國
- 東南亞國協
- 其他亞太國家
- 南美洲
- 巴西
- 阿根廷
- 哥倫比亞
- 其他南美國家
- 中東和非洲
- 沙烏地阿拉伯
- 阿拉伯聯合大公國
- 南非
- 埃及
- 其他中東和非洲國家
- 北美洲
第6章 競爭情勢
- 市場集中度
- 策略趨勢(併購、聯盟、購電協議)
- 市場佔有率分析(主要公司的市場排名和佔有率)
- 公司簡介
- Bloom Energy Corp.
- Mitsubishi Power(Mitsubishi Heavy Industries Group)
- Ceres Power Holdings PLC
- Sunfire GmbH
- FuelCell Energy Inc.
- Elcogen AS
- Doosan Fuel Cell Co.
- Convion Ltd
- Watt Fuel Cell Corp.
- AVL List GmbH
- Hexis AG
- Kyocera Corp.
- Bosch Thermotechnology
- Atrex Energy
- NGK Spark Plug Co.
- H2E Power Systems
- Convion Ltd
- SolidPower SpA
- Ningbo SOFC Manufacturing
- GINER ELX
第7章 市場機會與未來展望
According to Mordor Intelligence, the solid oxide fuel cells (SOFC) market size was valued at USD 2.04 billion in 2025 and estimated to grow from USD 2.89 billion in 2026 to reach USD 16.53 billion by 2031, at a CAGR of 41.73% during the forecast period (2026-2031).
This report is Segmented by Cell Design (Planar, Tubular, and Integrated/RSOFC), Application (Stationary Power, Transportation Powertrain and APU, and Portable and Micro-Power), End User (Residential, Commercial and Industrial, Utility-Scale Power, and Defense and Aerospace), and Geography (North America, Europe, Asia-Pacific, South America, and Middle East and Africa).
Global Solid Oxide Fuel Cells (SOFC) Market Trends and Insights
Government Subsidies & Net-Zero Mandates Accelerate Stationary SOFC Deployment
Federal investment credits of up to 30% and hydrogen production credits of USD 3 per kilogram are compressing payback periods, prompting commercial campuses to adopt SOFC combined heat and power. Germany's EUR 9 billion hydrogen roadmap and Japan's subsidy extension through 2025 underwrite large purchase orders and stimulate mass-production lines that pull ceramic stack costs toward the USD 1,000 per kilowatt goal.
Data-Center & Micro-Grid Demand for Resilient, High-Efficiency Power
Hyperscale operators require 99.999% uptime and see SOFC microgrids as a route to decarbonize standby generation and reduce diesel dependence. Georgia Tech's 200-kilowatt installation demonstrates grid-parallel operation with 60% electrical efficiency, while Bloom Energy reports that data-center sales already account for 38% of revenue, with average order sizes trending toward 1 megawatt.
High Ceramic Stack Cost & Cap-Ex Hurdles
Ceramic fabrication still accounts for nearly 60% of system cost, keeping installed prices at USD 4,000-6,000 per kilowatt. DOE roadmaps target a 75% cost reduction by 2030 through automation and alternative electrolytes, but today's vendors remain volume-constrained with gross margins under 30%.
Other drivers and restraints analyzed in the detailed report include:
- Expanding Green-Hydrogen Infrastructure Leverages SOFC Fuel Flexibility
- Carbon-Capture-Ready Industrial Furnaces Adopting SOFC Exhaust Heat Recovery
- Durability/Degradation at 600-800 °C Operating Range
For complete list of drivers and restraints, kindly check the Table Of Contents.
Segment Analysis
Planar stacks delivered 67.60% of the Solid Oxide Fuel Cells market share in 2025, owing to their high power density and compatibility with screen-printing lines. Tubular cells remain valued for thermal-shock tolerance but hold roughly 20% revenue. Integrated reversible designs are projected to grow 48.30% CAGR on seasonal-storage demand. FuelCell Energy's 3-kilowatt prototype achieved 85% electrolysis efficiency, confirming technical readiness for multi-megawatt pilots, while Sunfire secured EUR 215 million to scale 10-megawatt modules by 2027.
Manufacturers work to eliminate brittle glass seals in planar stacks, extend life past 60,000 hours, and raise automated throughput. Tubular platforms avoid seal failure yet trade power density and raise machining complexity. Ceres Power's steel-supported cell adds compressive seals that reduce thermal-cycle stress and cut material cost by 30%. As vendors converge on USD 1,000 per kilowatt, reversible stacks may reset design leadership, moving the Solid Oxide Fuel Cells market toward hybrid power-to-gas architectures.
Complete Report Scope:
- By Cell Design
- Planar
- Tubular
- Integrated/rSOFC
- By Application
- Stationary Power
- Transportation Powertrain and APU
- Portable and Micro-Power
- By End User
- Residential
- Commercial and Industrial
- Utility-Scale Power
- Defense and Aerospace
- By Geography
- North America
- United States
- Canada
- Mexico
- Europe
- United Kingdom
- Germany
- France
- Spain
- NORDIC Countries
- Russia
- Rest of Europe
- Asia-Pacific
- China
- India
- Japan
- South Korea
- ASEAN Countries
- Rest of Asia-Pacific
- South America
- Brazil
- Argentina
- Colombia
- Rest of South America
- Middle East and Africa
- Saudi Arabia
- United Arab Emirates
- South Africa
- Egypt
- Rest of Middle East and Africa
- North America
Geography Analysis
North America commanded 74.65% revenue in 2025, anchored by more than 1 gigawatt of Bloom Energy installations and by a USD 750 million federal grant program for electrolyzer and fuel-cell manufacturing. California's Self-Generation Incentive Program adds up to USD 1.50 per watt, cutting commercial payback below six years. Canada supplies compliance credits under its Clean Fuel Regulations, while Mexico operates a 10-megawatt pilot for remote mines; permitting delays remain a bottleneck.
Asia-Pacific is the fastest-growing region with a projected 48.90% CAGR to 2031. Japan's Ene-Farm surpassed 500,000 residential units by 2024 and targets 5.3 million by 2030, sustaining mass-production learning curves. South Korea's Renewable Portfolio Standard classifies SOFC power plants as renewable, enabling lucrative certificate trading that underwrites new 40-megawatt projects. China aligns SOFC pilots with its 14th Five-Year Plan for distributed generation, yet low pipeline gas coverage slows widespread rollout.
Europe accounts for about 12% revenue, driven by Germany, the United Kingdom, and Nordic countries linking SOFCs to hydrogen storage and offshore wind. Germany's EUR 9 billion hydrogen strategy creates anchor demand for reversible stacks that bid into power and gas markets. The United Kingdom guarantees revenue floors through contracts-for-difference, while Denmark and Norway test offshore-wind-coupled hydrogen generation. Latin America, the Middle East, and Africa collectively hold under 3% share, but Brazil, Saudi Arabia, and South Africa are lining up pilot capacity that could open new export and grid-resilience opportunities within the Solid Oxide Fuel Cells market.
- Bloom Energy Corp.
- Mitsubishi Power (Mitsubishi Heavy Industries Group)
- Ceres Power Holdings PLC
- Sunfire GmbH
- FuelCell Energy Inc.
- Elcogen AS
- Doosan Fuel Cell Co.
- Convion Ltd
- Watt Fuel Cell Corp.
- AVL List GmbH
- Hexis AG
- Kyocera Corp.
- Bosch Thermotechnology
- Atrex Energy
- NGK Spark Plug Co.
- H2E Power Systems
- Convion Ltd
- SolidPower SpA
- Ningbo SOFC Manufacturing
- GINER ELX
Additional Benefits:
- The market estimate (ME) sheet in Excel format
- 3 months of analyst support
TABLE OF CONTENTS
1 Introduction
- 1.1 Study Assumptions & Market Definition
- 1.2 Scope of the Study
2 Research Methodology
3 Executive Summary
4 Market Landscape
- 4.1 Market Overview
- 4.2 Market Drivers
- 4.2.1 Government subsidies & net-zero mandates accelerate stationary SOFC deployment
- 4.2.2 Data-center & micro-grid demand for resilient, high-efficiency power
- 4.2.3 Expanding green-hydrogen infrastructure leverages SOFC fuel-flexibility
- 4.2.4 Carbon-capture-ready industrial furnaces adopting SOFC exhaust heat recovery
- 4.2.5 Maritime auxiliary power shift after IMO sulfur cap
- 4.2.6 Emergence of reversible SOFCs for seasonal energy storage
- 4.3 Market Restraints
- 4.3.1 High ceramic stack cost & cap-ex hurdles
- 4.3.2 Durability/degradation at 600-800 °C operating range
- 4.3.3 Price-volatile scandia-stabilized zirconia supply chain
- 4.3.4 Permitting uncertainty for H2-NG pipeline blends
- 4.4 Supply-Chain Analysis
- 4.5 Regulatory Landscape
- 4.6 Technological Outlook
- 4.7 Porter's Five Forces
- 4.7.1 Bargaining Power of Suppliers
- 4.7.2 Bargaining Power of Buyers
- 4.7.3 Threat of New Entrants
- 4.7.4 Threat of Substitutes
- 4.7.5 Competitive Rivalry
5 Market Size & Growth Forecasts
- 5.1 By Cell Design
- 5.1.1 Planar
- 5.1.2 Tubular
- 5.1.3 Integrated/rSOFC
- 5.2 By Application
- 5.2.1 Stationary Power
- 5.2.2 Transportation Powertrain and APU
- 5.2.3 Portable and Micro-Power
- 5.3 By End User
- 5.3.1 Residential
- 5.3.2 Commercial and Industrial
- 5.3.3 Utility-Scale Power
- 5.3.4 Defense and Aerospace
- 5.4 By Geography
- 5.4.1 North America
- 5.4.1.1 United States
- 5.4.1.2 Canada
- 5.4.1.3 Mexico
- 5.4.2 Europe
- 5.4.2.1 United Kingdom
- 5.4.2.2 Germany
- 5.4.2.3 France
- 5.4.2.4 Spain
- 5.4.2.5 NORDIC Countries
- 5.4.2.6 Russia
- 5.4.2.7 Rest of Europe
- 5.4.3 Asia-Pacific
- 5.4.3.1 China
- 5.4.3.2 India
- 5.4.3.3 Japan
- 5.4.3.4 South Korea
- 5.4.3.5 ASEAN Countries
- 5.4.3.6 Rest of Asia-Pacific
- 5.4.4 South America
- 5.4.4.1 Brazil
- 5.4.4.2 Argentina
- 5.4.4.3 Colombia
- 5.4.4.4 Rest of South America
- 5.4.5 Middle East and Africa
- 5.4.5.1 Saudi Arabia
- 5.4.5.2 United Arab Emirates
- 5.4.5.3 South Africa
- 5.4.5.4 Egypt
- 5.4.5.5 Rest of Middle East and Africa
- 5.4.1 North America
6 Competitive Landscape
- 6.1 Market Concentration
- 6.2 Strategic Moves (M&A, Partnerships, PPAs)
- 6.3 Market Share Analysis (Market Rank/Share for key companies)
- 6.4 Company Profiles (includes Global level Overview, Market level overview, Core Segments, Financials as available, Strategic Information, Products & Services, and Recent Developments)
- 6.4.1 Bloom Energy Corp.
- 6.4.2 Mitsubishi Power (Mitsubishi Heavy Industries Group)
- 6.4.3 Ceres Power Holdings PLC
- 6.4.4 Sunfire GmbH
- 6.4.5 FuelCell Energy Inc.
- 6.4.6 Elcogen AS
- 6.4.7 Doosan Fuel Cell Co.
- 6.4.8 Convion Ltd
- 6.4.9 Watt Fuel Cell Corp.
- 6.4.10 AVL List GmbH
- 6.4.11 Hexis AG
- 6.4.12 Kyocera Corp.
- 6.4.13 Bosch Thermotechnology
- 6.4.14 Atrex Energy
- 6.4.15 NGK Spark Plug Co.
- 6.4.16 H2E Power Systems
- 6.4.17 Convion Ltd
- 6.4.18 SolidPower SpA
- 6.4.19 Ningbo SOFC Manufacturing
- 6.4.20 GINER ELX
7 Market Opportunities & Future Outlook
- 7.1 White-space & Unmet-Need Assessment

 平面固體氧化物燃料電池:市場佔有率分析、行業趨勢和統計數據以及成長預測(2026-2031 年)
 固體氧化物電解池市場規模、佔有率、成長、全球產業分析、區域趨勢及2026年至2034年預測。
 固體氧化物燃料電池市場-2026-2032年全球市場預測全球固體氧化物電解市場規模、佔有率、趨勢和成長分析報告(2026-2034年)
 固體氧化物燃料電池市場預測至2034年:按組件、類型、應用、最終用戶和地區分類的全球分析
 全球固體氧化物燃料電池(SOFC)市場研究報告,2026版
 全球固體氧化物燃料電池(SOFC)市場(至2040年):產業趨勢與預測
 固體氧化物燃料電池市場規模、佔有率、趨勢和預測:按應用、最終用戶和地區分類,2026-2034年
 平面變壓器市場:依產品類型、額定輸出、應用和地區分類
 亞太地區固體氧化物電解池(SOEC)市場:按應用、產品和國家分類-分析與預測(2025-2035 年)