


 |
市場調查報告書
商品編碼
2115181
平面固體氧化物燃料電池:市場佔有率分析、行業趨勢和統計數據以及成長預測(2026-2031 年)Planar Solid Oxide Fuel Cell - Market Share Analysis, Industry Trends & Statistics, Growth Forecasts (2026 - 2031) |
||||||

※ 本網頁內容可能與最新版本有所差異。詳細情況請與我們聯繫。
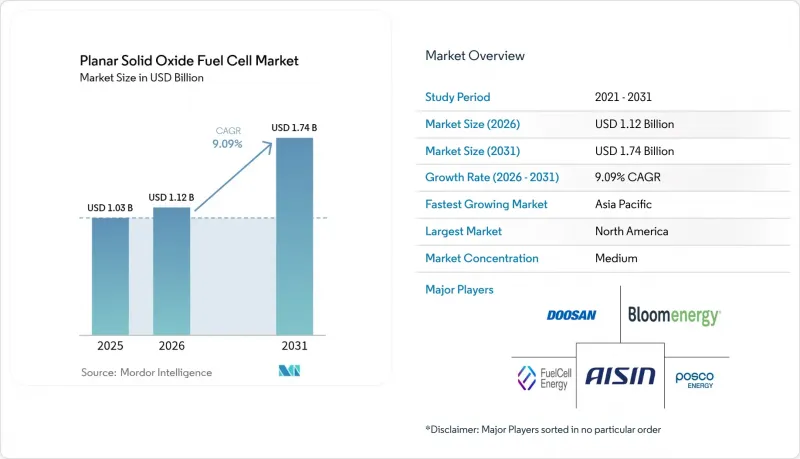
根據 Mordor Intelligence 預測,平面固體氧化物燃料電池的市場規模預計將從 2025 年的 10.3 億美元成長到 2026 年的 11.2 億美元,然後從 2026 年到 2031 年以 9.09% 的複合年成長率成長,到 2031 億美元達到 17.4 年。
本報告按燃料類型(天然氣/液化天然氣、氫氣、其他)、電解質材料(釔安定氧化鋯、鎵酸鹽基鑭、其他)、輸出功率(低於 5kW、高於 1MW、其他)、應用(固定式發電、備用電源/主電源、其他)、最終用戶(商業/工業、資料中心、其他地區)和其他地區(北美)分類。
全球平面固體氧化物燃料電池市場趨勢及洞察
政府脫碳目標與氫能優惠政策
世界各國政府正將氣候中和目標與直接惠及平面固體氧化物燃料電池市場的慷慨財政措施結合。美國《通貨膨脹控制法案》為清潔氫氣生產提供每公斤高達3美元的稅額扣抵;加拿大提供15%至40%的清潔氫氣投資稅額扣抵;德國已投資46億歐元用於23個IPCEI氫氣計畫。澳洲計畫於2027年啟動一項80億澳元的氫氣生產獎勵計畫;英國的「天然氣托運人義務」旨在縮小低碳氫氣與石化燃料之間的成本差距。這些激勵措施正在縮短新設備的投資回收期,重振區域供應鏈,並加速歐洲和亞洲的大規模製造項目。隨著財政措施、碳定價和授權改革的協調一致,一系列資金籌措的項目正在形成,這些項目將在未來十年推動平面固體氧化物燃料電池市場的發展。
資料中心、商業和工業 (C&I) 設施對容錯電源的需求
生成式人工智慧和高效能運算的爆炸性成長使全球資料中心叢集的電力消耗量加倍,迫使營運商重新考慮其對備用柴油發電機的依賴。平面固體氧化物燃料電池系統淨發電效率可達 60%,與冷水循環系統整合後,系統整體效率甚至可能超過 90%,是超大規模資料中心的理想解決方案。近期在比利時商業設施中部署的 9.75 兆瓦系統以及計劃在加州部署的 20 兆瓦系統,都表明買家更傾向於無需對電網進行大規模升級即可安裝的模組化固體氧化物燃料電池陣列。在商業和工業領域,這項技術使企業能夠規避停電風險、利用廢熱獲利,並在不犧牲運作的前提下實現 ESG 指標。預計這一趨勢訂單兆瓦級訂單的成長,而資料中心營運商預計將繼續成為平面固體氧化物燃料電池市場成長最快的終端用戶之一。
與傳統發電機相比,初始投資成本更高
在100千瓦到數兆瓦的功率範圍內,平面固體氧化物燃料電池(SOFC)系統的價格仍然在每千瓦5000美元到10000美元之間,遠高於柴油發電機和燃氣渦輪機。功率在1千瓦到10千瓦之間的較小型號價格甚至可達每千瓦30,000美元,這成為住宅領域普及的一大障礙。平準化電力成本(LCOE)研究表明,氫燃料機組的成本為每千瓦時0.527英鎊,是同等天然氣機組的三倍。這表示零碳運作成本過高。雖然在零售電價高且上網電價補貼政策優惠的地區,經濟可行性有所提高,但要實現全球成本競爭力,關鍵在於大規模生產。根據產業藍圖,一旦年產量超過數百兆瓦,核心成本可望從每千瓦500美元降至100美元以下,預計一旦達到這一轉折點,價格差距將顯著縮小。
細分市場分析
2025年,天然氣/液化天然氣在平面固體氧化物燃料電池市場仍將佔據64.45%的佔有率,這得益於現有的天然氣供應網路以及整合到這些設施中的蒸氣重組能力。然而,氫能專案正以12.35%的複合年成長率穩步推進,隨著綠氫成本的下降和碳價的上漲,預計從2027年起,價格差距將大幅縮小。沼氣和合成氣的整合透過實現掩埋和農業廢棄物的商業化,增強了循環經濟的經濟效益;同時,氨和電子燃料先導計畫正在為尋求零碳替代方案的重型運輸這一細分市場做出貢獻。可在燃料電池和電解模式之間切換的可逆固體氧化物燃料電池模組,使工業設施能夠在用電低谷時段生產氫氣,並在用電高峰時段供電,從而獲得額外的收入來源。此外,能夠實現碳捕獲的電堆設計進一步擴大了煉油廠和鋼鐵廠的目標市場,以幫助它們實現淨零排放。
預計到2031年,氫能的日益普及將繼續推動平面固體氧化物燃料電池(SOFC)市場向零碳應用領域發展。由於各國政府已撥款數百億美元用於電解槽的稅額扣抵,電廠開發商正選擇雙模SOFC/SOEC生產線,以避免未來大宗商品價格波動的風險。結合氫能相容性、未來燃料柔軟性以及電堆價格的下降,SOFC陣列正逐漸成為全球工業脫碳策略的核心解決方案。
由於釔安定氧化鋯(YSZ) 在 700–800 度C的工作溫度範圍內具有優異的離子電導率,且供應基礎成熟,預計到 2025 年,YSZ 將佔據平面固體氧化物燃料電池市場 66.80% 的佔有率。鎵酸鹽基鑭 (LSGM) 的市場正以 10.21% 的複合年成長率 (CAGR) 不斷成長,因為開發商正在尋求能夠減輕機械應力並降低工廠輔助設備 (BoP) 成本的中溫解決方案。钆摻雜氧化鈰則滿足了住宅和小規模商業裝置對快速功率提升的特定需求。
層級構造氧化鈰-氧化鋯-氧化鈰 (CZC) 結構將面積電阻率降低至僅 0.01 Ωcm²,並在 650 度C下實現超過 1.2 W/cm² 的功率密度;而採用冷等靜壓 (CIP) 工藝製造的層級構造YSZ-GDC 結構在溫度下可達到相同溫度的 1界面工程,例如奈米網狀陰極,有助於抑制鉻抑制並提高氧還原反應速率。預計這些電解質創新將使 YSZ 在預測期內保持其主導地位,同時使 LSGM 混合電池在可攜式熱電聯產 (mCHP) 領域獲得高速成長的市場佔有率。
區域分析
亞太地區預計在2025年將維持47.10%的全球出貨量佔有率,這主要得益於中國氫燃料電池市場的快速成長,市場規模從2019年的16.3億元人民幣成長至2023年的39.3億元人民幣,預計2024年支出將達到59.9億元。日本和韓國持續投資於固態氧化物電解池(SOEC)和固態氧化物燃料電池(SOFC)平台。韓國開發的8kW電解槽堆,日產氫氣5.7公斤,是目前韓國最大的電解槽堆。該地區強大的零件供應鏈和積極的氫能發展藍圖,確保了對平面固體氧化物燃料電池市場解決方案的穩定需求。
北美是成長最快的地區,年複合成長率達10.53%。 《通貨膨脹控制法案》下的生產稅額扣抵、美國能源局(DOE) 的研究津貼以及資料中心的擴張,都推動了兆瓦級燃料電池園區的訂單成長。加拿大15%至40%的清潔氫能投資稅額扣抵以及15億加元的無污染燃料基金進一步增強了北美地區的成長動能。住宅領域的應用也在穩步推進,西維吉尼亞的WATT HOME計畫就是一個很好的例子。
歐洲戰略的重點是將重工業與二氧化碳捕集、利用和儲存(CCUS)技術結合。德國10吉瓦的電解目標和46億歐元的IPCEI(工業、電力、碳排放和能源創新計劃)支出,英國的“天然氣托運人義務”,以及托普索公司利用歐盟資金建造的價值9400萬歐元的SOEC超級工廠,都在鞏固該地區的供應側產能。比利時9.75兆瓦的SOFC(固體氧化物燃料電池)部署證明了其在斯堪的納維亞半島的商業性可行性,而在整個歐盟市場,41個運作中的CCUS項目和392個在建項目正從中受益,促進了與碳捕獲型SOFC混合動力電廠的對接。
其他福利
- Excel格式的市場預測(ME)表
- 3個月的分析師支持
目錄
第1章:引言
- 研究假設和市場定義
- 調查範圍
第2章:調查方法
第3章執行摘要
第4章 市場狀況
- 市場概覽
- 市場促進因素
- 政府脫碳目標與氫能優惠政策
- 資料中心和工商業設施對容錯電源的需求
- 由於平面固態氧化物燃料電池製造技術的進步,系統資本支出(CAPEX)得以降低。
- 高電效率和多燃料相容性
- 用於現場製氫的可逆平面固態氧化物燃料電池
- 透過與CCUS相容的平面SOFC混合試點項目,促進電力公司採用該技術。
- 市場限制因素
- 與傳統發電機相比,初始投資成本更高
- 耐熱性和長期劣化問題
- 低功率範圍內具有競爭力的PEMFC電池解決方案
- 鎳價波動對陽極供應鏈的影響
- 供應鏈分析
- 監理情勢
- 技術趨勢(材料、層壓設計)
- 波特五力模型
第5章 市場規模與成長預測
- 按燃料類型
- 天然氣/液化天然氣
- 氫
- 沼氣/合成氣
- 氨氣電子燃料
- 電解質材料
- 釔安定氧化鋯(YSZ)
- 加入钆的二氧化鈰(GDC/CGO)
- 加勒式燈籠(LSGM)
- 其他(ScSZ、複合材料)
- 依輸出類型
- 5千瓦或以下
- 6~50kW
- 51~250kW
- 251kW~1MW
- 1兆瓦或以上
- 透過使用
- 固定式發電
- 熱電聯產(微型熱電聯產)
- 備用電源/主電源(資料中心、通訊)
- 輔助/離網單元
- 最終用戶
- 商業和工業用途
- 公共產業及獨立電力生產商(IPP)
- 資料中心
- 軍事/國防
- 製造業
- 其他(住宅、教育、醫療保健)
- 按地區
- 北美洲
- 美國
- 加拿大
- 墨西哥
- 歐洲
- 德國
- 英國
- 法國
- 義大利
- 北歐國家
- 俄羅斯
- 其他歐洲國家
- 亞太地區
- 中國
- 印度
- 日本
- 韓國
- ASEAN
- 其他亞太國家
- 南美洲
- 巴西
- 阿根廷
- 其他南美國家
- 中東和非洲
- 沙烏地阿拉伯
- 阿拉伯聯合大公國
- 南非
- 埃及
- 其他中東和非洲國家
- 北美洲
第6章 競爭情勢
- 市場集中度
- 策略趨勢(併購、聯盟、購電協議)
- 市場佔有率分析(主要公司的市場排名和佔有率)
- 公司簡介
- Bloom Energy Corp.
- Mitsubishi Power(MHI)
- Aisin Corporation
- Ceres Power Holdings
- Doosan Fuel Cell Co., Ltd.
- FuelCell Energy Inc.
- Bosch(Robert Bosch GmbH)
- SOLIDpower SpA
- Sunfire GmbH
- POSCO Energy
- Kyocera Corporation
- Fuji Electric Co., Ltd.
- Convion Ltd.
- Watt Fuel Cell Corp.
- Elcogen AS
- NGK Spark Plug(Niterra)
- AVL List GmbH
- Atrex Energy
- Adelan Ltd.
- Blue World Technologies
- Ceramic Fuel Cells Ltd.
第7章 市場機會與未來展望
According to Mordor Intelligence, the planar solid oxide fuel cell market size is expected to grow from USD 1.03 billion in 2025 to USD 1.12 billion in 2026 and is forecast to reach USD 1.74 billion by 2031 at 9.09% CAGR over 2026-2031.
This report is Segmented by Fuel Type (Natural Gas/LNG, Hydrogen, and More), Electrolyte Material (Yttria-Stabilised Zirconia, Lanthanum Gallate-Based, and More), Power Output (Up To 5 KW, Above 1 MW, and More), Application (Stationary Power, Backup and Prime Power, and More), End-User (Commercial and Industrial, Data Centres, and More), and Geography (North America, Asia-Pacific, and More).
Global Planar Solid Oxide Fuel Cell Market Trends and Insights
Government decarbonization targets & hydrogen incentives
Governments worldwide are pairing climate-neutrality goals with generous fiscal measures that directly benefit the planar solid oxide fuel cell market. The U.S. Inflation Reduction Act offers up to USD 3 per kg in clean-hydrogen production tax credits, Canada applies a 15-40% Clean Hydrogen Investment Tax Credit, and Germany is channeling EUR 4.6 billion into 23 IPCEI Hydrogen Programme projects. Australia's planned AUD 8 billion hydrogen-production incentive begins in 2027, and the UK's Gas Shipper Obligation is designed to narrow the cost gap between low-carbon hydrogen and fossil fuels.These incentives cut payback periods for new installations, stimulate local supply chains, and accelerate large-scale manufacturing commitments in Europe and Asia. The alignment of fiscal tools, carbon pricing, and permitting reforms is now translating into bankable project pipelines that will propel the planar solid oxide fuel cell market over the next decade.
Demand for resilient power in data centres & C&I sites
Explosive growth in generative AI and high-performance computing is doubling the electricity consumption of global data-center clusters, forcing operators to rethink their reliance on standby diesel. Planar solid oxide fuel cell systems achieve 60% net electrical efficiency and can exceed 90% total system efficiency when integrated with chilled-water loops, making them a compelling fit for hyperscale campuses. Recent 9.75 MW installations across Belgian commercial estates and pending 20 MW deployments in California show buyers favoring modular SOFC arrays that can be sited without extensive grid-interconnection upgrades. In commercial and industrial estates, the same technology enables firms to hedge outage risk, monetize waste heat, and meet ESG metrics without sacrificing uptime. The trend is expected to drive multi-megawatt orders and keep data-center operators among the fastest-growing end-users of the planar solid oxide fuel cell market.
High upfront capital cost vs. conventional generators
Planar SOFC systems still command USD 5,000-10,000 kW-1 in the 100 kW to multi-MW range, well above diesel or gas turbines. Small 1-10 kW models can reach USD 30,000 kW-1, a hurdle that suppresses residential adoption. Levelized-cost studies show hydrogen-fueled units at GBP 0.527 kWh-1, triple the natural-gas equivalent, underscoring the premium for zero-carbon operation. Economics improve in regions with high retail electricity prices and supportive feed-in tariffs, but global parity hinges on mass production. Industry roadmaps indicate that stack costs could decrease from USD 500 kW-1 to under USD 100 kW-1 when volumes exceed several hundred megawatts annually, a tipping point that would significantly reduce the price gap.
Other drivers and restraints analyzed in the detailed report include:
- Advances in planar SOFC manufacturing lower system CAPEX
- High electrical efficiency & multi-fuel flexibility
- Thermal durability & long-term degradation issues
For complete list of drivers and restraints, kindly check the Table Of Contents.
Segment Analysis
Natural gas/LNG retained 64.45% of the planar solid oxide fuel cell market share in 2025, buttressed by existing gas grids and the architecture's built-in steam reforming capacity. Hydrogen projects, however, are advancing at a 12.35% CAGR and are expected to narrow the gap sharply after 2027 as green-hydrogen costs fall and carbon pricing widens. Biogas-syngas integrations bolster circular-economy economics by monetizing landfill or agricultural waste streams, while ammonia and e-fuel pilots serve heavy-transport niches seeking zero-carbon alternatives. Reversible SOFC modules that switch between fuel-cell and electrolysis modes enable industrial sites to generate hydrogen during low-demand periods and export power at peak tariff hours, unlocking additional revenue. Carbon-capture-compatible stack designs further expand the addressable market among refineries and steel mills pursuing net-zero pathways.
Hydrogen's advance will continue to pull the planar solid oxide fuel cell market size toward zero-carbon applications through 2031. With governments earmarking tens of billions of dollars for electrolyzer tax credits, plant developers are opting for dual-mode SOFC/SOEC lines that hedge against future commodity price fluctuations. The combination of hydrogen readiness, future fuel flexibility, and falling stack prices positions SOFC arrays as a central solution for industrial decarbonization strategies worldwide.
Yttria-stabilized zirconia (YSZ) commanded a 66.80% share of the planar solid oxide fuel cell market in 2025, due to its robust ionic conductivity within the 700-800 °C operating window and a mature supply base. Lanthanum gallate (LSGM) is expanding at a 10.21% CAGR as developers seek intermediate-temperature options that alleviate mechanical stress and reduce balance-of-plant costs. Gadolinium-doped ceria meets the niche demand for residential and light-commercial units that require quick ramp rates.
Tri-layer ceria-zirconia-ceria builds boost area-specific resistance to just 0.01 Ω cm2, achieving over 1.2 W cm-2 at 650 °C, while bilayer YSZ-GDC configurations produced via cold-isostatic pressing reach 1.251 W cm-2 at the same temperature. Interface engineering, such as nano-web cathodes, helps curb chromium poisoning and enhances oxygen-reduction kinetics. These electrolyte innovations should preserve YSZ's lead over the forecast horizon while allowing LSGM hybrids to capture a high-growth share in the portable and mCHP segments.
Complete Report Scope:
- By Fuel Type
- Natural Gas/LNG
- Hydrogen
- Biogas/Syngas
- Ammonia and e-Fuels
- By Electrolyte Material
- Yttria-stabilised Zirconia (YSZ)
- Gadolinium-doped Ceria (GDC/CGO)
- Lanthanum Gallate-based (LSGM)
- Others (ScSZ, Composite)
- By Power Output
- Up to 5 kW
- 6 to 50 kW
- 51 to 250 kW
- 251 kW to 1 MW
- Above 1 MW
- By Application
- Stationary Power
- Combined Heat and Power (mCHP)
- Backup and Prime Power (Data Centres, Telecom)
- Auxiliary and Off-grid Units
- By End-User
- Commercial and Industrial
- Utilities and IPPs
- Data Centres
- Military and Defense
- Manufacturing
- Others (Residential, Education, Healthcare)
- By Geography
- North America
- United States
- Canada
- Mexico
- Europe
- Germany
- United Kingdom
- France
- Italy
- NORDIC Countries
- Russia
- Rest of Europe
- Asia-Pacific
- China
- India
- Japan
- South Korea
- ASEAN Countries
- Rest of Asia-Pacific
- South America
- Brazil
- Argentina
- Rest of South America
- Middle East and Africa
- Saudi Arabia
- United Arab Emirates
- South Africa
- Egypt
- Rest of Middle East and Africa
- North America
Geography Analysis
Asia-Pacific retained a 47.10% share of 2025 shipments on the back of China's hydrogen-fuel-cell market jump from CNY 1.63 billion in 2019 to CNY 3.93 billion in 2023, with 2024 spend forecast at CNY 5.99 billion. Japan and South Korea continue to invest in both SOEC and SOFC platforms. Korea's 8 kW electrolyzer stack, which produces 5.7 kg of H2 per day, is the country's largest to date. The region's deep component supply chains and aggressive hydrogen road-maps ensure steady demand for planar solid oxide fuel cell market solutions.
North America is the fastest-growing territory at a 10.53% CAGR. The Inflation Reduction Act's production credits, combined with DOE research grants and the expanding data center footprint, are propelling orders for multi-megawatt fuel cell parks. Canada's 15-40% Clean Hydrogen Investment Tax Credit and a CAD 1.5 billion Clean Fuels Fund reinforce continental momentum. Residential adoption is also advancing, highlighted by the WATT HOME program in West Virginia.
Europe's strategy centers on pairing heavy industry with CCUS. Germany's 10 GW electrolysis target and EUR 4.6 billion IPCEI outlays, the UK's Gas Shipper Obligation, and Topsoe's EUR 94 million EU-funded SOEC gigafactory cement the region's supply-side capacity. Belgium's 9.75 MW SOFC deployment signals commercial viability in northern Europe, while broader EU markets benefit from 41 operational CCUS sites and 392 projects in development, providing a ready tie-in for carbon-capture-compatible SOFC hybrid plants.
- Bloom Energy Corp.
- Mitsubishi Power (MHI)
- Aisin Corporation
- Ceres Power Holdings
- Doosan Fuel Cell Co., Ltd.
- FuelCell Energy Inc.
- Bosch (Robert Bosch GmbH)
- SOLIDpower S.p.A.
- Sunfire GmbH
- POSCO Energy
- Kyocera Corporation
- Fuji Electric Co., Ltd.
- Convion Ltd.
- Watt Fuel Cell Corp.
- Elcogen AS
- NGK Spark Plug (Niterra)
- AVL List GmbH
- Atrex Energy
- Adelan Ltd.
- Blue World Technologies
- Ceramic Fuel Cells Ltd.
Additional Benefits:
- The market estimate (ME) sheet in Excel format
- 3 months of analyst support
TABLE OF CONTENTS
1 Introduction
- 1.1 Study Assumptions & Market Definition
- 1.2 Scope of the Study
2 Research Methodology
3 Executive Summary
4 Market Landscape
- 4.1 Market Overview
- 4.2 Market Drivers
- 4.2.1 Government decarbonization targets & hydrogen incentives
- 4.2.2 Demand for resilient power in data?centres & C&I sites
- 4.2.3 Advances in planar SOFC manufacturing lower system CAPEX
- 4.2.4 High electrical efficiency & multi-fuel flexibility
- 4.2.5 Reversible planar SOFCs for on-site green-H? production
- 4.2.6 CCUS-ready planar SOFC hybrid pilots boost utility uptake
- 4.3 Market Restraints
- 4.3.1 High upfront capital cost vs. conventional generators
- 4.3.2 Thermal durability & long-term degradation issues
- 4.3.3 Rival PEMFC & battery solutions in low-power range
- 4.3.4 Nickel price volatility impacting anode supply chain
- 4.4 Supply-Chain Analysis
- 4.5 Regulatory Landscape
- 4.6 Technological Outlook (materials, stack designs)
- 4.7 Porter's Five Forces
- 4.7.1 Bargaining Power of Suppliers
- 4.7.2 Bargaining Power of Buyers
- 4.7.3 Threat of New Entrants
- 4.7.4 Threat of Substitutes
- 4.7.5 Intensity of Competitive Rivalry
5 Market Size & Growth Forecasts
- 5.1 By Fuel Type
- 5.1.1 Natural Gas/LNG
- 5.1.2 Hydrogen
- 5.1.3 Biogas/Syngas
- 5.1.4 Ammonia and e-Fuels
- 5.2 By Electrolyte Material
- 5.2.1 Yttria-stabilised Zirconia (YSZ)
- 5.2.2 Gadolinium-doped Ceria (GDC/CGO)
- 5.2.3 Lanthanum Gallate-based (LSGM)
- 5.2.4 Others (ScSZ, Composite)
- 5.3 By Power Output
- 5.3.1 Up to 5 kW
- 5.3.2 6 to 50 kW
- 5.3.3 51 to 250 kW
- 5.3.4 251 kW to 1 MW
- 5.3.5 Above 1 MW
- 5.4 By Application
- 5.4.1 Stationary Power
- 5.4.2 Combined Heat and Power (mCHP)
- 5.4.3 Backup and Prime Power (Data Centres, Telecom)
- 5.4.4 Auxiliary and Off-grid Units
- 5.5 By End-User
- 5.5.1 Commercial and Industrial
- 5.5.2 Utilities and IPPs
- 5.5.3 Data Centres
- 5.5.4 Military and Defense
- 5.5.5 Manufacturing
- 5.5.6 Others (Residential, Education, Healthcare)
- 5.6 By Geography
- 5.6.1 North America
- 5.6.1.1 United States
- 5.6.1.2 Canada
- 5.6.1.3 Mexico
- 5.6.2 Europe
- 5.6.2.1 Germany
- 5.6.2.2 United Kingdom
- 5.6.2.3 France
- 5.6.2.4 Italy
- 5.6.2.5 NORDIC Countries
- 5.6.2.6 Russia
- 5.6.2.7 Rest of Europe
- 5.6.3 Asia-Pacific
- 5.6.3.1 China
- 5.6.3.2 India
- 5.6.3.3 Japan
- 5.6.3.4 South Korea
- 5.6.3.5 ASEAN Countries
- 5.6.3.6 Rest of Asia-Pacific
- 5.6.4 South America
- 5.6.4.1 Brazil
- 5.6.4.2 Argentina
- 5.6.4.3 Rest of South America
- 5.6.5 Middle East and Africa
- 5.6.5.1 Saudi Arabia
- 5.6.5.2 United Arab Emirates
- 5.6.5.3 South Africa
- 5.6.5.4 Egypt
- 5.6.5.5 Rest of Middle East and Africa
- 5.6.1 North America
6 Competitive Landscape
- 6.1 Market Concentration
- 6.2 Strategic Moves (M&A, Partnerships, PPAs)
- 6.3 Market Share Analysis (Market Rank/Share for key companies)
- 6.4 Company Profiles (includes Global level Overview, Market level overview, Core Segments, Financials as available, Strategic Information, Products & Services, and Recent Developments)
- 6.4.1 Bloom Energy Corp.
- 6.4.2 Mitsubishi Power (MHI)
- 6.4.3 Aisin Corporation
- 6.4.4 Ceres Power Holdings
- 6.4.5 Doosan Fuel Cell Co., Ltd.
- 6.4.6 FuelCell Energy Inc.
- 6.4.7 Bosch (Robert Bosch GmbH)
- 6.4.8 SOLIDpower S.p.A.
- 6.4.9 Sunfire GmbH
- 6.4.10 POSCO Energy
- 6.4.11 Kyocera Corporation
- 6.4.12 Fuji Electric Co., Ltd.
- 6.4.13 Convion Ltd.
- 6.4.14 Watt Fuel Cell Corp.
- 6.4.15 Elcogen AS
- 6.4.16 NGK Spark Plug (Niterra)
- 6.4.17 AVL List GmbH
- 6.4.18 Atrex Energy
- 6.4.19 Adelan Ltd.
- 6.4.20 Blue World Technologies
- 6.4.21 Ceramic Fuel Cells Ltd.
7 Market Opportunities & Future Outlook
- 7.1 White-space & Unmet-need Assessment

 固體氧化物電解池市場規模、佔有率、成長、全球產業分析、區域趨勢及2026年至2034年預測。
 固體氧化物燃料電池(SOFC):市場佔有率分析、行業趨勢和統計數據以及成長預測(2026-2031 年)
 固體氧化物燃料電池市場-2026-2032年全球市場預測全球固體氧化物電解市場規模、佔有率、趨勢和成長分析報告(2026-2034年)
 固體氧化物燃料電池市場預測至2034年:按組件、類型、應用、最終用戶和地區分類的全球分析
 全球固體氧化物燃料電池(SOFC)市場研究報告,2026版
 全球固體氧化物燃料電池(SOFC)市場(至2040年):產業趨勢與預測
 固體氧化物燃料電池市場規模、佔有率、趨勢和預測:按應用、最終用戶和地區分類,2026-2034年
 平面變壓器市場:依產品類型、額定輸出、應用和地區分類
 亞太地區固體氧化物電解池(SOEC)市場:按應用、產品和國家分類-分析與預測(2025-2035 年)