


 |
市場調查報告書
商品編碼
2120388
3D地圖繪製和3D建模:市場佔有率分析、行業趨勢和統計數據、成長預測(2026-2031年)3D Mapping And 3D Modelling - Market Share Analysis, Industry Trends & Statistics, Growth Forecasts (2026 - 2031) |
||||||

※ 本網頁內容可能與最新版本有所差異。詳細情況請與我們聯繫。
根據 Mordor Intelligence 預測,3D 地圖和 3D 建模市場預計將從 2025 年的 85.7 億美元成長到 2026 年的 97.4 億美元,然後在 2031 年達到 184.4 億美元,2026 年至 2031 年的複合年成長率為 13.62%。
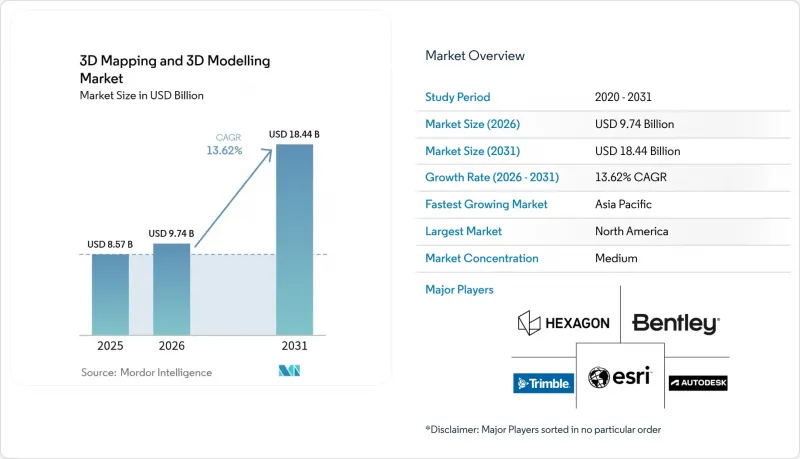
本報告按元件(硬體、軟體、服務)、類型(3D 映射、3D 建模)、應用程式(投影映射、紋理映射、3D 渲染和視覺化等)、最終用戶產業(醫療保健、建築施工、國防安全等)、部署模式(本地部署、雲端部署)和地區進行細分。市場預測以美元計價。
全球3D地圖繪製與3D建模市場趨勢及洞察
智慧型手機LiDAR使即時3D捕捉技術得到更廣泛的應用。
蘋果將LiDAR(LiDAR)整合到 iPhone 和 iPad Pro 中,並計劃於 2025 年將其應用於安卓旗艦機型,這使得現場團隊無需專用雷射掃描儀即可實現毫米級精度。售價低於 5000 美元的可攜式深度感測器正逐漸成為倉庫和隧道等場所入門級攝影測量無人機的替代方案,這些場所的遮擋情況常常會阻礙結構運動(SfM)工作流程。美國國家標準與技術研究院(NIST)於 2024 年發布了精確度基準,加速了消費級掃描技術在建築資訊模型(BIM)提交的應用。為此,軟體公司已將即時網格重建功能整合到行動應用程式中,使用戶能夠將 OBJ 和 FBX 檔案直接匯出到雲端協作平台。這使得從採集到共用的周期從幾天縮短到幾分鐘。更低的硬體成本和簡化的工作流程正在擴大目標用戶群體,從測量員擴展到總承包商和設施管理人員,從而推動了對雲端渲染訂閱服務的短期需求。
將 3D 地理空間圖層產生整合到 AI 設計套件中
NVIDIA 的 Cosmos 平台將基於物理的場景生成與經緯度座標相結合,使規劃人員能夠合成符合地籍邊界和高程模型的完整城市街區。 Autodesk 的 Forma 將生成式設計工具與 Esri ArcGIS 圖層結合,使建築師能夠在數小時內(而非數週)完成符合分區限制和日照規定的大規模研究。 2024 年,Google Earth 和 Cesium 採用了開放地理空間聯盟 (OGC) 的 3D Tiles 標準,實現了大規模地形網格串流到基於瀏覽器的 AI 工具的標準化,並消除了多用戶會話中的延遲障礙。交通運輸領域的早期先導計畫正在 AI 產生的 3D 走廊內進行高速公路路線評估,這些走廊會根據環境緩衝區的變化自動更新,以動態參數化模型取代靜態 CAD 檔案。因此,支出正從手動建模轉向用於準備精選資料集和定義約束條件的服務,進一步提升了高品質地理空間資料的價值。
GPU和感測器供應鏈出現嚴重波動
2025 年全年,NVIDIA 的 H100 和 H200 GPU 供應持續緊張,因為超大規模雲端用戶消耗了大量 4 奈米晶圓產能。這導致競標競爭異常激烈,小規模的視覺化公司難以與之抗衡。車規級固態雷射雷達的前置作業時間超過 26 週,延誤了自動駕駛汽車測繪項目,並迫使一些供應商轉向僅使用攝影機的感知堆疊。亞馬遜雲端服務 (AWS) 在 2025 年初將 EC2 P5 執行個體的價格提高了 18%,擠壓了營運固定價格渲染合約的服務供應商的利潤空間。針對出口到中國的先進晶片的地緣政治限制加劇了不確定性,並推動了垂直整合,例如 Hexagon 收購感測器製造資產。在供應穩定之前,飆升的成本和硬體短缺可能會限制整個生態系統的短期擴張計劃。
細分市場分析
至2025年,軟體將佔3D測繪和3D建模市場49.37%的佔有率。這主要得益於Autodesk、Bentley和Trimble等公司提供的永久更新訂閱服務,這些服務將雲端儲存和維護整合到固定的年費中。硬體銷售仍佔據較大佔有率,但隨著智慧型手機內建的雷射雷達取代入門級掃描儀,其成長速度趨於平緩,這給同質化細分市場的利潤率帶來了壓力。同時,預計到2031年,服務業的複合年成長率將達到14.28%,因為企業擴大將攝影測量後處理、網格重建和數位孿生整合等工作外包給外部專家。在亞馬遜雲端服務(AWS)、微軟Azure和谷歌雲端上託管的GPU渲染服務無需企業自行部署叢集,因此對於優先考慮營運成本柔軟性的中小企業來說,這是一個極具吸引力的選擇。
由於客戶難以應對開放地理空間聯盟 (OGC) 模式的分散和專有格式,培訓、諮詢和資料遷移合約如今已成為與供應商建立長期合作關係的基石。不斷擴展的服務產品透過將領域專業知識直接整合到客戶的工作流程中,而非僅僅銷售獨立工具,從而提高了客戶留存率。將部署與持續最佳化相結合的供應商能夠獲得可預測的經常性收入,這種模式有助於穩定 3D 地圖和 3D 建模市場的整體規模,使其免受硬體供應鏈波動的影響。隨著資產所有者對即時模型維護的需求日益成長,能夠將雷射雷達測量、雲端協作和分析相結合的服務供應商佔據了最具競爭力的地位。
預計到2025年,3D建模將佔總收入的63.84%,反映出其在娛樂製作流程、產品設計和建築視覺化等領域的成熟應用。然而,隨著自動駕駛車隊和智慧城市營運商需要每週或每日更新的厘米級精度數據,3D地圖繪製預計將以14.03%的複合年成長率成長。汽車製造商正委託HERE Technologies、TomTom和運作公司提供始終線上高清道路圖層,而新加坡、杜拜和首爾等地的市政當局正在將3D建築網格與交通感測器整合,以實現即時最佳化。
隨著雷射雷達點雲資料被直接轉換為參數化建築資訊模型(BIM)以支援設施管理和維修規劃,測繪和建模之間的界限正在逐漸模糊。如今,生成式人工智慧引擎正利用地籍資料合成城市的幾何結構,進一步模糊了二者的功能邊界。這種技術融合促使供應商將這兩種功能打包在一起,因此無需客戶使用單獨的工具鏈。隨著即時城市孿生模型和自動駕駛車輛路線的日益普及,動態測繪將逐漸削弱建模在3D測繪和建模市場中長期佔據的主導地位。
區域分析
到2025年,北美將佔全球銷售額的36.78%,在預測期開始時佔據3D地圖和3D建模市場的最大佔有率。目前,由於國防領域的地理空間預算趨於平穩,以及娛樂工作室簡化資產再利用流程,市場成長速度有所放緩,但聯邦政府對數位化建設和高清道路測繪的津貼支撐了市場需求。相比之下,亞太地區預計到2031年將以14.67%的複合年成長率成長,成長速度位居全球之首。中國的「十四五」規劃已撥款5,000億元人民幣(約700億美元)用於城市級數位孿生建設。印度地理空間資料政策的自由化使得私人企業能夠贏得先前由印度測繪局獨家承接的市政測繪合約。
在歐洲,ISO 19650標準的實施正在推動數位孿生技術的發展。該標準要求超過5000萬英鎊的公共項目必須交付數位孿生成果。德國已撥款3億歐元(約3.3億美元)用於高速公路上的示範計畫。英國的國家數位孿生計畫正在整合各機構的交通、水務和能源資產數據。在中東,政府對沙烏地阿拉伯NEOM等大型企劃的資助正在加速雲端原生平台的普及,這些平台能夠將Terabyte級網格資料流傳輸給分散式團隊。此外,該地區對基於高解析度建築外觀數據的溫度控管和能源最佳化研究也日益關注數位孿生技術。
儘管南美洲仍處於起步階段,但基於無人機的攝影測量技術已在巴西的基礎設施監測和阿根廷的精密農業試點計畫中得到應用。隨著全國寬頻的普及和無人機監管的放寬,如果初步成果能夠證明預算投入的合理性,預計該技術將逐步推廣。在非洲,該技術的初步應用集中在南非的礦區和埃及的新行政首都,這些地區正利用雷射雷達和航空攝影技術進行土方工程和公用設施走廊的建設。一旦宏觀經濟情勢穩定下來,這些新興地區的成長動能可能會推動3D測繪和3D建模市場的整體規模超出目前的預期。
其他好處:
- Excel格式的市場預測(ME)表
- 3個月的分析師支持
目錄
第1章:引言
- 研究假設和市場定義
- 調查範圍
第2章:調查方法
第3章執行摘要
第4章 市場狀況
- 市場概覽
- 市場促進因素
- 智慧型手機的LiDAR將使即時3D捕捉更加普及。
- 將3D地理空間圖層整合到生成式AI設計套件中
- 公共基礎設施項目中實施數位孿生的要求
- 媒體和零售業中支援 XR 的 3D 內容蓬勃發展。
- 雲端原生 3D 渲染顯著降低了中小企業的整體擁有成本 (TCO)。
- 自動駕駛汽車高清地圖的發展
- 市場限制因素
- GPU和感測器供應鏈波動性較大
- 大型文件的資料主權合規成本
- 攝影測量後處理領域人員短缺
- 3D資料標準的差異阻礙了互通性。
- 產業價值鏈分析
- 監理情勢
- 技術展望
- 宏觀經濟因素的影響
- 波特五力分析
第5章 市場規模與成長預測
- 按組件
- 硬體
- 軟體
- 服務
- 按類型
- 3D映射
- 3D建模
- 透過使用
- 投影映射
- 紋理映射
- 地圖和導航
- 3D渲染和視覺化
- 按最終用戶行業分類
- 娛樂與媒體
- 衛生保健
- 建築/施工
- 汽車和運輸業
- 國防與安全
- 部署模式
- 現場
- 雲
- 按地區
- 北美洲
- 美國
- 加拿大
- 墨西哥
- 南美洲
- 巴西
- 阿根廷
- 其他南美國家
- 歐洲
- 英國
- 德國
- 法國
- 義大利
- 其他歐洲國家
- 亞太地區
- 中國
- 日本
- 印度
- 韓國
- 其他亞太國家
- 中東和非洲
- 中東
- 阿拉伯聯合大公國
- 沙烏地阿拉伯
- 其他中東國家
- 非洲
- 南非
- 埃及
- 其他非洲國家
- 中東
- 北美洲
第6章 競爭情勢
- 市場集中度
- 策略趨勢
- 市佔率分析
- 公司簡介
- Autodesk Inc.
- Bentley Systems Inc.
- ESRI Inc.
- Trimble Inc.
- Hexagon AB
- Saab AB
- Airbus Defence and Space SAS
- Intermap Technologies Corp.
- Topcon Positioning Systems Inc.
- CyberCity 3D Inc.
- The Foundry Visionmongers Ltd.
- Golden Software LLC
- Pix4D SA
- Maxon Computer GmbH
- Dassault Systemes SE
- Pixologic Inc.
- Matterport Inc.
- FARO Technologies Inc.
- Leica Geosystems AG
- Apple Inc.
第7章 市場機會與未來展望
According to Mordor Intelligence, the 3D mapping and 3D modelling market size is expected to grow from USD 8.57 billion in 2025 to USD 9.74 billion in 2026 and is forecast to reach USD 18.44 billion by 2031 at a 13.62% CAGR over 2026-2031.
This report is Segmented by Component (Hardware, Software, Services), Type (3D Mapping, and 3D Modelling), Application (Projection Mapping, Texture Mapping, 3D Rendering and Visualisation, and More), End-User Vertical (Healthcare, Building and Construction, Defense and Security, and More), Deployment (On-Premise, and Cloud), and Geography. The Market Forecasts are Provided in Terms of Value (USD).
Global 3D Mapping And 3D Modelling Market Trends and Insights
Smartphone LiDAR Commoditises Real-Time 3D Capture
Apple brought LiDAR to iPhone and iPad Pro devices, and Android flagships followed in 2025, enabling field teams to achieve millimeter-level accuracy without dedicated laser scanners. Portable depth sensors priced below USD 5,000 are now displacing entry-level photogrammetry drones in warehouses and tunnels, where occlusion hampers structure-from-motion workflows. The National Institute of Standards and Technology published accuracy benchmarks in 2024 that accelerated the acceptance of consumer-grade scans in building information modelling submittals. Software firms responded by embedding real-time mesh reconstruction into mobile apps so users can export OBJ or FBX files directly to cloud collaboration hubs, shrinking capture-to-share cycles from days to minutes. Lower hardware costs and simplified workflows expand the addressable user base from surveyors to general contractors and facility managers, lifting near-term demand for cloud rendering subscriptions.
Integration of 3D Geospatial Layers into Generative-AI Design Suites
NVIDIA's Cosmos platform merges physics-based scene generation with latitude-longitude coordinates, enabling planners to synthesize entire city blocks that honor cadastral boundaries and elevation models. Autodesk's Forma pairs generative design tools with Esri ArcGIS layers, letting architects run massing studies that respect zoning envelopes and solar regulations in hours rather than weeks. Adoption of the Open Geospatial Consortium 3D Tiles standard by Google Earth and Cesium in 2024 standardizes streaming of massive terrain meshes into browser-based AI tools, removing latency barriers to multi-user sessions. Early transportation pilots now evaluate highway alignments within AI-generated 3D corridors that automatically update when environmental buffers shift, replacing static CAD files with dynamic parametric models. As a result, spending is shifting from manual modelling labor to curated dataset preparation and constraint definition services, reinforcing the value of high-quality geospatial inputs.
High GPU and Sensor Supply-Chain Volatility
NVIDIA H100 and H200 GPUs remained under allocation constraints through 2025 as hyperscale cloud buyers consumed most 4-nanometer wafer capacity, creating bidding wars that smaller visualization firms could not match. Automotive-grade solid-state LiDAR lead times exceeded 26 weeks, delaying autonomous-vehicle mapping programs and forcing some suppliers to pivot to camera-only perception stacks. Amazon Web Services increased EC2 P5 instance pricing by 18% in early 2025, compressing margins for service bureaus running fixed-price render contracts. Geopolitical export controls on advanced chips to China amplified uncertainty, encouraging vertical integration moves such as Hexagon's acquisition of sensor-fabrication assets. Until supply stabilizes, cost spikes and hardware shortages will temper near-term expansion plans across the ecosystem.
Other drivers and restraints analyzed in the detailed report include:
- Mandates for Digital Twins in Public Infrastructure Projects
- XR-Ready 3D Content Boom in Media and Retail
- Large-File Data-Sovereignty Compliance Costs
For complete list of drivers and restraints, kindly check the Table Of Contents.
Segment Analysis
Software captured 49.37% of the 3D mapping and 3D modelling market share in 2025 because perpetual-update subscriptions from Autodesk, Bentley, and Trimble bundled cloud storage and maintenance into fixed annual fees. Hardware revenues, while substantial, are flattening as smartphone-embedded LiDAR supplants entry-level scanners, squeezing margins in the commoditized tier. Services, however, are forecast to log a 14.28% CAGR through 2031 as enterprises turn to external specialists for photogrammetry post-processing, mesh reconstruction, and digital twin integration. Managed GPU rendering across Amazon Web Services, Microsoft Azure, and Google Cloud removes the capital expenditure for on-premises clusters, appealing to small and medium firms that prize operating-expense flexibility.
Training, consulting, and data-migration contracts now anchor long-term vendor relationships because clients struggle with fragmented Open Geospatial Consortium schemas and proprietary formats. The rising service mix deepens stickiness by embedding domain expertise directly into customer workflows rather than selling stand-alone tools. Vendors that pair implementation with continuous optimization earn predictable recurring revenue, a pattern that stabilizes the overall 3D mapping and 3D modelling market size against hardware supply-chain swings. As asset owners push for real-time model upkeep, service providers that can combine LiDAR capture, cloud orchestration, and analytics occupy the most defensible competitive positions.
3D modelling accounted for 63.84% of revenue in 2025, reflecting entrenched use in entertainment pipelines, product design, and architectural visualization. Yet 3D mapping is projected to grow at a 14.03% CAGR, as autonomous-vehicle fleets and smart-city operators require centimeter-level updates refreshed weekly or even daily. Automotive original-equipment manufacturers contract HERE Technologies, TomTom, and Mobileye for always-on, high-definition road layers, while municipalities in Singapore, Dubai, and Seoul integrate 3D building grids with traffic sensors for live optimization.
The boundary between mapping and modelling is narrowing as LiDAR point clouds are directly converted into parametric building information models that support facilities management and renovation planning. Generative-AI engines now synthesize urban geometry from cadastral data, further blurring functional lines. This technical convergence encourages platform vendors to package both capabilities so clients need not juggle separate toolchains. As real-time city twins and driverless-car corridors proliferate, dynamic mapping will erode the historical dominance of modelling in the 3D mapping and modelling market.
Complete Report Scope:
- By Component
- Hardware
- Software
- Services
- By Type
- 3D Mapping
- 3D Modelling
- By Application
- Projection Mapping
- Texture Mapping
- Maps and Navigation
- 3D Rendering and Visualisation
- By End-user Vertical
- Entertainment and Media
- Healthcare
- Building and Construction
- Automotive and Transportation
- Defense and Security
- By Deployment
- On-premise
- Cloud
- By Geography
- North America
- United States
- Canada
- Mexico
- South America
- Brazil
- Argentina
- Rest of South America
- Europe
- United Kingdom
- Germany
- France
- Italy
- Rest of Europe
- Asia Pacific
- China
- Japan
- India
- South Korea
- Rest of Asia Pacific
- Middle East and Africa
- Middle East
- United Arab Emirates
- Saudi Arabia
- Rest of Middle East
- Africa
- South Africa
- Egypt
- Rest of Africa
- Middle East
- North America
Geography Analysis
North America accounted for 36.78% of global revenue in 2025, giving the region the largest share of the 3D mapping and 3D modelling market at the start of the forecast period. Growth now moderates as defense geospatial budgets plateau and entertainment studios streamline asset reuse, yet federal grants for digital construction and high-definition road mapping sustain demand. Asia-Pacific, by contrast, is projected to expand at a 14.67% CAGR through 2031, the fastest pace worldwide. China's 14th Five-Year Plan earmarks CNY 500 billion (USD 70 billion) for city-scale digital twins. India's liberalized geospatial data policy allows private firms to win municipal mapping contracts once reserved for the Survey of India.
Europe benefits from ISO 19650 mandates that require digital-twin deliverables on public projects above GBP 50 million, while Germany has allocated EUR 300 million (USD 330 million) for autobahn pilots. The United Kingdom's National Digital Twin Programme synchronizes data from transport, water, and energy assets across agencies. In the Middle East, sovereign wealth funding for mega-projects such as Saudi Arabia's NEOM is accelerating the adoption of cloud-native platforms that stream terabyte-scale meshes to dispersed teams. Regional interest is amplified by heat management and energy optimization studies that depend on high-resolution building shells.
South America remains early stages, yet Brazil's infrastructure monitoring and Argentina's precision-agriculture pilots validate drone photogrammetry use cases. National broadband upgrades and relaxed unmanned-aircraft rules promise gradual scaling once early results justify budget allocations. In Africa, initial deployments center on South Africa's mining belt and Egypt's new administrative capital, where LiDAR and aerial imagery guide earthworks and utility corridors. Collectively, these emerging regions could lift the overall 3D mapping and 3D modelling market size beyond current forecasts if macroeconomic conditions stabilize.
- Autodesk Inc.
- Bentley Systems Inc.
- ESRI Inc.
- Trimble Inc.
- Hexagon AB
- Saab AB
- Airbus Defence and Space SAS
- Intermap Technologies Corp.
- Topcon Positioning Systems Inc.
- CyberCity 3D Inc.
- The Foundry Visionmongers Ltd.
- Golden Software LLC
- Pix4D SA
- Maxon Computer GmbH
- Dassault Systemes SE
- Pixologic Inc.
- Matterport Inc.
- FARO Technologies Inc.
- Leica Geosystems AG
- Apple Inc.
Additional Benefits:
- The market estimate (ME) sheet in Excel format
- 3 months of analyst support
TABLE OF CONTENTS
1 INTRODUCTION
- 1.1 Study Assumptions and Market Definition
- 1.2 Scope of the Study
2 RESEARCH METHODOLOGY
3 EXECUTIVE SUMMARY
4 MARKET LANDSCAPE
- 4.1 Market Overview
- 4.2 Market Drivers
- 4.2.1 Smartphone Lidar Commoditises Real-Time 3D Capture
- 4.2.2 Integration of 3D Geospatial Layers into Generative-AI Design Suites
- 4.2.3 Mandates for Digital Twins in Public Infrastructure Projects
- 4.2.4 XR-Ready 3D Content Boom in Media and Retail
- 4.2.5 Cloud-Native 3D Rendering Slashes TCO for SMEs
- 4.2.6 Growth of Autonomous-Vehicle HD Maps
- 4.3 Market Restraints
- 4.3.1 High GPU and Sensor Supply-Chain Volatility
- 4.3.2 Large-File Data-Sovereignty Compliance Costs
- 4.3.3 Skills Shortage in Photogrammetry Post-Processing
- 4.3.4 Fragmented 3D Data Standards Slow Interoperability
- 4.4 Industry Value Chain Analysis
- 4.5 Regulatory Landscape
- 4.6 Technological Outlook
- 4.7 Impact of Macroeconomic Factors
- 4.8 Porter's Five Forces Analysis
- 4.8.1 Bargaining Power of Suppliers
- 4.8.2 Bargaining Power of Buyers
- 4.8.3 Threat of New Entrants
- 4.8.4 Threat of Substitutes
- 4.8.5 Intensity of Competitive Rivalry
5 MARKET SIZE AND GROWTH FORECASTS (VALUE)
- 5.1 By Component
- 5.1.1 Hardware
- 5.1.2 Software
- 5.1.3 Services
- 5.2 By Type
- 5.2.1 3D Mapping
- 5.2.2 3D Modelling
- 5.3 By Application
- 5.3.1 Projection Mapping
- 5.3.2 Texture Mapping
- 5.3.3 Maps and Navigation
- 5.3.4 3D Rendering and Visualisation
- 5.4 By End-user Vertical
- 5.4.1 Entertainment and Media
- 5.4.2 Healthcare
- 5.4.3 Building and Construction
- 5.4.4 Automotive and Transportation
- 5.4.5 Defense and Security
- 5.5 By Deployment
- 5.5.1 On-premise
- 5.5.2 Cloud
- 5.6 By Geography
- 5.6.1 North America
- 5.6.1.1 United States
- 5.6.1.2 Canada
- 5.6.1.3 Mexico
- 5.6.2 South America
- 5.6.2.1 Brazil
- 5.6.2.2 Argentina
- 5.6.2.3 Rest of South America
- 5.6.3 Europe
- 5.6.3.1 United Kingdom
- 5.6.3.2 Germany
- 5.6.3.3 France
- 5.6.3.4 Italy
- 5.6.3.5 Rest of Europe
- 5.6.4 Asia Pacific
- 5.6.4.1 China
- 5.6.4.2 Japan
- 5.6.4.3 India
- 5.6.4.4 South Korea
- 5.6.4.5 Rest of Asia Pacific
- 5.6.5 Middle East and Africa
- 5.6.5.1 Middle East
- 5.6.5.1.1 United Arab Emirates
- 5.6.5.1.2 Saudi Arabia
- 5.6.5.1.3 Rest of Middle East
- 5.6.5.2 Africa
- 5.6.5.2.1 South Africa
- 5.6.5.2.2 Egypt
- 5.6.5.2.3 Rest of Africa
- 5.6.5.1 Middle East
- 5.6.1 North America
6 COMPETITIVE LANDSCAPE
- 6.1 Market Concentration
- 6.2 Strategic Moves
- 6.3 Market Share Analysis
- 6.4 Company Profiles (includes Global Level Overview, Market Level Overview, Core Segments, Financials as available, Strategic Information, Market Rank/Share, Products and Services, Recent Developments)
- 6.4.1 Autodesk Inc.
- 6.4.2 Bentley Systems Inc.
- 6.4.3 ESRI Inc.
- 6.4.4 Trimble Inc.
- 6.4.5 Hexagon AB
- 6.4.6 Saab AB
- 6.4.7 Airbus Defence and Space SAS
- 6.4.8 Intermap Technologies Corp.
- 6.4.9 Topcon Positioning Systems Inc.
- 6.4.10 CyberCity 3D Inc.
- 6.4.11 The Foundry Visionmongers Ltd.
- 6.4.12 Golden Software LLC
- 6.4.13 Pix4D SA
- 6.4.14 Maxon Computer GmbH
- 6.4.15 Dassault Systemes SE
- 6.4.16 Pixologic Inc.
- 6.4.17 Matterport Inc.
- 6.4.18 FARO Technologies Inc.
- 6.4.19 Leica Geosystems AG
- 6.4.20 Apple Inc.
7 MARKET OPPORTUNITIES AND FUTURE OUTLOOK
- 7.1 White-Space and Unmet-Need Assessment

 3D地圖繪製與建模市場-2026-2032年全球市場預測
 行動3D市場規模、佔有率和成長分析:按技術、應用、設備、通路和地區分類-2026-2033年產業預測
 全球3D地圖和建模市場:依產品、部署模式、組織規模、產業和地區分類-預測至2031年
 行動3D:市場佔有率分析、產業趨勢與統計、成長預測(2026-2031年)
 3D地圖建模市場 - 全球產業規模、佔有率、趨勢、機會、預測:按類型、組件、應用、產業垂直領域、地區和競爭格局分類,2021-2031年
 2026年全球行動3D市場報告2026年全球3D地圖繪製與建模市場報告
 3D地圖繪製和建模市場規模、佔有率、趨勢和預測:按組件、應用、最終用戶行業和地區分類,2026-2034年
 遊戲領域3D地圖和建模市場規模、佔有率和成長分析:按組件、技術、部署模式、平台、應用、企業規模和地區分類 - 產業預測 2026-2033
 2026-2030年全球3D地圖繪製與建模市場