


 |
市場調查報告書
商品編碼
2120329
氯氣:市佔率分析、產業趨勢與統計、成長預測(2026-2031)Chlorine - Market Share Analysis, Industry Trends & Statistics, Growth Forecasts (2026 - 2031) |
||||||

※ 本網頁內容可能與最新版本有所差異。詳細情況請與我們聯繫。
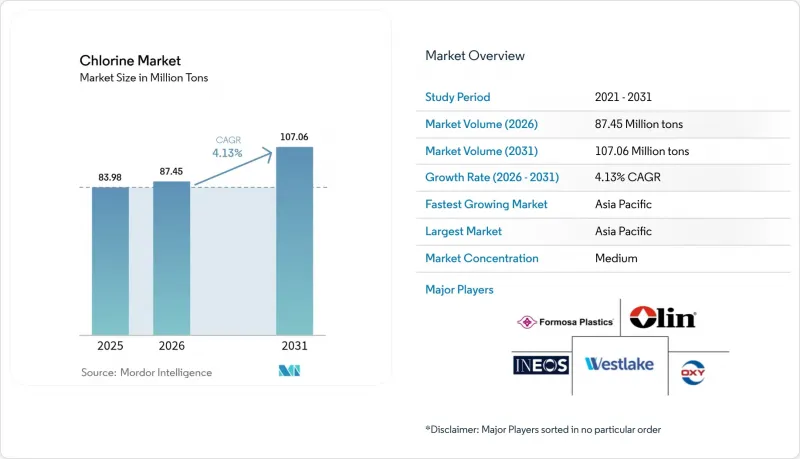
據 Mordor Intelligence 稱,2025 年氯氣市場價值為 8,398 萬噸,預計到 2031 年將達到 1.0706 億噸,而 2026 年為 8,745 萬噸,預測期(2026-2031 年)的複合年成長率為 4.13%。
本報告按應用領域(EDC/PVC、異氰酸酯和含氧化合物、氯甲烷、溶劑和環氧氯丙烷等)、終端用戶產業(水處理、製藥、化學、造紙和紙漿、塑膠、農業化學品等)以及地區(亞太、北美、歐洲、南美、中東和非洲)進行細分。市場預測以噸為單位。
全球氯氣市場趨勢及洞察
建築和包裝產業對PVC的需求激增
2025年,受中國都市化和印度10兆印度盧比(約1,200億美元)基礎建設投資的推動,PVC樹脂產量將佔全球氯氣消費量的33.42%,這兩項投資維持了對管道、型材和薄膜的高需求。目前,氯氣運轉率差異顯著,歐洲的利用率在65%至72%之間,而卡達乙烯基公司計劃到2025年每年新增35萬噸PVC產能。歐盟強制要求使用再生材料,但這種做法反而刺激了對原生PVC的需求,因為機械回收劣化聚合物鏈。氯氣市場內的一體化乙烯基生產鏈可以透過內部重新分配氯氣來緩解價格波動,這是專業氯氣貿易公司所不具備的優勢。
快速投資市政和工業污水處理
2019年,美國產氯在都市區的消毒消耗量達到10.39億公斤。此外,印度「飲用水生命線計畫」(Jal Jeevan Mission)已於2025年1月前為1.463億印度家庭提供自來水,預計這一趨勢將推動該地區氯市場需求出現高於平均水平的成長。歐盟飲用水指令2020/2184要求供水事業在2026年前提高氯酸鹽基準值,推動了氯基次氯酸發生器的持續應用。電氯化法正被引入紙漿、紡織和石化廠的工業污水處理中,進一步將氯納入監管合規的藍圖中。
苛性鈉供應過剩給合併後公司的利潤率帶來了壓力。
全球產能擴張預計將使苛性鈉價格在2024年降至多年來的最低水平,迫使一些歐洲經銷商甚至需要付費才能獲得氯氣。這造成了氯氣市場前所未有的扭曲。奧林公司氯鹼業務的營收從2023年第三季的6.328億美元下降到一年後的5.728億美元,凸顯了利潤率面臨的壓力。法國和德國工廠的關閉表明,當能源價格超過每兆瓦時150歐元時,一體化運營的獲利能力崩壞,而中東地區的工廠(當地電力成本為每兆瓦時20-30美元)仍然盈利。
細分市場分析
預計到2025年,EDC和PVC將佔全球氯需求的33.42%,證實了乙烯基材料的整合正在穩定氯市場規模,使其免受特定產品波動的影響。同時,PT Chandra Asri在印尼建設的年產110萬噸EDC工廠等投資項目,旨在解決東南亞PVC供不應求。受隔熱材料和汽車輕量化發泡體需求的推動,異氰酸酯和含氧化合物的氯市場佔有率預計將成長最快。雖然將光氣反應器改造為連續流製程可以提高安全性並降低每噸MDI的氯消耗量,但擴大初級生產規模仍然是實現絕對成長的首選方法。
氯甲烷的二次應用包括溶劑、環氧氯丙烷和無機試劑。儘管由於監管政策的變化(包括《基加利修正案》),一些冷媒生產途徑正在逐步淘汰,但中國和印度的二氧化鈦和氯化鐵生產仍在不斷多元化,並推動氯氣市場的發展。目前,膜電解槽的能耗強度平均為2000-2200千瓦時/噸,氧去極化陰極的初步試驗預計可將其降低20-30%,從而在無需新增鹽水供應的情況下釋放產能。
區域分析
亞太地區主導氯氣市場,預計到2025年將佔全球產量的64.17%,並預計到2031年將以4.76%的複合年成長率成長。這主要得益於中國4,216萬噸的苛性鈉產量以及膜電解槽的近乎全面應用。印度耗資7016.3兆印度盧比(約84億美元)的水資源計畫推動了市政氯氣需求的持續成長。同時,台灣和韓國正在興建的42家先進半導體工廠也促使部分氯氣需求轉向純度為5N及以上的等級。
在北美,儘管苛性鈉價格低迷,墨西哥灣沿岸地區的綜合性化工企業仍保持競爭力,這得益於頁岩氣支撐的電力供應。由Orin和三井物產組成的「藍水聯盟」已成為資產整合的典範,實現了氯氣市場供應與區域苛性鈉需求的平衡。在歐洲,電力成本已接近三位數,企業正在進行產能合理化調整。陶氏化學和阿科瑪計劃在2024年至2027年間總合減產超過40萬噸。 2026年生效的碳邊境調節機制(CBAM)關稅或許能夠緩解進口壓力,但長期成本平衡仍存在不確定性。
巴西、沙烏地阿拉伯和南非支撐著規模較小但具有重要戰略意義的氯氣市場。卡達乙烯基公司年產35萬噸聚氯乙烯(PVC)的工廠採用燃氣發電,電價為每兆瓦時20-30美元,這使得海灣地區的出口商在向非洲和南亞出口產品時,運輸成本更具優勢。在南非,計劃性停電導致國內電價波動,為從中東進口創造了機會。
其他好處:
- Excel格式的市場預測(ME)表
- 3個月的分析師支持
目錄
第1章:引言
- 研究假設和市場定義
- 調查範圍
第2章:調查方法
第3章執行摘要
第4章 市場狀況
- 市場概覽
- 市場促進因素
- 建築和包裝產業對PVC的需求激增
- 地方和工業部門對廢水處理的快速投資
- 學名藥的繁榮(專利到期後)
- 用於電動車全固態電池的電池級金屬氯化物
- 5奈米以下晶圓廠對半導體蝕刻解決方案的需求
- 市場限制因素
- 苛性鈉供應過剩給一體化生產商的利潤率帶來了壓力。
- 冷卻塔中溴化殺菌劑的替代品
- 現場電氯發生器正在抑制氯氣(Cl2)的大規模運輸。
- 價值鏈分析
- 技術趨勢概述
- 波特五力模型
- 價格分析
- 進出口趨勢
第5章 市場規模與成長預測
- 透過使用
- EDC/PVC
- 異氰酸酯和含氧化合物
- 氯甲烷
- 溶劑和環氧氯丙烷
- 無機化學品
- 其他用途
- 按最終用戶行業分類
- 水處理
- 製藥
- 化學品
- 紙漿和紙漿
- 塑膠
- 殺蟲劑
- 其他終端用戶產業
- 按地區
- 亞太地區
- 中國
- 印度
- 日本
- 韓國
- 東南亞國協
- 其他亞太國家
- 北美洲
- 美國
- 加拿大
- 墨西哥
- 歐洲
- 德國
- 英國
- 義大利
- 法國
- 西班牙
- 北歐國家
- 土耳其
- 俄羅斯
- 其他歐洲國家
- 南美洲
- 巴西
- 阿根廷
- 其他南美國家
- 中東和非洲
- 沙烏地阿拉伯
- 南非
- 其他中東和非洲國家
- 亞太地區
第6章 競爭情勢
- 市場集中度
- 策略趨勢
- 市佔率和排名分析
- 公司簡介
- Anwil(Orlen)
- Arkema
- Covestro AG
- DOW
- Ercros SA
- Formosa Plastics Group
- Hanwha Solutions
- INEOS
- Kem One
- Kuhlmann Europe
- Nobian
- Occidental Petroleum Corporation
- Olin Corporation
- Shivtek Spechemi Industries Ltd
- Spolchemie(KAPRAIN as)
- Tata Chemicals Limited
- Tosoh Corporation
- Vencorex
- Vynova Group(ICIG HOLDING SE)
- Westlake Corporation
第7章 市場機會與未來展望
According to Mordor Intelligence, the chlorine market size was valued at 83.98 Million tons in 2025 and is estimated to grow from 87.45 Million tons in 2026 to reach 107.06 Million tons by 2031, at a CAGR of 4.13% during the forecast period (2026-2031).
This report is Segmented by Application (EDC/PVC, Isocyanates and Oxygenates, Chloromethanes, Solvents and Epichlorohydrin, and More), End-User Industry (Water Treatment, Pharmaceutical, Chemicals, Paper and Pulp, Plastic, Pesticides, and More), and Geography (Asia-Pacific, North America, Europe, South America, and the Middle East and Africa). The Market Forecasts are Provided in Terms of Volume (tons).
Global Chlorine Market Trends and Insights
Surging PVC Demand in Construction and Packaging
PVC resin manufacture absorbed 33.42% of global chlorine in 2025 as China's urbanization push and India's infrastructure outlays of INR 10 trillion (USD 120 billion) kept pipe, profile, and film demand elevated. Operating-rate gaps remain wide, with Europe languishing at 65-72% and Qatar Vinyl Company adding 350,000 t pa of PVC in 2025. Recycled-content mandates in the European Union are paradoxically lifting virgin PVC offtake wherever mechanical recycling degrades polymer chains. Integrated vinyl chains inside the chlorine market soften price volatility because captive chlorine can be rebalanced internally, an edge pure-play merchants lack.
Rapid Municipal and Industrial Wastewater Investments
Municipal disinfection consumed 1,039 million kg of US chlorine in 2019, and the Jal Jeevan Mission has already extended tap water to 146.3 million Indian households by January 2025, a trajectory expected to raise regional chlorine market demand at above-average rates. Europe's Drinking Water Directive 2020/2184 forces utilities to tighten chlorate limits by 2026, favoring on-site hypochlorite generators that still require chlorine feedstock. Industrial wastewater treatment for pulp, textile, and petrochemical plants is adopting electro-chlorination, further embedding chlorine into compliance roadmaps.
Caustic-Soda Over-Supply Squeezing Integrated Margins
Worldwide expansions pushed caustic-soda prices to multi-year lows in 2024, forcing some European sellers to actually pay buyers to take chlorine away, an unprecedented distortion in the chlorine market. Olin's chlor-alkali revenue fell from USD 632.8 million in Q3 2023 to USD 572.8 million a year later, confirming margin compression. Plant closures in France and Germany illustrate how energy prices above EUR 150 MWh destroy integrated economics, whereas Middle Eastern units with USD 20-30 MWh power remain profitable.
Other drivers and restraints analyzed in the detailed report include:
- Pharmaceutical Generics Boom (Post-Patent Expiries)
- Battery-Grade Metal Chlorides for Solid-State EV Cells
- On-Site Electro-Chlorination Units Curbing Bulk Cl2 Haulage
For complete list of drivers and restraints, kindly check the Table Of Contents.
Segment Analysis
EDC and PVC absorbed 33.42% of the worldwide chlorine in 2025, confirming that vinyl integration stabilizes the chlorine market size against co-product swings. Parallel investments such as PT Chandra Asri's 1.1 million-t pa EDC unit in Indonesia are aimed at meeting Southeast Asian PVC shortfalls. The chlorine market share for isocyanates and oxygenates is poised to expand fastest, lifted by insulation and auto lightweighting foam needs. Phosgene reactors converted to continuous flow raise safety while shaving chlorine consumption per ton of MDI, yet absolute growth still favors higher basal volumes.
Secondary uses span chloromethanes, solvents, epichlorohydrin, and inorganic reagents. Regulatory moves, including the Kigali Amendment, are phasing down some refrigerant pathways, but titanium dioxide and ferric chloride output in China and India keeps diversified, drawing on the chlorine market. Membrane-cell energy intensity now averages 2,000-2,200 kWh/t, and oxygen-depolarized cathode pilots promise another 20-30% gain, potentially freeing capacity without new brine feeds.
Complete Report Scope:
- By Application
- EDC/PVC
- Isocyanates and Oxygenates
- Chloromethanes
- Solvents and Epichlorohydrin
- Inorganic Chemicals
- Other Applications
- By End-user Industry
- Water Treatment
- Pharmaceutical
- Chemicals
- Paper and Pulp
- Plastic
- Pesticides
- Other End-user Industries
- By Geography
- Asia-Pacific
- China
- India
- Japan
- South Korea
- ASEAN Countries
- Rest of Asia-Pacific
- North America
- United States
- Canada
- Mexico
- Europe
- Germany
- United Kingdom
- Italy
- France
- Spain
- NORDIC Countries
- Turkey
- Russia
- Rest of Europe
- South America
- Brazil
- Argentina
- Rest of South America
- Middle-East and Africa
- Saudi Arabia
- South Africa
- Rest of Middle-East and Africa
- Asia-Pacific
Geography Analysis
Asia-Pacific dominates the chlorine market, holding 64.17% of global volume in 2025 and set for a 4.76% CAGR through 2031, underpinned by China's 42.16 million-ton caustic-soda output and near-complete membrane-cell penetration. India's INR 70,163 crore (USD 8.4 billion) water program keeps municipal demand rising, while 42 leading-edge semiconductor fabs under construction in Taiwan and South Korea are shifting a slice of chlorine toward 5N-plus purity categories.
North America's shale-linked power advantage keeps integrated Gulf Coast complexes competitive even as caustic prices sag. Olin and Mitsui's Blue Water Alliance is a template for asset pooling that balances chlorine market volumes with regional caustic draw. Europe, facing triple-digit electricity costs, continues to rationalize, with Dow and Arkema trimming combined capacity by over 400,000 t between 2024 and 2027. Carbon Border Adjustment Mechanism tariffs, effective in 2026, could moderate import pressure, but long-term cost parity remains uncertain.
Brazil, Saudi Arabia, and South Africa anchor smaller but strategically relevant chlorine markets. Qatar Vinyl Company's 350,000 t pa PVC unit leverages USD 20-30 MWh gas-based power, giving Gulf exporters a freight-parity edge into Africa and South Asia. South Africa's load-shedding keeps domestic rates volatile, opening windows for imports from the Middle East.
- Anwil (Orlen)
- Arkema
- Covestro AG
- DOW
- Ercros S.A
- Formosa Plastics Group
- Hanwha Solutions
- INEOS
- Kem One
- Kuhlmann Europe
- Nobian
- Occidental Petroleum Corporation
- Olin Corporation
- Shivtek Spechemi Industries Ltd
- Spolchemie (KAPRAIN a.s.)
- Tata Chemicals Limited
- Tosoh Corporation
- Vencorex
- Vynova Group (ICIG HOLDING SE)
- Westlake Corporation
Additional Benefits:
- The market estimate (ME) sheet in Excel format
- 3 months of analyst support
TABLE OF CONTENTS
1 Introduction
- 1.1 Study Assumptions and Market Definition
- 1.2 Scope of the Study
2 Research Methodology
3 Executive Summary
4 Market Landscape
- 4.1 Market Overview
- 4.2 Market Drivers
- 4.2.1 Surging PVC demand in construction and packaging
- 4.2.2 Rapid municipal and industrial wastewater investments
- 4.2.3 Pharmaceutical generics boom (post-patent expiries)
- 4.2.4 Battery-grade metal chlorides for solid-state EV cells
- 4.2.5 Semiconductor etchant demand from sub-5 nm fabs
- 4.3 Market Restraints
- 4.3.1 Caustic-soda over-supply squeezing integrated margins
- 4.3.2 Bromine-based biocide substitution in cooling towers
- 4.3.3 On-site electro-chlorination units curbing bulk Cl2 haulage
- 4.4 Value Chain Analysis
- 4.5 Technological Snapshot
- 4.6 Porter's Five Forces
- 4.6.1 Bargaining Power of Suppliers
- 4.6.2 Bargaining Power of Consumers
- 4.6.3 Threat of New Entrants
- 4.6.4 Threat of Substitute Products and Services
- 4.6.5 Degree of Competition
- 4.7 Pricing Analysis
- 4.8 Import and Export Trends
5 Market Size and Growth Forecasts (Volume)
- 5.1 By Application
- 5.1.1 EDC/PVC
- 5.1.2 Isocyanates and Oxygenates
- 5.1.3 Chloromethanes
- 5.1.4 Solvents and Epichlorohydrin
- 5.1.5 Inorganic Chemicals
- 5.1.6 Other Applications
- 5.2 By End-user Industry
- 5.2.1 Water Treatment
- 5.2.2 Pharmaceutical
- 5.2.3 Chemicals
- 5.2.4 Paper and Pulp
- 5.2.5 Plastic
- 5.2.6 Pesticides
- 5.2.7 Other End-user Industries
- 5.3 By Geography
- 5.3.1 Asia-Pacific
- 5.3.1.1 China
- 5.3.1.2 India
- 5.3.1.3 Japan
- 5.3.1.4 South Korea
- 5.3.1.5 ASEAN Countries
- 5.3.1.6 Rest of Asia-Pacific
- 5.3.2 North America
- 5.3.2.1 United States
- 5.3.2.2 Canada
- 5.3.2.3 Mexico
- 5.3.3 Europe
- 5.3.3.1 Germany
- 5.3.3.2 United Kingdom
- 5.3.3.3 Italy
- 5.3.3.4 France
- 5.3.3.5 Spain
- 5.3.3.6 NORDIC Countries
- 5.3.3.7 Turkey
- 5.3.3.8 Russia
- 5.3.3.9 Rest of Europe
- 5.3.4 South America
- 5.3.4.1 Brazil
- 5.3.4.2 Argentina
- 5.3.4.3 Rest of South America
- 5.3.5 Middle-East and Africa
- 5.3.5.1 Saudi Arabia
- 5.3.5.2 South Africa
- 5.3.5.3 Rest of Middle-East and Africa
- 5.3.1 Asia-Pacific
6 Competitive Landscape
- 6.1 Market Concentration
- 6.2 Strategic Moves
- 6.3 Market Share(%)/Ranking Analysis
- 6.4 Company Profiles (includes Global Overview, Market Overview, Core Segments, Financials, Strategic Information, Products and Services, Recent Developments)
- 6.4.1 Anwil (Orlen)
- 6.4.2 Arkema
- 6.4.3 Covestro AG
- 6.4.4 DOW
- 6.4.5 Ercros S.A
- 6.4.6 Formosa Plastics Group
- 6.4.7 Hanwha Solutions
- 6.4.8 INEOS
- 6.4.9 Kem One
- 6.4.10 Kuhlmann Europe
- 6.4.11 Nobian
- 6.4.12 Occidental Petroleum Corporation
- 6.4.13 Olin Corporation
- 6.4.14 Shivtek Spechemi Industries Ltd
- 6.4.15 Spolchemie (KAPRAIN a.s.)
- 6.4.16 Tata Chemicals Limited
- 6.4.17 Tosoh Corporation
- 6.4.18 Vencorex
- 6.4.19 Vynova Group (ICIG HOLDING SE)
- 6.4.20 Westlake Corporation
7 Market Opportunities and Future Outlook
- 7.1 White-space and Unmet-need Assessment

 印度氯氣市場:市場佔有率分析、產業趨勢與統計、成長預測(2026-2031)
 氯氣市場:依生產技術、形態、純度等級、應用、終端用戶產業及通路分類-2026-2032年全球市場預測
 氯氣市場預測至2034年—按類型、最終用戶和地區分類的全球分析
 氯氣市場規模、佔有率和趨勢分析報告:按形態、應用、地區和細分市場預測(2026-2033 年)
 氯氣市場:依形態、包裝、應用及地區分類二氧化氯發生器市場:按類型、最終用戶、方法、技術、容量和應用分類-2026-2032年全球市場預測
 次氯酸鈉產生器市場規模、佔有率和成長分析:按產品類型、產能、應用、技術、最終用戶、分銷管道和地區分類 - 2026-2033 年行業預測
 2026-2034年全球氯氣市場規模、佔有率、趨勢和成長分析報告
 2025-2029年全球氯氣市場
 二氧化氯發生器市場-全球產業規模、佔有率、趨勢、機會、預測:按類型、應用、地區和競爭格局分類,2021-2031年