


 |
市場調查報告書
商品編碼
2120316
虛擬實境(VR):市場佔有率分析、產業趨勢與統計數據、成長預測(2026-2031)Virtual Reality (VR) - Market Share Analysis, Industry Trends & Statistics, Growth Forecasts (2026 - 2031) |
||||||

※ 本網頁內容可能與最新版本有所差異。詳細情況請與我們聯繫。
根據 Mordor Intelligence 預測,虛擬實境市場規模預計將在 2025 年達到 129.2 億美元,2026 年達到 156.4 億美元,到 2031 年達到 407.1 億美元,2026 年至 2031 年的複合年成長率為 21.08%。
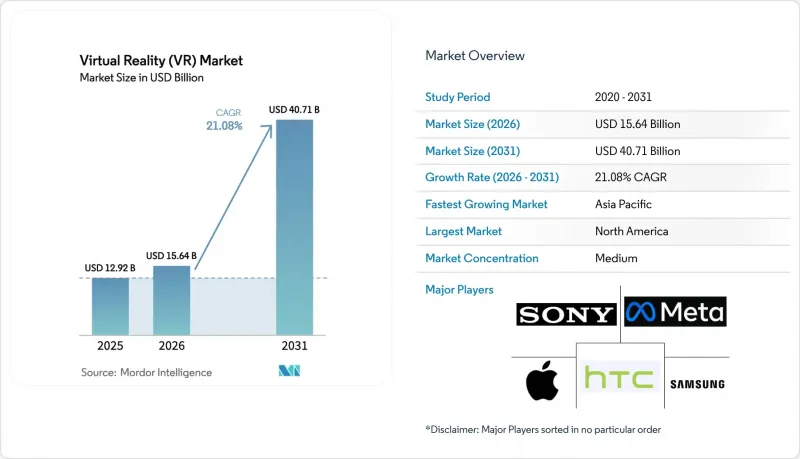
本報告按交付方式(硬體、軟體、服務)、裝置外形規格(有線頭戴式顯示器、獨立式頭戴式顯示器等)、沉浸程度(非身臨其境型、半身臨其境型、完全身臨其境型)、終端用戶產業(遊戲、媒體和娛樂等)以及地區(北美、南美等)進行細分。市場預測以美元計價。
全球虛擬實境(VR)市場趨勢與洞察
在全公司範圍內推廣VR培訓的應用
由於基於模擬的培訓能夠縮短學習曲線並降低因操作失誤而承擔的法律責任,企業正將更多預算投入身臨其境型內容中。航空、能源和緊急應變等行業的跨國公司目前正在營運中部署虛擬實境(VR)模組,因為任何一個失誤都可能導致人員傷亡或重大經濟損失。諸如ISO 9001等國際品質標準正日益認可VR錄製的功能與真實演示具有同等效力,從而簡化了合規性審核流程。然而,熟練的3D開發人員短缺意味著許多組織需要6到12個月的前置作業時間才能創建客製化模組。儘管VR內容具有強大的商業價值,但這些內容開發瓶頸卻減緩了其發展速度。
混合實境(MR)相容於GPU和SoC的普及
晶片製造商已將專用VR處理模組整合到其旗艦處理器中,從而消除了身臨其境型設備曾經的高昂價格。蘋果的M5晶片具備硬體加速的中央凹渲染功能,可在輕巧的頭顯中提供桌面級影像品質。高通驍龍XR2 Gen 2平台如今已驅動售價低於500美元的獨立設備,讓學校和小型企業也能負擔得起身臨其境型硬體。部署成本的降低使購買不再受長期IT設備更換週期的限制,頭顯也因此轉變為消耗性周邊設備。溫度控管仍然是一個主要問題。長時間使用仍會導致眼罩周圍積聚熱量,限制了持續使用。因此,在散熱和鏡頭通風方面持續進行技術研發對於更廣泛的職場應用至關重要。
網路暈動症與長期前庭系統問題
視覺和前庭感覺的不匹配會導致25%至40%的初次使用者出現噁心、眩暈和眼疲勞,即使是經驗豐富的使用者中,也有15%的人表示在超過30分鐘的使用過程中會感到不適。企業必須為對虛擬實境技術敏感的員工準備其他替代方案,這降低了投資報酬率。硬體在刷新率和延遲方面的改進已經達到極限,進一步提升性能需要運動預測演算法和藥物輔助,而這些目前尚不具備商業性實用化。由於缺乏縱向研究,長期前庭健康的法律責任問題依然存在。這些因素共同阻礙了積極的推廣計劃,尤其是在醫療保健和教育領域。
區域分析
北美地區擁有由晶片組設計公司、頭戴式設備製造商和專業內容創作工作室組成的密集生態系統,預計到2025年將佔全球收入的37.36%。財富500強製造商、醫療系統公司和國防相關企業在2024年至2025年間從試點階段過渡到全面部署,並將虛擬實境(VR)指標整合到其關鍵績效指標中。美國食品藥物管理局(FDA)批准的治療應用以及美國國防部對身臨其境型訓練基礎設施的投資,都支持了機構的需求。隨著早期用戶的採用率趨於飽和,成長速度正在放緩,市場重心正轉向需要更簡化、更低成本部署的中小型企業。
預計亞太地區2026年至2031年的複合年成長率將達23.49%,為全球最高增速。中國、日本、韓國和印度正利用虛擬實境技術解決先進製造業技術純熟勞工的問題,部署數千台頭戴式設備用於組裝培訓。在韓國,5G的廣泛應用透過邊緣伺服器傳輸工作負載,降低了頭戴式設備的成本。在日本,人口老化推動了老年復健領域的虛擬實境技術應用,並得益於厚生勞動省的補貼。在印度,政府技能發展津貼價格適中的中國硬體相結合,正在擴大電子和汽車產業叢集的培訓規模。在澳洲和紐西蘭,礦業和能源公司看到了虛擬實境技術在遠端安全培訓方面的價值,其利基需求也推動了虛擬實境技術的成長。
歐洲、南美、中東和非洲的VR技術普及速度各不相同。在歐洲,GDPR對生物識別資料的嚴格監管增加了眼動追蹤分析的合規負擔,但德國和法國的汽車和航太產業的領導企業仍在積極推動在受控設施內部署該技術。在南美,VR技術的應用主要集中在巴西和阿根廷的都市區,這些地區的寬頻網路完善,能夠支援教育VR實驗室和零售展示室的運作。阿拉伯聯合大公國和沙烏地阿拉伯正在大力投資VR旅遊體驗,以配合其國家經濟多元化計畫。非洲市場仍處於起步階段,目前主要集中在由捐助者資助的遠距遠端醫療試點計畫上,旨在解決醫院資源短缺問題。由於基礎設施品質和監管清晰度對VR技術的普及速度的影響遠大於單純的興趣,預計到2031年,各地區的成長曲線將出現顯著差異。
其他好處:
- Excel格式的市場預測(ME)表
- 3個月的分析師支持
目錄
第1章:引言
- 研究假設和市場定義
- 調查範圍
第2章:調查方法
第3章執行摘要
第4章 市場狀況
- 市場概覽
- 市場促進因素
- 在全公司範圍內推廣VR培訓的應用
- 混合實境(MR)相容於GPU和SoC的普及
- 利用 5G 和邊緣運算的無線 VR 串流播放
- 企業淨零排放承諾正在推動「虛擬優先」活動的趨勢。
- 基於虛擬實境技術的心理健康療法已獲得監管部門批准。
- 利用超音波和觸覺進行無控制器互動。
- 市場限制因素
- 網路暈動症和對長期前庭功能的擔憂
- 由於 iBox 過熱,連續使用受到限制。
- 遊戲領域以外缺乏AAA級VR內容
- 眼動追蹤分析中資料隱私合規的成本
- 產業價值鏈分析
- 監理情勢
- 技術展望
- 波特五力分析
- 宏觀經濟因素對市場的影響
第5章 市場規模與成長預測
- 報價
- 硬體
- 軟體
- 服務
- 按設備外形規格
- 有線頭戴式顯示器
- 獨立式頭戴式顯示器
- 無螢幕檢視器
- 洞穴/身臨其境型房間
- 沉浸程度
- 非身臨其境型
- 半沉浸式
- 完全身臨其境型
- 按最終用戶行業分類
- 遊戲
- 媒體與娛樂
- 衛生保健
- 教育和培訓
- 軍事/國防
- 零售與電子商務
- 房地產與建築
- 按地區
- 北美洲
- 美國
- 加拿大
- 墨西哥
- 南美洲
- 巴西
- 阿根廷
- 其他南美國家
- 歐洲
- 德國
- 英國
- 法國
- 義大利
- 西班牙
- 俄羅斯
- 其他歐洲國家
- 亞太地區
- 中國
- 日本
- 韓國
- 印度
- 澳洲
- 紐西蘭
- 其他亞太國家
- 中東
- 阿拉伯聯合大公國
- 沙烏地阿拉伯
- 土耳其
- 其他中東國家
- 非洲
- 南非
- 奈及利亞
- 肯亞
- 其他非洲國家
- 北美洲
第6章 競爭情勢
- 市場集中度
- 策略趨勢
- 市佔率分析
- 公司簡介
- Meta Platforms(Meta Quest)
- Sony Corporation
- HTC Corporation
- Samsung Electronics Co. Ltd
- Apple Inc.
- Qualcomm Technologies Inc.
- Lenovo Group Ltd
- Pico Interactive Inc.
- Valve Corporation
- Varjo Technologies Oy
- Microsoft Corporation
- Magic Leap Inc.
- Vuzix Corporation
- FOVE Inc.
- DPVR(Lexiang Tech Co. Ltd)
- Unity Technologies Inc.
- Unreal Engine(Epic Games Inc.)
- Autodesk Inc.
- Dassault Systemes SE
- 3D Systems Corporation
第7章 市場機會與未來展望
According to Mordor Intelligence, the virtual reality market size is projected to be USD 12.92 billion in 2025, USD 15.64 billion in 2026, and reach USD 40.71 billion by 2031, growing at a CAGR of 21.08% from 2026 to 2031.
This report is Segmented by Offering (Hardware, Software, and Services), Device Form Factor (Tethered HMD, Stand-Alone HMD, and More), Immersion Level (Non-Immersive, Semi-Immersive, and Fully-Immersive), End-User Industry (Gaming, Media and Entertainment, and More), and Geography (North America, South America, and More). The Market Forecasts are Provided in Terms of Value (USD).
Global Virtual Reality (VR) Market Trends and Insights
Rising Enterprise-Wide VR Training Adoption
Simulation-based training compresses learning curves and reduces liability from on-the-job errors, motivating corporations to allocate larger budgets to immersive content. Multinationals in aviation, energy, and emergency response now deploy VR modules for tasks where a single mistake carries high human or financial cost. International quality standards such as ISO 9001 increasingly accept VR-documented competency as equivalent to physical demonstrations, streamlining compliance audits. However, many organizations still face a six-to-twelve-month lead time to create bespoke modules because skilled 3D developers remain in short supply. These content bottlenecks moderate the growth curve even as the business case strengthens.
Mainstreaming of Mixed-Reality-Ready GPUs and SoCs
Chipmakers have embedded dedicated VR processing blocks into their flagship processors, removing the price premium once associated with immersive-capable devices. Apple's M5 chip features hardware-accelerated foveated rendering, delivering desktop-class visuals in a lightweight headset. Qualcomm's Snapdragon XR2 Gen 2 platform now powers stand-alone units priced below USD 500, placing immersive hardware within reach of schools and small businesses. Lower entry costs decouple purchases from long IT refresh cycles, turning headsets into consumable peripherals. The main concern is thermal management; extended sessions still trigger eye-box heat buildup, which limits continuous use. Continuous engineering on heat dissipation and lens ventilation is therefore essential for broader workplace adoption.
Cybersickness and Long-Term Vestibular Concerns
Visual-vestibular mismatch triggers nausea, dizziness, and eye strain in 25-40% of first-time users, with 15% of acclimated users still reporting discomfort during sessions longer than 30 minutes. Enterprises must maintain parallel non-VR pathways for sensitive employees, diluting return on investment. Hardware improvements in refresh rate and latency have reached diminishing returns, so further gains require motion-prediction algorithms or pharmacological aids not yet commercially viable. Liability questions about long-term vestibular health persist due to limited longitudinal research. These factors combine to temper aggressive rollout plans, especially in healthcare and education environments.
Other drivers and restraints analyzed in the detailed report include:
- 5G and Edge-Powered Untethered VR Streaming
- Regulatory Approvals for VR-Based Mental-Health Therapies
- Data-Privacy Compliance Costs for Eye-Tracking Analytics
For complete list of drivers and restraints, kindly check the Table Of Contents.
Geography Analysis
North America generated 37.36% of the 2025 revenue, supported by a dense ecosystem comprising chipset designers, headset manufacturers, and specialized content studios. Fortune 500 manufacturers, healthcare systems, and defense contractors transitioned from pilots to full-scale rollouts in 2024-2025, integrating VR metrics into key performance dashboards. FDA approvals of therapeutic applications and the U.S. Department of Defense's investment in immersive training infrastructure sustain institutional demand. Growth moderates as early adopters saturate, shifting focus to small and mid-sized businesses that require simplified deployment and lower pricing.
The Asia Pacific is on course to register a 23.49% CAGR from 2026 to 2031, the fastest growth rate worldwide. China, Japan, South Korea, and India are leveraging VR to bridge skilled labor shortages in advanced manufacturing, deploying thousands of headsets for assembly-line instruction. South Korea's ubiquitous 5G reduces headset costs by streaming workloads from edge servers. Japan's aging population drives the uptake of elder-care rehabilitation, aided by subsidies from the Ministry of Health. India combines government skill-development grants with affordable Chinese hardware to scale training in electronics and automotive clusters. Australia and New Zealand contribute niche demand from mining and energy firms that value VR for remote-site safety drills.
Europe, South America, the Middle East, and Africa display heterogeneous trajectories. Europe wrestles with strict GDPR rules on biometric data that add compliance overhead for eye-tracking analytics, yet automotive and aerospace leaders in Germany and France still push adoption within controlled facilities. South American uptake concentrates in Brazilian and Argentine urban centers where broadband coverage supports VR labs for education and retail showrooms. The United Arab Emirates and Saudi Arabia invest heavily in VR tourism experiences linked to national economic diversification plans. African markets remain nascent, focusing on donor-funded telemedicine pilots that circumvent hospital shortages. Infrastructure quality and regulatory clarity dictate pace more than inherent interest, ensuring regional growth curves diverge widely through 2031.
- Meta Platforms (Meta Quest)
- Sony Corporation
- HTC Corporation
- Samsung Electronics Co. Ltd
- Apple Inc.
- Qualcomm Technologies Inc.
- Lenovo Group Ltd
- Pico Interactive Inc.
- Valve Corporation
- Varjo Technologies Oy
- Microsoft Corporation
- Magic Leap Inc.
- Vuzix Corporation
- FOVE Inc.
- DPVR (Lexiang Tech Co. Ltd)
- Unity Technologies Inc.
- Unreal Engine (Epic Games Inc.)
- Autodesk Inc.
- Dassault Systemes SE
- 3D Systems Corporation
Additional Benefits:
- The market estimate (ME) sheet in Excel format
- 3 months of analyst support
TABLE OF CONTENTS
1 INTRODUCTION
- 1.1 Study Assumptions and Market Definition
- 1.2 Scope of the Study
2 RESEARCH METHODOLOGY
3 EXECUTIVE SUMMARY
4 MARKET LANDSCAPE
- 4.1 Market Overview
- 4.2 Market Drivers
- 4.2.1 Rising Enterprise-Wide VR Training Adoption
- 4.2.2 Mainstreaming of Mixed Reality-Ready GPUs and SoCs
- 4.2.3 5G and Edge-Powered Untethered VR Streaming
- 4.2.4 Corporate Net-Zero Pledges Driving Virtual-First Events
- 4.2.5 Regulatory Approvals for VR-Based Mental-Health Therapies
- 4.2.6 Ultrasound-Haptics Enabling Controller-Free Interaction
- 4.3 Market Restraints
- 4.3.1 Cybersickness and Long-Term Vestibular Concerns
- 4.3.2 Eye-Box Heat Build-Up Limiting Continuous Usage
- 4.3.3 Scarcity of AAA-Grade VR Content Outside Gaming
- 4.3.4 Data-Privacy Compliance Costs for Eye-Tracking Analytics
- 4.4 Industry Value Chain Analysis
- 4.5 Regulatory Landscape
- 4.6 Technological Outlook
- 4.7 Porter's Five Forces Analysis
- 4.7.1 Bargaining Power of Suppliers
- 4.7.2 Bargaining Power of Buyers
- 4.7.3 Threat of New Entrants
- 4.7.4 Threat of Substitutes
- 4.7.5 Intensity of Competitive Rivalry
- 4.8 Impact of Macroeconomic Factors on the Market
5 MARKET SIZE AND GROWTH FORECASTS (VALUE)
- 5.1 By Offering
- 5.1.1 Hardware
- 5.1.2 Software
- 5.1.3 Services
- 5.2 By Device Form Factor
- 5.2.1 Tethered HMD
- 5.2.2 Stand-Alone HMD
- 5.2.3 Screenless Viewer
- 5.2.4 CAVE / Immersive Rooms
- 5.3 By Immersion Level
- 5.3.1 Non-Immersive
- 5.3.2 Semi-Immersive
- 5.3.3 Fully-Immersive
- 5.4 By End-User Industry
- 5.4.1 Gaming
- 5.4.2 Media and Entertainment
- 5.4.3 Healthcare
- 5.4.4 Education and Training
- 5.4.5 Military and Defense
- 5.4.6 Retail and eCommerce
- 5.4.7 Real Estate and Architecture
- 5.5 By Geography
- 5.5.1 North America
- 5.5.1.1 United States
- 5.5.1.2 Canada
- 5.5.1.3 Mexico
- 5.5.2 South America
- 5.5.2.1 Brazil
- 5.5.2.2 Argentina
- 5.5.2.3 Rest of South America
- 5.5.3 Europe
- 5.5.3.1 Germany
- 5.5.3.2 United Kingdom
- 5.5.3.3 France
- 5.5.3.4 Italy
- 5.5.3.5 Spain
- 5.5.3.6 Russia
- 5.5.3.7 Rest of Europe
- 5.5.4 Asia Pacific
- 5.5.4.1 China
- 5.5.4.2 Japan
- 5.5.4.3 South Korea
- 5.5.4.4 India
- 5.5.4.5 Australia
- 5.5.4.6 New Zealand
- 5.5.4.7 Rest of Asia Pacific
- 5.5.5 Middle East
- 5.5.5.1 United Arab Emirates
- 5.5.5.2 Saudi Arabia
- 5.5.5.3 Turkey
- 5.5.5.4 Rest of Middle East
- 5.5.6 Africa
- 5.5.6.1 South Africa
- 5.5.6.2 Nigeria
- 5.5.6.3 Kenya
- 5.5.6.4 Rest of Africa
- 5.5.1 North America
6 COMPETITIVE LANDSCAPE
- 6.1 Market Concentration
- 6.2 Strategic Moves
- 6.3 Market Share Analysis
- 6.4 Company Profiles (includes Global Level Overview, Market Level Overview, Core Segments, Financials as Available, Strategic Information, Market Rank/Share for Key Companies, Products and Services, Recent Developments)
- 6.4.1 Meta Platforms (Meta Quest)
- 6.4.2 Sony Corporation
- 6.4.3 HTC Corporation
- 6.4.4 Samsung Electronics Co. Ltd
- 6.4.5 Apple Inc.
- 6.4.6 Qualcomm Technologies Inc.
- 6.4.7 Lenovo Group Ltd
- 6.4.8 Pico Interactive Inc.
- 6.4.9 Valve Corporation
- 6.4.10 Varjo Technologies Oy
- 6.4.11 Microsoft Corporation
- 6.4.12 Magic Leap Inc.
- 6.4.13 Vuzix Corporation
- 6.4.14 FOVE Inc.
- 6.4.15 DPVR (Lexiang Tech Co. Ltd)
- 6.4.16 Unity Technologies Inc.
- 6.4.17 Unreal Engine (Epic Games Inc.)
- 6.4.18 Autodesk Inc.
- 6.4.19 Dassault Systemes SE
- 6.4.20 3D Systems Corporation
7 MARKET OPPORTUNITIES AND FUTURE OUTLOOK
- 7.1 White-Space and Unmet-Need Assessment

 教育領域的虛擬實境:市場佔有率分析、產業趨勢與統計及成長預測(2026-2031)
 虛擬實境(VR)全球市場規模、佔有率、趨勢和成長分析報告(2026-2034)
 基於太空的虛擬實境(VR)市場規模、佔有率和成長分析:按產品、應用、最終用戶和地區分類-2026-2033年產業預測
 觸覺虛擬實境市場-2026-2032年全球市場預測虛擬實境市場:依技術、組件、設備和最終用戶分類-2026-2032年全球市場預測VR/AR/MR(虛擬實境/擴增實境/混合實境):市場佔有率分析、產業趨勢和統計數據、成長預測(2026-2031)
 虛擬實境療法市場規模、佔有率及成長分析(慢性疼痛):依療法、疼痛適應症、給藥平台、最終用戶、患者年齡層及地區分類-2026-2033年產業預測
 2026年全球會議與遠距臨場系統市場報告
 元宇宙驅動的教育市場預測至2034年:按組件、部署模式、技術、組織規模、應用、最終用戶和地區分類的全球分析2026年全球遠距臨場系統視訊會議市場報告