


 |
市場調查報告書
商品編碼
2119815
黃金:市場佔有率分析、行業趨勢和統計數據、成長預測(2026-2031 年)Gold - Market Share Analysis, Industry Trends & Statistics, Growth Forecasts (2026 - 2031) |
||||||

※ 本網頁內容可能與最新版本有所差異。詳細情況請與我們聯繫。
根據 Mordor Intelligence 預測,黃金市場規模將從 2025 年的 4.75 千噸成長到 2026 年的 5.1 千噸,然後從 2026 年到 2031 年以 7.30% 的複合年成長率成長,到 2031 年達到 7.25 千噸。
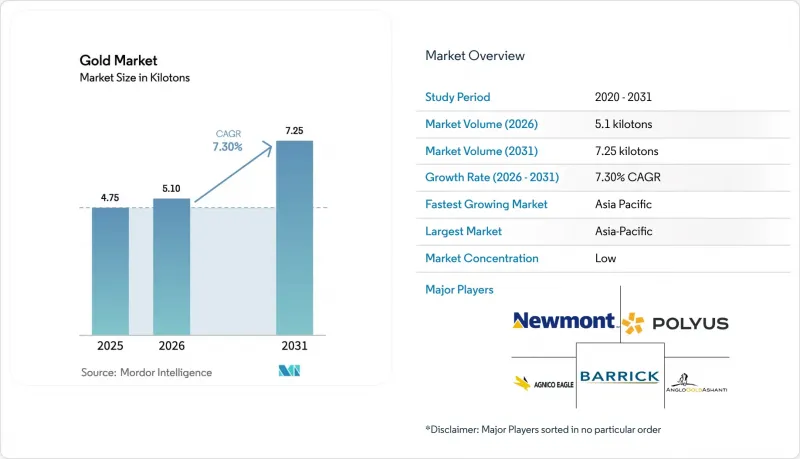
本報告按來源(原生礦開採、再生金)、類型(合金金、鍍金)、應用(珠寶、電子產品、獎品和身份象徵、其他應用(牙科、航太等))和地區(主要地區的生產和消費分析)進行細分。市場預測以噸為單位。
全球黃金市場趨勢及洞察
在通膨對沖環境下,零售和ETF投資需求激增
高企的消費價格和對貨幣政策有效性的質疑,重新確立了黃金在多元化投資組合中的地位。 2024年,印度黃金交易所交易基金(ETF)淨流入1,120億印度盧比(約13億美元),創歷史新高。同年,黃金的表現優於當地股票21個百分點,鞏固了其「避險天堂」的地位。隨著實際收益率轉為負值,美國和歐洲的投資組合經理增加了黃金的策略配置。調查數據顯示,當通膨率超過4%時,投資人對黃金的偏好也會增加。金幣和裸金屬仍然受到尋求實物對沖的個人投資者的青睞,即使現貨價格超過每盎司2300美元,需求彈性也出乎意料地低。這種投資行為的結構性轉變表明,即使宏觀經濟波動加劇,市場仍將保持強勁的購買需求。
各國央行的「去美元化」策略正加速外匯存底多元化。
過去三年,各國央行每年購買黃金的量均超過1000噸,這一歷史性的連續購買量凸顯了市場對美元未來主導地位日益成長的疑慮。世界黃金協會(WGC)2025年的一項調查顯示,95%的受訪者計劃維持或增加其黃金持有量,43%的受訪者計劃進一步增持。中國、印度和土耳其是黃金淨購買的主要來源,自2021年以來,三國淨購買量合計超過600噸。這反映了各國為規避制裁和貨幣波動風險所採取的策略性舉措。截至2024年3月,美元在全球外匯存底的佔有率已降至58.9%,為現代統計方法開始以來的最低水準。這提升了黃金作為中性價值儲存手段的吸引力。預計2024年至2025年間,公共儲備中實際使用的黃金比例將從37%增加至44%,顯示黃金產業存在長期結構性需求。
礦石品位下降導致 AISC 上漲至每盎司 1450 美元以上。
在成熟礦床中,礦石品位持續下降,迫使業者處理更多礦石以維持產量。紐蒙特公司報告稱,2025年第一季的綜合維持成本(AISC)為每盎司1,651美元,較2022年成長29%,創九年來新高。 2024年第二季度,全產業綜合維持成本(AISC)平均為每盎司1,388美元,但北美生產商的成本更高,達到每盎司1,522美元。勞動力短缺、能源價格飆升以及與現貨價格掛鉤的不斷上漲的特許權使用費條款進一步加劇了成本壓力。雖然目前創紀錄的現貨價格支撐了利潤率,但成本的持續上漲將對獲利能力礦場的生存構成壓力,並加速礦場關閉。中期來看,成本上升可能會抑制新增供應,進而支撐黃金產業。
細分市場分析
到2025年,原生礦開採將佔黃金市場佔有率的72.05%,證實了大規模露天礦和地下礦仍將是黃金供應的支柱。該領域受益於成熟的物流網路、熟練的勞動力以及長期承購契約,即使礦石品位下降,也能穩定加工量。然而,由於綜合維持成本超過每盎司1,388美元,新資本的盈利正在下降,各公司正尋求加強現有礦址周圍的探勘,並充分利用已投資的基礎設施。
儘管目前回收僅佔供應量的27.95%,但預計到2031年,其複合年成長率將達到7.98%,成為所有供應來源中成長最快的領域。英國皇家鑄幣局位於南威爾斯的工廠每年利用取得專利的濕式冶金技術處理4,000噸印刷電路基板,回收效率高達99%。回收的能源需求約為新礦開發能源需求的1/300,從而降低了碳排放強度,並符合環境、社會和管治(ESG)要求。奢侈品產業的領導者潘朵拉承諾在2025年使用100%回收貴金屬,從而推動了對廢料的需求。隨著越來越多的地區收緊電子廢棄物監管,再生原料可望成為黃金產業的戰略支柱。
區域分析
到2025年,亞太地區將佔全球黃金市場的59.85%,預計到2031年將以8.95%的複合年成長率成長。中國繼續保持其黃金生產領先地位,2024年黃金產量達403噸,中國人民銀行連續第19個月增加官方黃金儲備。隨著進口關稅的降低,消費者需求復甦,印度儲備銀行計劃在2025年7月將其黃金儲備增加至880噸。在印尼、泰國和越南,珠寶銷量實現了兩位數成長,反映出可支配收入的增加以及消費者對黃金作為高流動性儲蓄工具的偏好。
儘管北美和歐洲的需求似乎趨於穩定,但由於實際收益率的波動,投資者興趣再次升溫。 2024年,美國上市的黃金交易所交易基金(ETF)淨增加152噸,扭轉了先前兩年的淨流出局面。同時,受能源價格波動加劇的影響,歐洲基金淨增加98噸。加拿大礦山供應175噸黃金,主要得益於迪圖爾湖金礦的擴建,該礦於2024年第四季達到運作。在黃金產業,該地區法規環境的穩定性以及資本市場的便利性正在刺激現有礦山的擴建,這有助於抵消其他地區品位下降的影響。在供應方面,拉丁美洲和非洲繼續發揮重要作用。秘魯和巴西2024年的黃金供應總量為290噸,儘管秘魯的物流曾因社會抗議活動而間歇性中斷。由於2024年《礦業投資法案》簡化的許可程序,加納已超越南非,成為非洲大陸最大的黃金生產國,出口量達129噸。非洲多家中央銀行已宣布計劃將其黃金儲備提高至至少10%。此舉可能促使該地區部分黃金產量流入國內保險箱,而非用於出口。在中東,隨著波灣合作理事會(GCC)成員國推廣符合伊斯蘭教法原則的黃金儲蓄產品,黃金需求略有成長,私人投資者參與黃金產業的程度也有所提高。
其他好處
- Excel格式的市場預測(ME)表
- 3個月的分析師支持
目錄
第1章:引言
- 研究假設和市場定義
- 調查範圍
第2章:調查方法
第3章執行摘要
第4章 市場狀況
- 市場概覽
- 市場促進因素
- 在通膨對沖環境下,個人投資者對ETF的需求激增。
- 各國央行擺脫對美元依賴的策略正在加速外匯存底多元化。
- 印度和東協中產階級對珠寶的需求日益成長
- 人工智慧驅動的電子設備正在推動超細金鍵合線的應用。
- 代幣化黃金產品正在擴大數位資產的普及應用。
- 市場限制因素
- 由於開採礦石品位下降,AISC 已超過每盎司 1450 美元。
- 新建待開發區面臨的ESG相關資金籌措限制
- 主要消費國進口關稅的波動抑制了珠寶需求。
- 價值鏈分析
- 波特五力模型
第5章 市場規模與成長預測
- 按供應來源
- 初級採礦
- 資金回收
- 按類型
- 金合金
- 鍍金
- 透過使用
- 珠寶
- 電子設備
- 獎項和地位象徵
- 其他用途(牙科、航太等)
- 按地區
- 生產分析
- 美國
- 澳洲
- 巴西
- 布吉納法索
- 加拿大
- 中國
- 哥倫比亞
- 迦納
- 印尼
- 哈薩克
- 馬利共和國
- 墨西哥
- 巴布亞紐幾內亞
- 秘魯
- 俄羅斯
- 南非
- 蘇丹
- 坦尚尼亞
- 烏茲別克
- 其他國家
- 消費分析
- 亞太地區
- 中國
- 印度
- 日本
- 韓國
- 其他亞太國家
- 北美洲
- 美國
- 加拿大
- 墨西哥
- 歐洲
- 德國
- 英國
- 義大利
- 法國
- 其他歐洲國家
- 南美洲
- 巴西
- 阿根廷
- 其他南美國家
- 中東和非洲
- 沙烏地阿拉伯
- 南非
- 其他中東和非洲國家
- 亞太地區
- 生產分析
第6章 競爭情勢
- 市場集中度
- 策略趨勢
- 市佔率和排名分析
- 公司簡介
- Agnico Eagle Mines Limited
- AnglogoldAshanti
- B2Gold Corp.
- Barrick Mining Corporation
- China Gold International Resources Corp., Ltd.
- Endeavour Mining plc
- Equinox Gold Corp.
- Franco-Nevada Corporation
- FURUKAWA CO., LTD.
- Gabriel Resources
- Gold Fields Limited
- Harmony Gold Mining Company Limited
- Johnson Matthey
- Kinross Gold Corporation
- Lundin Gold Inc.
- Newmont Corporation
- PJSC Polyus
- Zijin Mining Group Co., Ltd.
第7章 市場機會與未來展望
According to Mordor Intelligence, the gold market size market is expected to grow from 4.75 kilotons in 2025 to 5.1 kilotons in 2026 and is forecast to reach 7.25 kilotons by 2031 at 7.30% CAGR over 2026-2031.
This report is Segmented by Source (Primary Mining and Recycled Gold), Type (Alloyed Gold and Layered Gold), Application (Jewellery, Electronics, Awards and Status Symbols, and Other Applications (Dental, Aerospace, Etc. )), and Geography (Production and Consumption Analysis Across Major Regions). The Market Forecasts are Provided in Terms of Volume (tons).
Global Gold Market Trends and Insights
Surging Retail and ETF Investment Demand in Inflation-Hedge Environments
Persistently high consumer-price levels and doubts over monetary-policy effectiveness have re-anchored gold in diversified portfolios. Gold exchange-traded funds in India attracted INR 112 Billion (USD 1.3 Billion) of net inflows during 2024, the highest annual tally on record . The metal out-performed local equities by 21 percentage points that year, reinforcing its safe-haven status. Portfolio managers in the United States and Europe lifted strategic allocations as real yields turned negative, and survey data show a rising preference for gold when inflation exceeds 4%. Coins and bars remain popular among retail savers seeking physical hedges, and demand proved remarkably inelastic after spot prices broke above USD 2,300 /oz. The structural shift in investment behaviour is expected to keep the market well bid whenever macro volatility spikes.
Central-Bank De-Dollarization Strategies Accelerating Reserve Diversification
Central banks bought more than 1,000 tons of gold in each of the past three calendar years, a historic streak that underscores growing skepticism toward the US dollar's future dominance. In the World Gold Council's 2025 survey, 95% of respondents said they would either maintain or increase their bullion holdings, and 43% plan outright additions. China, India, and Turkey led net purchases that together topped 600 tons since 2021, reflecting policy moves to mitigate sanction risk and currency volatility. The dollar's share of global foreign-exchange reserves slipped to 58.9% by March 2024, its lowest level since modern records began, increasing the attractiveness of gold as a neutral store of value. Active bullion management grew from 37% to 44% of official holdings over 2024-2025, signalling a longer-run structural bid beneath the gold industry.
Declining Mined Ore Grades Raising AISC Beyond USD 1,450 /oz
Ore grades continue to fall at mature deposits, forcing operators to process more material to maintain output. Newmont reported its highest cost base in nine years, with all-in sustaining costs at USD 1,651 /oz in Q1 2025, a 29% jump from 2022. Industry-wide all-in sustaining costs (AISC) averaged USD 1,388 /oz in Q2 2024, and North American producers faced an even steeper USD 1,522 /oz. Labour shortages, rising energy prices, and royalty escalators linked to spot quotations intensify cost pressures. Although a record spot price shields margins today, sustained cost inflation squeezes feasibility for marginal pits and accelerates mine closures. Over the medium term, higher cost curves could temper fresh supply and lift the floor under the gold industry.
Other drivers and restraints analyzed in the detailed report include:
- Rising Middle-Class Jewellery Demand in India and ASEAN
- AI-Enabled Electronics Driving Ultra-Fine Gold Bonding-Wire Usage
- ESG-Driven Financing Constraints for New Green-Field Mines
For complete list of drivers and restraints, kindly check the Table Of Contents.
Segment Analysis
Primary extraction occupied 72.05% of the Gold market share in 2025, confirming that large-scale open-pit and underground mines remain the backbone of supply. The segment benefits from established logistics, skilled labour pools, and long-term offtake contracts that stabilise throughput even when ore grades erode. However, all-in sustaining costs rising above USD 1,388 /oz signal diminishing returns on fresh capital, and companies have intensified exploration around existing hubs to leverage sunk infrastructure.
Recycling, though only 27.95% of supply, is marching forward at an 7.98% CAGR to 2031, the fastest rate of any source segment. The Royal Mint's South Wales facility processes 4,000 tons of circuit boards annually using patented hydrometallurgical techniques with 99% recovery efficiency . Energy demand for recycling is roughly 300 times lower than for green-field mining, lowering carbon intensity and aligning with Environmental, Social, and Governance (ESG) mandates. Luxury-goods leader Pandora pledged to use 100% recycled precious metals by 2025, creating pull for scrap flows. As more jurisdictions tighten e-waste rules, secondary feedstock will become a strategic pillar in the Gold industry.
Complete Report Scope:
- By Source
- Primary Mining
- Recycled Gold
- By Type
- Alloyed Gold
- Layered Gold
- By Application
- Jewellery
- Electronics
- Awards and Status Symbols
- Other Applications (Dental, Aerospace, etc.)
- By Geography
- Production Analysis
- United States
- Australia
- Brazil
- Burkina Faso
- Canada
- China
- Colombia
- Ghana
- Indonesia
- Kazakhstan
- Mali
- Mexico
- Papua New Guinea
- Peru
- Russia
- South Africa
- Sudan
- Tanzania
- Uzbekistan
- Other countries
- Consumption Analysis
- Asia-Pacific
- China
- India
- Japan
- South Korea
- Rest of Asia-Pacific
- North America
- United States
- Canada
- Mexico
- Europe
- Germany
- United Kingdom
- Italy
- France
- Rest of Europe
- South America
- Brazil
- Argentina
- Rest of South America
- Middle East and Africa
- Saudi Arabia
- South Africa
- Rest of Middle East and Africa
- Asia-Pacific
- Production Analysis
Geography Analysis
Asia-Pacific held 59.85% of the Gold industry in 2025 and is projected to grow with a 8.95% CAGR through 2031. China mined 403 tons in 2024, retaining pole position in production while its central bank lifted official holdings for the 19th consecutive month. India's Reserve Bank expanded bullion reserves to 880 tons by July 2025, and consumer demand rebounded once import duties fell. Indonesia, Thailand, and Vietnam posted double-digit percentage gains in jewelry offtake, reflecting rising disposable income and a preference for gold as a liquid savings vehicle.
North America and Europe exhibit mature demand profiles yet see renewed investor interest as real yields gyrate. US-listed gold Exchange Traded Funds (ETFs) added 152 tons during 2024, reversing two years of net outflows, while European funds absorbed 98 tons amid heightened energy-price volatility. Canadian mines contributed 175 t of output, led by the Detour Lake expansion that reached full capacity in Q4 2024. Within the gold industry, the region's regulatory stability and access to capital markets encourage brownfield expansions that help offset grade decline elsewhere. Latin America and Africa remain pivotal on the supply side. Peru and Brazil delivered a combined 290 tons in 2024, though social protests in Peru intermittently halted logistics movements. Ghana overtook South Africa as the continent's top producer, shipping 129 tons, aided by streamlined permitting under its 2024 Mining Investment Bill. Several African central banks announced plans to raise gold holdings to at least 10% of reserves, a move that could redirect part of regional output toward domestic vaults rather than export channels. Middle Eastern demand ticked higher as Gulf Cooperation Council states promoted gold-based savings products aligned with Sharia principles, enhancing retail participation in the Gold industry.
- Agnico Eagle Mines Limited
- AnglogoldAshanti
- B2Gold Corp.
- Barrick Mining Corporation
- China Gold International Resources Corp., Ltd.
- Endeavour Mining plc
- Equinox Gold Corp.
- Franco-Nevada Corporation
- FURUKAWA CO., LTD.
- Gabriel Resources
- Gold Fields Limited
- Harmony Gold Mining Company Limited
- Johnson Matthey
- Kinross Gold Corporation
- Lundin Gold Inc.
- Newmont Corporation
- PJSC Polyus
- Zijin Mining Group Co., Ltd.
Additional Benefits:
- The market estimate (ME) sheet in Excel format
- 3 months of analyst support
TABLE OF CONTENTS
1 Introduction
- 1.1 Study Assumptions & Market Definition
- 1.2 Scope of the Study
2 Research Methodology
3 Executive Summary
4 Market Landscape
- 4.1 Market Overview
- 4.2 Market Drivers
- 4.2.1 Surging Retail and ETF Investment Demand in Inflation-hedge Environments
- 4.2.2 Central-bank De-dollarization Strategies Accelerating Reserve Diversification
- 4.2.3 Rising Middle-class Jewellery Demand in India and Asean
- 4.2.4 AI-Enabled Electronics Driving Ultra-fine Gold Bonding Wire Usage
- 4.2.5 Tokenised Gold Products Expanding Digital Asset Adoption
- 4.3 Market Restraints
- 4.3.1 Declining Mined Ore-grades Raising AISC Beyond USD 1,450/oz
- 4.3.2 ESG-driven Financing Constraints for New Green-field Mines
- 4.3.3 Volatile Import Duties in Key Consuming Nations Curb Jewellery Demand
- 4.4 Value Chain Analysis
- 4.5 Porter's Five Forces
- 4.5.1 Bargaining Power of Suppliers
- 4.5.2 Bargaining Power of Buyers
- 4.5.3 Threat of New Entrants
- 4.5.4 Threat of Substitutes
- 4.5.5 Degree of Competition
5 Market Size & Growth Forecasts (Volume)
- 5.1 By Source
- 5.1.1 Primary Mining
- 5.1.2 Recycled Gold
- 5.2 By Type
- 5.2.1 Alloyed Gold
- 5.2.2 Layered Gold
- 5.3 By Application
- 5.3.1 Jewellery
- 5.3.2 Electronics
- 5.3.3 Awards and Status Symbols
- 5.3.4 Other Applications (Dental, Aerospace, etc.)
- 5.4 By Geography
- 5.4.1 Production Analysis
- 5.4.1.1 United States
- 5.4.1.2 Australia
- 5.4.1.3 Brazil
- 5.4.1.4 Burkina Faso
- 5.4.1.5 Canada
- 5.4.1.6 China
- 5.4.1.7 Colombia
- 5.4.1.8 Ghana
- 5.4.1.9 Indonesia
- 5.4.1.10 Kazakhstan
- 5.4.1.11 Mali
- 5.4.1.12 Mexico
- 5.4.1.13 Papua New Guinea
- 5.4.1.14 Peru
- 5.4.1.15 Russia
- 5.4.1.16 South Africa
- 5.4.1.17 Sudan
- 5.4.1.18 Tanzania
- 5.4.1.19 Uzbekistan
- 5.4.1.20 Other countries
- 5.4.2 Consumption Analysis
- 5.4.2.1 Asia-Pacific
- 5.4.2.1.1 China
- 5.4.2.1.2 India
- 5.4.2.1.3 Japan
- 5.4.2.1.4 South Korea
- 5.4.2.1.5 Rest of Asia-Pacific
- 5.4.2.2 North America
- 5.4.2.2.1 United States
- 5.4.2.2.2 Canada
- 5.4.2.2.3 Mexico
- 5.4.2.3 Europe
- 5.4.2.3.1 Germany
- 5.4.2.3.2 United Kingdom
- 5.4.2.3.3 Italy
- 5.4.2.3.4 France
- 5.4.2.3.5 Rest of Europe
- 5.4.2.4 South America
- 5.4.2.4.1 Brazil
- 5.4.2.4.2 Argentina
- 5.4.2.4.3 Rest of South America
- 5.4.2.5 Middle East and Africa
- 5.4.2.5.1 Saudi Arabia
- 5.4.2.5.2 South Africa
- 5.4.2.5.3 Rest of Middle East and Africa
- 5.4.2.1 Asia-Pacific
- 5.4.1 Production Analysis
6 Competitive Landscape
- 6.1 Market Concentration
- 6.2 Strategic Moves
- 6.3 Market Share(%)/Ranking Analysis
- 6.4 Company Profiles (includes Global level Overview, Market level overview, Core Segments, Financials as available, Strategic Information, Market Rank/Share for key companies, Products & Services, and Recent Developments)
- 6.4.1 Agnico Eagle Mines Limited
- 6.4.2 AnglogoldAshanti
- 6.4.3 B2Gold Corp.
- 6.4.4 Barrick Mining Corporation
- 6.4.5 China Gold International Resources Corp., Ltd.
- 6.4.6 Endeavour Mining plc
- 6.4.7 Equinox Gold Corp.
- 6.4.8 Franco-Nevada Corporation
- 6.4.9 FURUKAWA CO., LTD.
- 6.4.10 Gabriel Resources
- 6.4.11 Gold Fields Limited
- 6.4.12 Harmony Gold Mining Company Limited
- 6.4.13 Johnson Matthey
- 6.4.14 Kinross Gold Corporation
- 6.4.15 Lundin Gold Inc.
- 6.4.16 Newmont Corporation
- 6.4.17 PJSC Polyus
- 6.4.18 Zijin Mining Group Co., Ltd.
7 Market Opportunities & Future Outlook
- 7.1 White-space & Unmet-need Assessment
- 7.2 Use of Cyanide Leaching for Extracting Gold

 戰略金屬市場:依金屬類型、應用、最終用戶、國家及地區分類-全球產業分析、市場規模、市場佔有率及2026年至2033年預測
 2026-2030年全球砷金屬市場
 黃金市場規模、佔有率、成長、全球產業分析、區域趨勢以及 2026 年至 2034 年的預測。
 戰略金屬市場:稀土元素、電池金屬、貴金屬,依形態及最終用途分類-2026-2032年全球市場預測金屬合金市場:按合金類型、形狀、製造流程和應用分類-全球預測,2026-2032年
 金屬合金市場規模、佔有率和成長分析:按產品類型、合金元素、製造流程、功能、最終用途產業、分銷管道和地區分類-2026-2033年產業預測
 砷金屬市場-全球產業規模、佔有率、趨勢、機會、預測:銷售管道、最終用途、區域和競爭格局(2021-2031年)全球金屬氧化物市場規模、佔有率、趨勢和成長分析報告(2026-2034年)
 金屬惰性:市場佔有率分析、行業趨勢和統計數據以及成長預測(2026-2031 年)
 金屬及金屬加工產品市場:依產品類型、金屬類型、最終用途產業及地區分類(2026-2034 年)