


 |
市場調查報告書
商品編碼
2119800
汽車貸款:市場佔有率分析、產業趨勢與統計、成長預測(2026-2031)Auto Loan - Market Share Analysis, Industry Trends & Statistics, Growth Forecasts (2026 - 2031) |
||||||

※ 本網頁內容可能與最新版本有所差異。詳細情況請與我們聯繫。
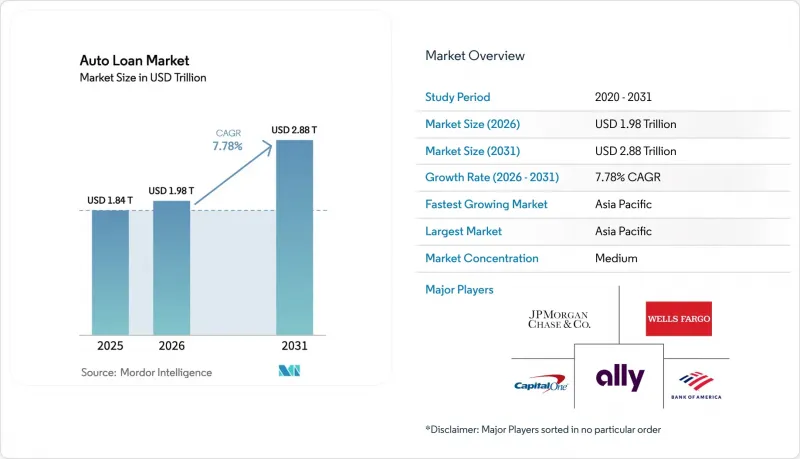
據 Mordor Intelligence 稱,2025 年汽車貸款市場價值 1.84 兆美元,預計到 2031 年將達到 2.88 兆美元,而 2026 年為 1.98 兆美元,預測期內(2026-2031 年)的複合年成長率為 7.78%預計。
本報告按車輛類型(乘用車、商用車)、車輛類型(摩托車/踏板車、自動三輪車/三輪貨車、其他)、所有權類型(新車、二手車)、提供者類型(銀行、非銀行金融機構、其他)、合約期限(3年以下、其他)和地區(北美、其他)進行分類。市場預測以美元計價。
全球汽車貸款市場趨勢與洞察
乘用車需求不斷成長
到2024年,乘用車融資市場佔有率將達到81.23%,並以8.95%的複合年成長率成長,這主要得益於中國、印度和東南亞的快速都市化進程。預計到2030年,中國汽車製造商的全球市佔率將從2024年的21%成長至33%,這將推動專屬式金融在出口市場的滲透。電動車(EV)進一步推動了這一趨勢。亞洲佔全球電動車銷售的60%,中國的目標是到2025年實現電動車在新車銷售的滲透率達到45%。金融機構正透過為電動車客製化殘值方案並提供與電池保固掛鉤的優惠利率來掌握這些趨勢。
快速數位貸款核准
與2020年相比,數位貸款申請量增加了165%,核准時間也縮短至兩分鐘以內,這得益於單頁申請表和軟性信用查詢。 Capital One的「汽車導航器」可在車輛搜尋中提供預已通過核准利率,而Upstart的AI工作流程則使經銷商能夠在不到一分鐘的時間內完成交易,並自動執行FICO信用評分和詐欺檢查。超過70%的購車者更傾向於在家中完成貸款流程,經銷商報告稱,預核准潛在客戶的轉換率提高了41%。平台貸款機構透過自動化工作流程減少人工審核流程,降低單筆交易成本,從而實現了成本效益。
利率上升
2024年11月,聯準會將政策利率下調了25個基點,但汽車貸款的年化利率仍居高不下,對消費者的購車需求造成了壓力。 Bankrate的數據證實,政策利率的上升直接導致汽車貸款利率上漲,尤其是在次級貸款借款人中。目前的違約率已超過疫情前的峰值,聯準會也注意到2022年發放的貸款的還款情況惡化。貸款機構正在收緊信用評分標準,並且更多地使用替代數據來平衡成長和風險。
細分市場分析
到2025年,乘用車貸款將佔全球汽車貸款市場的80.75%,預計該細分市場將以7.46%的複合年成長率成長,這表明全球汽車貸款市場正日益成為家庭出行預算的重要組成部分。緊湊型SUV和電池式電動車(BEV)的興起擴大了借款人群體,並使貸款機構能夠交叉銷售保險和服務合約。相比之下,商用車融資仍然具有高度週期性,因為它依賴貨運量和電子商務需求。尋求更環保卡車的中國車隊營運商對由汽車製造商擔保的綠色金融產品表現出越來越濃厚的興趣。
在標準化的信用評估標準和充足的抵押品流動性支持下,此細分市場對全球汽車貸款市場規模貢獻顯著。隨著都市區堵塞應對措施的不斷完善,貸款機構正在開發共用所有權試驗計畫,將車輛殘值證券化,供多個用戶共享。同時,商用車貸款機構正在實施基於遙測技術的「按里程付費」系統,將還款金額與行駛里程和載重係數掛鉤。
到2025年,掀背車、轎車和SUV等乘用車將佔全球汽車貸款市場的82.30%。這反映了消費者強勁的偏好和經銷商提供的充足融資方案。然而,隨著都市區尋求經濟實惠且高度便利的交通工具,摩托車和踏板車的複合年成長率(CAGR)正以9.98%的速度成長。雖然該細分市場的貸款額較小,但貸款數量龐大,顯著推動了印度和東南亞地區全球汽車貸款市場的擴張。
金融機構正採用以風險為基礎的機車定價策略,力求在快速折舊免稅額和高回收率之間取得平衡。貨運三輪車和皮卡車也正進入金融科技平台市場,提供遠端客戶身份驗證 (KYC) 和即時抵押品登記服務。乘用車繼續在證券化資產池中佔據主導地位,確保了二級市場的流動性,並使風險溢價低於微型出行貸款。
區域分析
亞太地區預計將成為全球汽車貸款市場的中心,預計到2025年將佔據33.62%的市場佔有率,並以9.48%的複合年成長率成長。中國於2024年4月取消最低首付要求的政策刺激了貸款需求,並增加了展示室客流量。該地區在電動車領域的主導地位(佔全球銷量的60%)促使貸款機構提供電池殘值模式和充電訂閱等附加服務。印度和東協成員國已放寬電子身份驗證(e-KYC)框架,從而推動了透過智慧型手機應用程式進行摩托車貸款業務的成長。
北美市場已趨於成熟,但仍有波動。美國消費者金融保護局 (CFPB) 2024 年監管報告指出,在 GAP 豁免和附加選項的銷售中存在欺騙性做法,迫使金融機構從根本上修訂其資訊揭露。由於平均交易價格為 48,000 美元,消費者往往傾向於選擇較長的還款期限和購買二手車。預計到 2025 年,隨著貸款機構實現收入驗證和電子抵押貸款登記的自動化,數位貸款發放數量將增加 29%。由於聯準會的政策,優惠年利率仍然居高不下,給信用評分較低的借款人帶來了壓力,且違約率高於疫情前水準。
歐洲正面臨監管格局的劇變。在英國,一場關於費用透明度的訴訟可能導致高達280億英鎊的賠償,這可能會改變貸款機構的收入結構。同時,投資人正在尋求浮動利率資產,預計到2024年,證券化規模將達到1,370億歐元。歐洲大陸的銀行正在擴大其綠色旅遊產品組合,預計到2035年,汽車金融的附加價值毛額將增加300億至400億美元。中東和非洲蘊藏著巨大的成長潛力。海灣合作理事會(GCC)的銀行正利用預計3.5%的GDP成長率來擴大符合伊斯蘭教法的汽車金融產品,而在南非,數位化進入法規正在加速普惠信貸的普及。
其他好處
- Excel格式的市場預測(ME)表
- 3個月的分析師支持
目錄
第1章:引言
- 研究假設和市場定義
- 調查範圍
第2章:調查方法
第3章執行摘要
第4章 市場狀況
- 市場概覽
- 市場促進因素
- 乘用車需求增加
- 快速數位貸款核准
- 二手車貸款業務拓展
- 基於OEM的專屬式融資的成長
- 利用行動平台的嵌入式金融
- 針對信用記錄有限的借款人的AI驅動型信用評分
- 市場限制因素
- 利率上升
- 汽車價格飆升
- 對氣球貸款和長期貸款的監管監測
- 向車輛訂閱模式過渡
- 價值供應鏈分析
- 監理情勢
- 技術展望
- 波特五力模型
第5章 市場規模與成長預測
- 車輛類型
- 搭乘用車
- 商用車輛
- 按車輛類型
- 摩托車和踏板車
- 自動三輪車/貨運三輪車
- 乘用車(掀背車、轎車、SUV 等)
- 皮卡和小型貨車
- 卡車和巴士
- 其他
- 依所有權類型
- 新車
- 二手車
- 按提供者類型
- 銀行
- 非銀行金融機構
- 汽車製造商
- 其他類型的服務提供者(金融科技公司)
- 按合約期限
- 不到3年
- 3-5年
- 5年或以上
- 按地區
- 北美洲
- 美國
- 加拿大
- 墨西哥
- 南美洲
- 巴西
- 阿根廷
- 智利
- 哥倫比亞
- 其他南美國家
- 歐洲
- 英國
- 德國
- 法國
- 西班牙
- 義大利
- 比荷盧經濟聯盟(比利時、荷蘭、盧森堡)
- 北歐國家(瑞典、挪威、丹麥、芬蘭、冰島)
- 其他歐洲國家
- 亞太地區
- 中國
- 印度
- 日本
- 韓國
- 澳洲
- 東南亞(新加坡、印尼、馬來西亞、泰國、越南、菲律賓)
- 其他亞太國家
- 中東和非洲
- 阿拉伯聯合大公國
- 沙烏地阿拉伯
- 南非
- 奈及利亞
- 其他中東和非洲國家
- 北美洲
第6章 競爭情勢
- 市場集中度
- 策略趨勢
- 市佔率分析
- 公司簡介
- Ally Financial
- Wells Fargo
- JPMorgan Chase Auto
- Capital One
- Bank of America
- BNP Paribas Personal Finance
- Credit Agricole Auto Bank
- HDFC Bank
- ICICI Bank
- Mashreq Bank
- Toyota Financial Services
- Ford Motor Credit Company
- GM Financial
- Santander Consumer USA
- Hyundai Capital
- Daimler Mobility AG
- Volkswagen Financial Services
- PSA Banque(Stellantis Financial Services)
- Axis Bank
- Barclays
第7章 市場機會與未來展望
According to Mordor Intelligence, the auto loan market size was valued at USD 1.84 trillion in 2025 and is estimated to grow from USD 1.98 trillion in 2026 to reach USD 2.88 trillion by 2031, at a CAGR of 7.78% during the forecast period (2026-2031).
This report is Segmented by Vehicle Type (Passenger Vehicle, Commercial Vehicle), Vehicle Model (Motorcycles/Scooters, Auto-rickshaws/Cargo 3Ws, and More), Ownership (New Vehicles, Used Vehicles), Provider Type (Banks, Non-Banking Financial Institutions, and More), Tenure (Less Than 3 Years, and More), and Geography (North America, and More). The Market Forecasts are Provided in Terms of Value (USD).
Global Auto Loan Market Trends and Insights
Increasing Demand for Passenger Vehicles
Passenger-vehicle originations contributed 81.23% of the 2024 market share and are growing at an 8.95% CAGR, buoyed by rapid urbanization across China, India, and Southeast Asia. Chinese OEMs are on course for a 33% global share by 2030, up from 21% in 2024, spurring captive-finance penetration in export markets. Electric vehicles (EVs) reinforce this trajectory; Asia accounts for 60% of global EV sales as China targets 45% EV penetration of new sales in 2025. Lenders exploit these trends by tailoring residual-value programs for EVs and offering rate incentives that mirror battery warranties.
Quick Digital Loan Processing
Digital origination volumes grew 165% versus 2020, with single-page applications and soft-credit pulls reducing approval times to under two minutes. Capital One's Auto Navigator provides pre-approved rates during vehicle search, while Upstart's AI workflow lets dealers close a deal in less than one minute, automatically delivering FICO Auto Scores and fraud checks. Over 70% of shoppers prefer completing finance steps at home, and dealers report 41% higher close ratios on pre-qualified leads. Platform lenders reap cost efficiencies as automated workflows cut manual underwriting steps and shrink acquisition cost per booked loan.
Rising Interest Rates
Although the Federal Reserve trimmed rates by 25 bps in November 2024, auto APRs remain elevated and weigh on wallet share. Bankrate data confirm that higher policy rates directly translate into more expensive auto loans, especially for subprime tiers. Delinquencies now exceed pre-pandemic peaks, with the Federal Reserve noting performance deterioration across 2022-vintage loans. Lenders are tightening score cutoffs and amplifying the use of alternative data to balance growth and risk.
Other drivers and restraints analyzed in the detailed report include:
- Expansion of Used-Vehicle Financing
- OEM Captive-Finance Growth
- Escalating Vehicle Prices
For complete list of drivers and restraints, kindly check the Table Of Contents.
Segment Analysis
Passenger-vehicle loans accounted for an 80.75% share in the global auto loan market in 2025, and the segment is expected to advance at an 7.46% CAGR, embedding the Global auto loan market in household mobility budgets. The rise of compact SUVs and battery-electric models has broadened borrower profiles, enabling lenders to cross-sell insurance and service contracts. In contrast, commercial-vehicle financing remains cyclical, tied to freight volumes and e-commerce demand. Chinese fleet operators seeking cleaner trucks spur interest in green-finance lines backed by OEM warranties.
The segment contributes materially to the Global auto loan market size because it supports standardized underwriting matrices and robust collateral liquidity. As city congestion policies evolve, lenders develop shared-ownership pilot programs that securitize residual value across multiple users. Commercial-vehicle lenders, meanwhile, deploy telemetry-driven pay-as-you-drive structures that link repayment to mileage and load factors.
Cars-hatchbacks, sedans, and SUVs-held 82.30% share in the global auto loan market in 2025, reflecting entrenched consumer preference and ample dealership financing infrastructure. Yet, motorcycles and scooters outpace with a 9.98% CAGR as urban riders seek affordable and nimble transport. Loan-ticket sizes in this sub-segment are lower, but origination volumes are high, contributing meaningfully to the Global auto loan market depth in India and Southeast Asia.
Financiers craft risk-based pricing for two-wheelers, balancing faster depreciation with higher recovery rates. Cargo three-wheelers and pickups are also joining fintech platforms that offer remote KYC and instant lien registration. Cars continue to dominate securitization pools, ensuring secondary-market liquidity and keeping risk premiums compressed relative to micro-mobility loans.
Complete Report Scope:
- By Vehicle Type
- Passenger Vehicle
- Commercial Vehicle
- By Vehicle Model
- Motorcycles/Scooters
- Auto-rickshaws/Cargo 3Ws
- Cars (Hatchbacks, Sedans, SUVs, etc.)
- Pickups and Small Vans
- Trucks and Buses
- Others
- By Ownership
- New Vehicles
- Used Vehicles
- By Provider Type
- Banks
- Non-Banking Financial Institutions
- Original Equipment Manufacturers
- Other Provider Types (Fintech Companies)
- By Tenure
- Less than 3 Years
- 3-5 Years
- More than 5 years
- By Region
- North America
- United States
- Canada
- Mexico
- South America
- Brazil
- Argentina
- Chile
- Colombia
- Rest of South America
- Europe
- United Kingdom
- Germany
- France
- Spain
- Italy
- Benelux (Belgium, Netherlands, and Luxembourg)
- Nordics (Sweden, Norway, Denmark, Finland, and Iceland)
- Rest of Europe
- Asia-Pacific
- China
- India
- Japan
- South Korea
- Australia
- South-East Asia (Singapore, Indonesia, Malaysia, Thailand, Vietnam, and Philippines)
- Rest of Asia-Pacific
- Middle East and Africa
- United Arab Emirates
- Saudi Arabia
- South Africa
- Nigeria
- Rest of Middle East and Africa
- North America
Geography Analysis
Asia-Pacific anchors the Global auto loan market with a 33.62% 2025 share and a 9.48% CAGR outlook. China's April 2024 policy scrapping minimum down payments ignited credit demand and boosted showroom traffic. The region's EV leadership, with 60% of global sales, pulls lenders toward battery-residual models and charging-subscription add-ons. India and ASEAN members liberalize e-KYC frameworks, enabling two-wheeler credit expansion via smartphone apps.
North America remains mature yet fluid. The CFPB's 2024 supervisory report spotlighted deceptive GAP-waiver and add-on sales, prompting lenders to overhaul disclosures. Average transaction prices at USD 48,000 steer consumers toward longer tenures and used inventory. Digital origination volumes climbed 29% in 2025, as lenders automate income verification and electronic lien filing. Federal Reserve policy keeps prime APRs high, squeezing marginal borrowers and lifting delinquencies above pre-pandemic levels.
Europe contends with regulatory shake-ups. In the United Kingdom, potential GBP 28 billion in redress stemming from commission transparency litigation could reorder lender economics. Meanwhile, securitization volumes reached EUR 137 billion in 2024 as investors sought floating-rate assets. Continental banks upscale green-mobility portfolios, anticipating a USD 30-40 billion uplift to auto-finance gross value added by 2035. Middle East and Africa markets offer white-space growth: GCC banks capitalize on 3.5% GDP growth forecasts to extend Sharia-compliant auto products, while South Africa's digital-on-boarding rules accelerate credit inclusion.
- Ally Financial
- Wells Fargo
- JPMorgan Chase Auto
- Capital One
- Bank of America
- BNP Paribas Personal Finance
- Credit Agricole Auto Bank
- HDFC Bank
- ICICI Bank
- Mashreq Bank
- Toyota Financial Services
- Ford Motor Credit Company
- GM Financial
- Santander Consumer USA
- Hyundai Capital
- Daimler Mobility AG
- Volkswagen Financial Services
- PSA Banque (Stellantis Financial Services)
- Axis Bank
- Barclays
Additional Benefits:
- The market estimate (ME) sheet in Excel format
- 3 months of analyst support
TABLE OF CONTENTS
1 Introduction
- 1.1 Study Assumptions & Market Definition
- 1.2 Scope of the Study
2 Research Methodology
3 Executive Summary
4 Market Landscape
- 4.1 Market Overview
- 4.2 Market Drivers
- 4.2.1 Increasing demand for passenger vehicles
- 4.2.2 Quick digital loan processing
- 4.2.3 Expansion of used-vehicle financing
- 4.2.4 OEM captive-finance growth
- 4.2.5 Embedded finance with mobility platforms
- 4.2.6 AI-based credit scoring for thin-file borrowers
- 4.3 Market Restraints
- 4.3.1 Rising interest rates
- 4.3.2 Escalating vehicle prices
- 4.3.3 Regulatory scrutiny on balloon/long-tenor loans
- 4.3.4 Shift toward vehicle-subscription models
- 4.4 Value / Supply-Chain Analysis
- 4.5 Regulatory Landscape
- 4.6 Technological Outlook
- 4.7 Porter's Five Forces
- 4.7.1 Bargaining Power of Buyers
- 4.7.2 Bargaining Power of Suppliers
- 4.7.3 Threat of New Entrants
- 4.7.4 Threat of Substitutes
- 4.7.5 Intensity of Competitive Rivalry
5 Market Size & Growth Forecasts (Value)
- 5.1 By Vehicle Type
- 5.1.1 Passenger Vehicle
- 5.1.2 Commercial Vehicle
- 5.2 By Vehicle Model
- 5.2.1 Motorcycles/Scooters
- 5.2.2 Auto-rickshaws/Cargo 3Ws
- 5.2.3 Cars (Hatchbacks, Sedans, SUVs, etc.)
- 5.2.4 Pickups and Small Vans
- 5.2.5 Trucks and Buses
- 5.2.6 Others
- 5.3 By Ownership
- 5.3.1 New Vehicles
- 5.3.2 Used Vehicles
- 5.4 By Provider Type
- 5.4.1 Banks
- 5.4.2 Non-Banking Financial Institutions
- 5.4.3 Original Equipment Manufacturers
- 5.4.4 Other Provider Types (Fintech Companies)
- 5.5 By Tenure
- 5.5.1 Less than 3 Years
- 5.5.2 3-5 Years
- 5.5.3 More than 5 years
- 5.6 By Region
- 5.6.1 North America
- 5.6.1.1 United States
- 5.6.1.2 Canada
- 5.6.1.3 Mexico
- 5.6.2 South America
- 5.6.2.1 Brazil
- 5.6.2.2 Argentina
- 5.6.2.3 Chile
- 5.6.2.4 Colombia
- 5.6.2.5 Rest of South America
- 5.6.3 Europe
- 5.6.3.1 United Kingdom
- 5.6.3.2 Germany
- 5.6.3.3 France
- 5.6.3.4 Spain
- 5.6.3.5 Italy
- 5.6.3.6 Benelux (Belgium, Netherlands, and Luxembourg)
- 5.6.3.7 Nordics (Sweden, Norway, Denmark, Finland, and Iceland)
- 5.6.3.8 Rest of Europe
- 5.6.4 Asia-Pacific
- 5.6.4.1 China
- 5.6.4.2 India
- 5.6.4.3 Japan
- 5.6.4.4 South Korea
- 5.6.4.5 Australia
- 5.6.4.6 South-East Asia (Singapore, Indonesia, Malaysia, Thailand, Vietnam, and Philippines)
- 5.6.4.7 Rest of Asia-Pacific
- 5.6.5 Middle East and Africa
- 5.6.5.1 United Arab Emirates
- 5.6.5.2 Saudi Arabia
- 5.6.5.3 South Africa
- 5.6.5.4 Nigeria
- 5.6.5.5 Rest of Middle East and Africa
- 5.6.1 North America
6 Competitive Landscape
- 6.1 Market Concentration
- 6.2 Strategic Moves
- 6.3 Market Share Analysis
- 6.4 Company Profiles (includes Global Level Overview, Market Level Overview, Core Segments, Financials as available, Strategic Information, Market Rank/Share for Key Companies, Products & Services, and Recent Developments)
- 6.4.1 Ally Financial
- 6.4.2 Wells Fargo
- 6.4.3 JPMorgan Chase Auto
- 6.4.4 Capital One
- 6.4.5 Bank of America
- 6.4.6 BNP Paribas Personal Finance
- 6.4.7 Credit Agricole Auto Bank
- 6.4.8 HDFC Bank
- 6.4.9 ICICI Bank
- 6.4.10 Mashreq Bank
- 6.4.11 Toyota Financial Services
- 6.4.12 Ford Motor Credit Company
- 6.4.13 GM Financial
- 6.4.14 Santander Consumer USA
- 6.4.15 Hyundai Capital
- 6.4.16 Daimler Mobility AG
- 6.4.17 Volkswagen Financial Services
- 6.4.18 PSA Banque (Stellantis Financial Services)
- 6.4.19 Axis Bank
- 6.4.20 Barclays
7 Market Opportunities & Future Outlook
- 7.1 White-Space & Unmet-Need Assessment

 印度汽車貸款:市場佔有率分析、產業趨勢與統計及成長預測(2026-2031)
 全球汽車金融市場規模、佔有率、趨勢和成長分析報告(2026-2034)
 人工智慧交通號誌管理市場預測至2034年:按解決方案、組件、技術、部署模式、最終用戶和區域分類的全球分析
 汽車金融市場:2026-2032年全球市場預測(依資金籌措方式、客戶類型、車輛類型、車輛狀況、信用評級、合約期限、驅動方式及通路分類)
 汽車金融市場分析及至2035年的預測:類型、產品類型、服務、技術、組件、應用、流程、部署狀態、最終用戶
 汽車金融市場規模、佔有率和成長分析:按交易類型、資金提供來源、車輛類型、金融工具類型、用途和地區分類-2026-2033年產業預測人工智慧驅動的交通預測市場預測至2034年:全球分析(按組件、技術、部署模式、資料來源、應用、最終用戶和地區分類)
 汽車金融市場-全球產業規模、佔有率、趨勢、機會與預測:按車輛類型、供應商、地區和競爭對手分類,2021-2031年汽車金融市場預測至2034年-全球分析(按提供者、用途、融資方式、資金來源、服務、車輛類型和地區分類)汽車金融市場規模、佔有率、成長及全球產業分析:按類型、應用和地區分類的洞察,2026-2034 年預測