


 |
市場調查報告書
商品編碼
2119733
工業邊緣運算:市場佔有率分析、產業趨勢與統計及成長預測(2026-2031 年)Industrial Edge Computing - Market Share Analysis, Industry Trends & Statistics, Growth Forecasts (2026 - 2031) |
||||||

※ 本網頁內容可能與最新版本有所差異。詳細情況請與我們聯繫。
根據 Mordor Intelligence 預測,工業邊緣運算市場規模將從 2025 年的 544.6 億美元成長到 2026 年的 616.7 億美元,然後在 2031 年達到 1148.7 億美元,2026 年至 2031 年的複合年成長率為 13.24%。
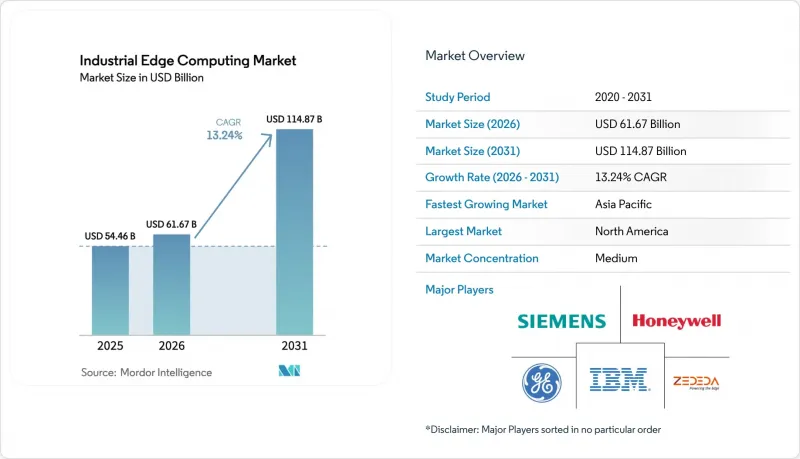
本報告按組件(硬體、軟體和平台、服務)、終端用戶產業(製造業、石油和天然氣等)、應用(預測性維護、品質檢測和機器視覺等)、部署模式(本地邊緣設備、與網路設備整合的邊緣等)以及地區進行細分。市場預測以美元(USD)為單位。
全球工業邊緣運算市場趨勢與洞察
工業物聯網感測器和工廠自動化的快速普及
企業正在將數百萬個感測器安裝在機器、輸送機和設備上,由此產生的大量遙測資料在遠端處理時會嚴重超出回程傳輸。邊緣節點透過在工廠內部執行即時過濾和分析來緩解這一瓶頸。特別是離散製造企業,對微秒的延遲非常敏感,這推動了邊緣節點在汽車、電子和包裝生產線上的應用。這種趨勢具有自我強化作用,每增加一個感測器,資料交換就會增加,對本地運算的需求也會隨之成長。隨著用於最佳化的AI模型與控制器並肩運行,邊緣平台正從可選的附加元件演變為核心基礎設施。
低延遲分析技術在智慧製造領域的快速普及
智慧製造先導計畫已證明,幾毫秒的差異就能造成數百萬美元的損失。埃克森美孚的開放式流程測試平台透過將分析處理轉移到邊緣,將循環時間從 15 秒縮短至約 40 毫秒。這種更快的回饋有助於防止品質偏差,並減少化學和金屬等連續製造業的廢棄物。企業通常會先監控較不重要的資產,然後在可靠性得到驗證後再轉向關鍵任務循環。基於視覺的檢測是關鍵促進因素,因為攝影機影像擷取和糾正措施之間的延遲會導致缺陷擴散到整個生產線。
邊緣整合中OT和IT之間的技能差距
有效實施需要精通工業協議、網路安全和雲端原生技術棧的專家,但只有不到15%的工程師具備所有這些技能。這種人才短缺導致專案延期和諮詢成本飆升。小規模工廠受到的影響更大,它們通常會推遲項目,直到整合商能夠提供承包解決方案。雖然認證專案正在興起,但人才培養速度落後於技術應用,這種技能差距是工業邊緣運算市場中期發展的瓶頸。
細分市場分析
到2025年,硬體銷售額將佔總銷售額的45.02%,因為工廠將投資閘道器、視覺加速器以及能夠承受振動、灰塵和溫度波動的高效能伺服器。這些採購構成了目前工業邊緣運算市場的基礎,確保了生產線附近系統的確定性性能。同時,軟體和平台產品正以13.95%的複合年成長率快速成長,因為它們能夠將工作負載與專用硬體解耦。企業現在可以在託管PLC的相同節點上安裝數位孿生微服務,然後透過集中式註冊表將其重新部署到其他工廠。基於訂閱的定價模式也與營運預算相符,從而為財務部門帶來可預測的支出曲線。
隨著容器運作時在控制硬體上的普及,設備和應用程式之間的界限正變得模糊。 Softing Industrial 的 2025 OPC UA 擴充(支援 60 多種配套模型)展示了標準化資訊模型如何提升軟體價值。隨著編配的日益成熟,買家越來越重視平台柔軟性和自動化生命週期,而非處理器數量。服務目前仍佔最小佔有率,但整合合作夥伴透過將分散式資產連接到統一的管理平台,正在影響採購決策。
到2025年,製造業將佔全球整體支出的42.10%。這主要歸功於工業4.0的早期採用者對機器人和製程控制中微秒決策循環的需求。工業邊緣運算市場在汽車沖壓生產線上受到顯著影響,因為停機成本可能超過每分鐘25,000美元。然而,運輸和物流行業成長最快,複合年成長率達13.96%,這主要得益於車隊遠端資訊處理、終端自動化以及需要在倉庫進行計算處理的自動駕駛車輛。石油和天然氣行業仍然是一個龐大的市場,因為該行業存在大量偏遠油田資產,衛星通訊延遲在這些地區是不可接受的。
在生命科學領域,隨著FDA指南的推薦,採用能夠確保批次級可追溯性的先進製造技術正在加速普及。在採礦、金屬和公共產業,邊緣分析技術正被應用於諸如保障工人安全和電網穩定性等場景。食品飲料工廠正在實施即時視覺檢測,以符合嚴格的標籤和過敏原法規。在各個行業,降低延遲、合規性報告和節能等優勢正成為商業案例中的決定性因素,從而擴大了工業邊緣運算產業的潛在基本客群。
區域分析
預計到2025年,北美市場佔有率將達到39.45%,這主要得益於多種因素的共同推動:私有5G的早期應用、健全的網路保險框架以及促進本地分析的企業永續發展目標。像埃克森美孚這樣的跨國公司正在展示融合傳統資料中心系統(DCS)和容器化微服務的開放式架構的有效性,從而鞏固客戶信任。目前,收入成長正從旗艦先導計畫轉向中型工廠對現有棕地生產線的現代化改造,這表明工業邊緣運算市場正在超越早期採用者群體,不斷擴張。
亞太地區以13.62%的複合年成長率領跑,主要得益於中國的「中國製造2025」計畫和日本的「社會責任5.0」願景。待開發區建廠從初始設計階段就開始整合前沿功能,以避免維修帶來的瓶頸。永續發展掛鉤融資通常提供低20至30個基點的利率,並重視透過本地分析實現的即時能源最佳化。該地區以出口主導的製造商將零延遲的品管視為在全球供應鏈中脫穎而出的戰略優勢。
由於採用IEC 62443網路安全要求和基於GDPR的資料本地化規則(這些規則優先考慮本地處理),歐洲繼續發揮重要作用。汽車和食品製造商主導,並得到了「地平線」計畫的支持,該計畫為試點部署提供津貼。同時,南美的礦場和中東的油田正在部署強大的邊緣節點,以減少遠端資產的意外停機時間,這表明工業邊緣運算市場正在各種不同的經濟環境中不斷擴展。
其他好處:
- Excel格式的市場預測(ME)表
- 3個月的分析師支持
目錄
第1章:引言
- 研究假設和市場定義
- 調查範圍
第2章:調查方法
第3章執行摘要
第4章 市場狀況
- 市場概覽
- 市場促進因素
- 工業物聯網感測器和工廠自動化的快速普及
- 智慧製造中低延遲分析技術的快速應用
- 部署專用5G工業網路
- 在現有OT網路設備上容器化工作負載
- 針對本地邊緣分析的網路保險折扣
- 永續發展掛鉤融資支持區域能源最佳化
- 市場限制因素
- OT-IT在邊緣整合方面的技能差距
- 硬體初始安裝成本高,後續維修成本也高。
- 中介軟體標準的碎片化阻礙了可移植性。
- 長期承擔應用安全補丁的義務正在推高總擁有成本。
- 產業價值鏈分析
- 監理情勢
- 技術展望
- 波特五力分析
第5章 市場規模與成長預測
- 按組件
- 硬體
- 軟體平台
- 服務
- 按最終用戶行業分類
- 製造業
- 石油和天然氣
- 採礦和金屬
- 公共產業和能源
- 運輸/物流
- 製藥和生命科學
- 食品/飲料
- 其他終端用戶產業
- 透過使用
- 預測性保護
- 品質檢測和機器視覺
- 即時過程最佳化
- 遠端資產監控
- 安全與合規性分析
- 邊緣人工智慧視覺分析
- 按部署模式
- 本地邊緣設備
- 網路設備上的整合邊緣
- 託管邊緣平台即服務
- 工業邊緣微型資料中心
- 按地區
- 北美洲
- 南美洲
- 歐洲
- 亞太地區
- 中東和非洲
第6章 競爭情勢
- 市場集中度
- 策略趨勢
- 市佔率分析
- 公司簡介
- International Business Machines Corporation
- Rockwell Automation, Inc.
- Siemens AG
- General Electric Company
- Honeywell International Inc.
- Huawei Technologies Co., Ltd.
- Microsoft Corporation
- SAP SE
- Intel Corporation
- Cisco Systems, Inc.
- Hewlett Packard Enterprise Company
- Dell Technologies Inc.
- Amazon Web Services, Inc.
- Schneider Electric SE
- Nokia Corporation
- Advantech Co., Ltd.
- ABB Ltd.
- Emerson Electric Co.
- Mitsubishi Electric Corporation
- Bosch Rexroth AG
- Foghorn Systems, Inc.
- ZEDEDA
- PTC Inc.
- ClearBlade, Inc.
第7章 市場機會與未來展望
According to Mordor Intelligence, the industrial edge computing market size is expected to grow from USD 54.46 billion in 2025 to USD 61.67 billion in 2026 and is forecast to reach USD 114.87 billion by 2031 at 13.24% CAGR over 2026-2031.
This report is Segmented by Component (Hardware, Software and Platform, and Services), End-User Industry (Manufacturing, Oil and Gas, and More), Application (Predictive Maintenance, Quality Inspection and Machine Vision, and More), Deployment Model (On-Premises Edge Appliances, Integrated Edge On Network Equipment, and More), and Geography. The Market Forecasts are Provided in Terms of Value (USD).
Global Industrial Edge Computing Market Trends and Insights
Surge in IIoT-sensor deployments and factory automation
Enterprises are attaching millions of sensors to machines, conveyors, and utilities, generating torrents of telemetry that overwhelm cloud backhauls if processed remotely. Edge nodes eliminate that bottleneck by applying real-time filtering and analytics within the factory walls. Discrete manufacturers are particularly sensitive to microsecond delays, driving uptake among automotive, electronics, and packaging lines. The pattern reinforces itself: every new sensor multiplies data interactions, accelerating demand for local compute. As AI models for optimization run directly beside controllers, edge platforms shift from optional add-ons to core infrastructure.
Rapid adoption of low-latency analytics in smart manufacturing
Smart-manufacturing pilots show how milliseconds translate into millions of dollars. ExxonMobil's open-process testbed cut a 15-second loop to roughly 40 milliseconds by relocating analytics to the edge. Faster feedback prevents quality drift and reduces scrap in continuous industries such as chemicals and metals. Firms often start by monitoring noncritical assets, then migrate to mission-critical loops once confidence grows. Vision-based inspection is a prime catalyst because any lag between camera capture and corrective action lets defects propagate down the line.
OT-IT skills gap for edge integration
Effective deployment demands professionals fluent in industrial protocols, cybersecurity, and cloud-native stacks, yet fewer than 15% of engineers possess that mix. Hiring shortages extend project timelines and inflate consulting fees. Smaller plants feel the pinch more acutely, often postponing projects until integrators package turnkey offerings. Although certification programs are growing, workforce development lags technology rollout, keeping the skills gap a mid-term drag on the Industrial Edge Computing market.
Other drivers and restraints analyzed in the detailed report include:
- Roll-out of private-5G industrial networks
- Containerized workloads on existing OT network equipment
- High upfront hardware and retrofit costs
For complete list of drivers and restraints, kindly check the Table Of Contents.
Segment Analysis
Hardware captured 45.02% revenue in 2025 as factories invested in gateways, vision accelerators, and rugged servers able to withstand vibration, dust, and temperature swings. Those purchases anchor the current Industrial Edge Computing market, ensuring deterministic performance near production lines. Software and platform offerings, however, are scaling faster at a 13.95% CAGR because they decouple workloads from proprietary iron. Enterprises can now install a digital-twin microservice on the same node that hosts a PLC, then redeploy it to a different plant through a centralized registry. Subscription pricing also aligns with operating budgets, giving finance teams predictable expense curves.
The growing availability of container runtimes on control hardware blurs the boundary between device and application. Softing Industrial's 2025 OPC UA expansion, supporting more than 60 companion models, illustrates how standardized information models boost software value. As orchestration maturity improves, buyers increasingly weigh platform flexibility and lifecycle automation over processor counts. Services remain the smallest slice but influence purchasing decisions because integration partners tie disparate assets into a unified management plane.
Manufacturing held 42.10% of global spending in 2025 as early Industry 4.0 adopters sought microsecond decision loops for robotics and process control. The Industrial Edge Computing market resonates with this sector because downtime costs can exceed USD 25,000 per minute in automotive stamping lines. Yet transportation and logistics is climbing fastest at a 13.96% CAGR, propelled by fleet telematics, terminal automation, and autonomous yard vehicles requiring compute at depots. Oil and gas remain substantial due to remote field assets where satellite latency is prohibitive.
Life sciences plants are also accelerating deployments as FDA guidance endorses advanced manufacturing technologies that ensure lot-level traceability. Mining, metals, and utilities apply edge analytics to worker safety and grid-stability use cases. Food and beverage plants deploy real-time vision inspection to comply with stringent labeling and allergen regulations. While each vertical value offers latency reduction, compliance reporting, and energy savings that often tip the business case, broadening the Industrial Edge Computing industry's addressable base.
Complete Report Scope:
- By Component
- Hardware
- Software and Platform
- Services
- By End-user Industry
- Manufacturing
- Oil and Gas
- Mining and Metals
- Utilities and Energy
- Transportation and Logistics
- Pharmaceuticals and Life Sciences
- Food and Beverage
- Other End-user Industries
- By Application
- Predictive Maintenance
- Quality Inspection and Machine Vision
- Real-time Process Optimisation
- Remote Asset Monitoring
- Safety and Compliance Analytics
- Edge AI Vision Analytics
- By Deployment Model
- On-premise Edge Appliances
- Integrated Edge on Network Equipment
- Managed Edge Platform-as-a-Service
- Industrial Edge Micro-Data-Centers
- By Geography
- North America
- South America
- Europe
- Asia Pacific
- Middle East and Africa
Geography Analysis
North America's 39.45% 2025 share reflects a confluence of early private-5G adoption, robust cyber-insurance frameworks, and corporate sustainability targets that incentivize on-premise analytics. Multinationals like ExxonMobil validate open architectures that blend legacy DCS with containerized microservices, cementing customer trust. Revenue growth now tilts toward mid-sized plants modernizing brownfield lines rather than flagship pilots, extending the Industrial Edge Computing market beyond early adopters.
Asia Pacific records the fastest 13.62% CAGR, underscored by China's Made-in-China 2025 program and Japan's Society 5.0 vision. Greenfield factories integrate edge capabilities from initial design, bypassing retrofit bottlenecks. Sustainability-linked loans, often priced 20-30 basis points lower, reward real-time energy optimization achieved through local analytics. The region's export-driven manufacturers view latency-free quality control as a strategic differentiator in global supply chains.
Europe remains pivotal thanks to IEC 62443 cyber mandates and GDPR-driven data-locality rules that privilege on-premise processing. Automotive and food producers lead, supported by Horizon-funded research that subsidizes pilot deployments. Meanwhile, South American mines and Middle East oilfields deploy rugged edge nodes to cut unplanned downtime on remote assets, illustrating how the Industrial Edge Computing market scales across disparate economic environments.
- International Business Machines Corporation
- Rockwell Automation, Inc.
- Siemens AG
- General Electric Company
- Honeywell International Inc.
- Huawei Technologies Co., Ltd.
- Microsoft Corporation
- SAP SE
- Intel Corporation
- Cisco Systems, Inc.
- Hewlett Packard Enterprise Company
- Dell Technologies Inc.
- Amazon Web Services, Inc.
- Schneider Electric SE
- Nokia Corporation
- Advantech Co., Ltd.
- ABB Ltd.
- Emerson Electric Co.
- Mitsubishi Electric Corporation
- Bosch Rexroth AG
- Foghorn Systems, Inc.
- ZEDEDA
- PTC Inc.
- ClearBlade, Inc.
Additional Benefits:
- The market estimate (ME) sheet in Excel format
- 3 months of analyst support
TABLE OF CONTENTS
1 INTRODUCTION
- 1.1 Study Assumptions and Market Definition
- 1.2 Scope of the Study
2 RESEARCH METHODOLOGY
3 EXECUTIVE SUMMARY
4 MARKET LANDSCAPE
- 4.1 Market Overview
- 4.2 Market Drivers
- 4.2.1 Surge in IIoT-sensor deployments and factory automation
- 4.2.2 Rapid adoption of low-latency analytics in smart manufacturing
- 4.2.3 Roll-out of private-5G industrial networks
- 4.2.4 Containerized workloads on existing OT network equipment
- 4.2.5 Cyber-insurance discounts for on-premise edge analytics
- 4.2.6 Sustainability-linked financing favouring local energy optimisation
- 4.3 Market Restraints
- 4.3.1 OT-IT skills gap for edge integration
- 4.3.2 High upfront hardware and retro-fit costs
- 4.3.3 Fragmented middleware standards hindering portability
- 4.3.4 Long-term security-patch obligations raising TCO
- 4.4 Industry Value Chain Analysis
- 4.5 Regulatory Landscape
- 4.6 Technological Outlook
- 4.7 Porter's Five Forces Analysis
- 4.7.1 Bargaining Power of Buyers
- 4.7.2 Bargaining Power of Suppliers
- 4.7.3 Threat of New Entrants
- 4.7.4 Threat of Substitutes
- 4.7.5 Intensity of Competitive Rivalry
5 MARKET SIZE AND GROWTH FORECASTS (VALUE)
- 5.1 By Component
- 5.1.1 Hardware
- 5.1.2 Software and Platform
- 5.1.3 Services
- 5.2 By End-user Industry
- 5.2.1 Manufacturing
- 5.2.2 Oil and Gas
- 5.2.3 Mining and Metals
- 5.2.4 Utilities and Energy
- 5.2.5 Transportation and Logistics
- 5.2.6 Pharmaceuticals and Life Sciences
- 5.2.7 Food and Beverage
- 5.2.8 Other End-user Industries
- 5.3 By Application
- 5.3.1 Predictive Maintenance
- 5.3.2 Quality Inspection and Machine Vision
- 5.3.3 Real-time Process Optimisation
- 5.3.4 Remote Asset Monitoring
- 5.3.5 Safety and Compliance Analytics
- 5.3.6 Edge AI Vision Analytics
- 5.4 By Deployment Model
- 5.4.1 On-premise Edge Appliances
- 5.4.2 Integrated Edge on Network Equipment
- 5.4.3 Managed Edge Platform-as-a-Service
- 5.4.4 Industrial Edge Micro-Data-Centers
- 5.5 By Geography
- 5.5.1 North America
- 5.5.2 South America
- 5.5.3 Europe
- 5.5.4 Asia Pacific
- 5.5.5 Middle East and Africa
6 COMPETITIVE LANDSCAPE
- 6.1 Market Concentration
- 6.2 Strategic Moves
- 6.3 Market Share Analysis
- 6.4 Company Profiles (includes Global-level Overview, Market-level Overview, Core Segments, Financials as available, Strategic Information, Market Rank/Share, Products and Services, Recent Developments)
- 6.4.1 International Business Machines Corporation
- 6.4.2 Rockwell Automation, Inc.
- 6.4.3 Siemens AG
- 6.4.4 General Electric Company
- 6.4.5 Honeywell International Inc.
- 6.4.6 Huawei Technologies Co., Ltd.
- 6.4.7 Microsoft Corporation
- 6.4.8 SAP SE
- 6.4.9 Intel Corporation
- 6.4.10 Cisco Systems, Inc.
- 6.4.11 Hewlett Packard Enterprise Company
- 6.4.12 Dell Technologies Inc.
- 6.4.13 Amazon Web Services, Inc.
- 6.4.14 Schneider Electric SE
- 6.4.15 Nokia Corporation
- 6.4.16 Advantech Co., Ltd.
- 6.4.17 ABB Ltd.
- 6.4.18 Emerson Electric Co.
- 6.4.19 Mitsubishi Electric Corporation
- 6.4.20 Bosch Rexroth AG
- 6.4.21 Foghorn Systems, Inc.
- 6.4.22 ZEDEDA
- 6.4.23 PTC Inc.
- 6.4.24 ClearBlade, Inc.
7 MARKET OPPORTUNITIES AND FUTURE OUTLOOK
- 7.1 White-space and Unmet-need Assessment

 邊緣資料處理市場預測至2034年-按處理類型、邊緣基礎設施、資料類型、處理能力、最終使用者和地區分類的全球分析
 AI邊緣運算控制器市場:全球市場預測,2026-2032年
 電網邊緣智慧和邊緣運算市場:按組件、應用、部署、技術、最終用戶、國家和地區分類-全球產業分析、市場規模、市場佔有率和預測(2026-2033年)
 無人機邊緣運算市場規模、佔有率和趨勢分析報告:按組件、無人機類型、計算方法、應用、最終用途、地區和細分市場預測(2026-2033 年)電信邊緣運算市場預測至2034年-按組件、部署模式、網路世代、應用、最終用戶、產業和地區進行分析
 2026-2030年全球工業邊緣運算市場
 全球邊緣運算市場規模、佔有率、趨勢和成長分析報告(2026-2034)
 汽車邊緣運算:市場佔有率分析、產業趨勢與統計及成長預測(2026-2031 年)工業邊緣運算平台市場預測至2034年-按平台類型、部署模式、技術、應用、最終用戶和地區分類的全球分析網格邊緣運算市場預測至2034年—按組件、部署模式、應用、最終用戶和地區分類的全球分析