


 |
市場調查報告書
商品編碼
2119647
企業績效管理:市場佔有率分析、產業趨勢與統計、成長預測(2026-2031)Corporate Performance Management - Market Share Analysis, Industry Trends & Statistics, Growth Forecasts (2026 - 2031) |
||||||

※ 本網頁內容可能與最新版本有所差異。詳細情況請與我們聯繫。
根據 Mordor Intelligence 預測,企業績效管理市場規模預計將從 2025 年的 71.3 億美元成長到 2026 年的 75.8 億美元,然後從 2026 年到 2031 年以 6.31% 的複合年成長率成長,到 2031 年達到 102.9 億美元。
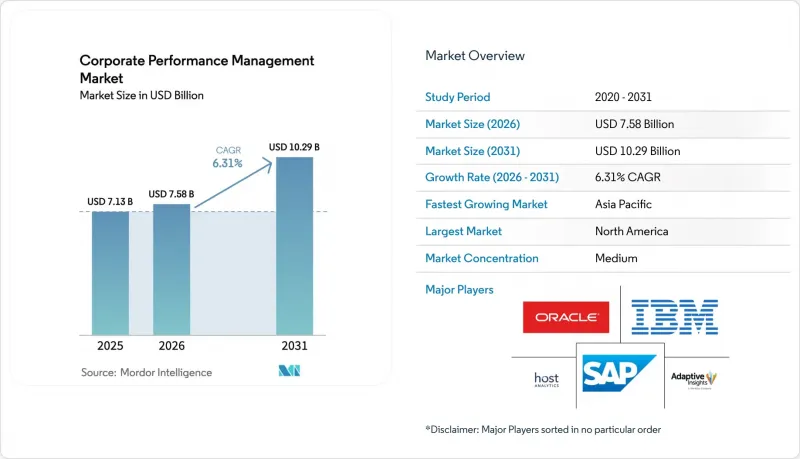
本報告按部署類型(本地部署、雲端部署、混合部署)、組織規模(中小企業、大型企業)、職能部門(財務、人力資源、供應鏈等)、最終用戶行業(銀行、金融服務和保險、零售和電子商務、製造業、醫療保健和公共產業等)以及地區進行細分。市場預測以美元計價。
全球企業績效管理 (CPM) 市場趨勢與洞察
擴大基於雲端的CPM平台的應用
向雲端遷移正在重塑實施成本結構,因為它消除了對本地基礎設施的需求,並實現了財務團隊之間的即時協作。到 2025 年,79% 的新型企業績效管理 (CPM) 系統將採用雲端原生架構,其中北美地區的採用率最高,其次是亞太地區,歐洲則相對落後。目前,68% 的用戶正在利用自助式規劃,從而減少對 IT 部門的依賴並縮短決策週期。供應商正在展示將 ERP 和 CPM 工作負載整合到統一雲端平台的價值,這可以降低延遲和營運成本。隨著採用率差距的擴大,專注於資料主權和低延遲雲端區域的供應商正在湧現尚未開發的市場。
更嚴格的監管和審計要求
隨著財務和非財務資訊揭露要求的趨同,從歐盟的《公司治理準則》(CSRD)到美國證券交易委員會(SEC)的增強型XBRL標籤,自動化資料處理歷程和可審計報告變得日益重要。資產管理公司現在需要用詳細的帳簿資訊來佐證其永續性聲明。支援雙重重要性評估和安全證據庫的整合式CPM套件正日益普及,而ISO認證的資料中心也成為必需品。無法實現自動化對帳的機構將面臨更高的合規成本和較慢的報告週期,這進一步增加了對相關平台的需求。
高昂的實施和整合成本
複雜的實施項目需要在軟體、整合和變更管理方面投入大量資金。涉及多個營業單位的專案通常需要 12 週到 2 年的時間,並需要跨職能團隊投入數百小時。整合超過 150 個舊版 ERP 系統會進一步增加專案範圍和預算。雖然雲端訂閱模式可以部分抵銷資本支出,但要實現完全的投資回報,需要嚴格的範圍界定、穩健的資料遷移和持續的用戶支援。
細分市場分析
到了2025年,雲端平台佔總營收的68.05%,鞏固其作為企業績效管理(CPM)市場領先交付模式的地位。預計到2031年,該細分市場將以8.07%的複合年成長率成長。在嚴格監管的行業中,利用雲端分析進行協作,同時將敏感工作負載保留在本地的混合模式仍然佔據主導地位。雲端驅動的企業績效管理市場規模在亞太地區成長最為迅速,該地區的採用率比歐洲高出25個百分點以上。持續更新、嵌入式人工智慧和更低的整體擁有成本正在推動這項轉型,而資料主權功能則緩解了歐洲的擔憂。為了贏得風險規避型客戶,供應商正專注於零停機發布和單一租戶安全性。本地部署仍能應對空氣間隙環境,但面臨預算縮減和升級週期延長的挑戰。目前,與競爭對手的差異化主要體現在雲端服務水準、可擴展性和整合人工智慧管道上,這正在加速傳統供應商的 SaaS藍圖。
在歐洲,資料本地化指令和保守的IT管理正在減緩雲端採用的步伐,為「直接遷移」和與主權雲端供應商建立供應商合作關係留出了空間。相較之下,北美和亞太地區的公司正迅速將整合、預算和情境規劃工作負載遷移到統一的雲端堆疊,從而實現一致的管治和快速創新。這些區域差異正在影響市場參與企業的產品在地化、定價和合作夥伴支援策略。
大型企業在2025年佔據了62.98%的收入佔有率,這主要是由於多幣種合併會計和嚴格的合規要求。然而,中小企業(SME)以7.74%的複合年成長率(CAGR)快速成長,正在推動企業績效管理(CPM)市場的進一步成長。雲端技術的成本效益、訂閱定價模式和現成的範本降低了進入門檻,幫助中小企業滿足正式的報告和融資要求。亞太地區針對微型、微企業(MSME)的數位轉型計畫以及資本市場上市程序的簡化,進一步刺激了市場需求。
中小企業 (SME) 優先考慮快速部署、基於 Office 的介面和最低限度的 IT 開銷,而大型企業則優先考慮擴充性和管治。供應商正透過分層版本、部署支援和產品內教學來滿足這一需求,將價值實現時間縮短至數週。同時,在更高層級,大型企業集團正在尋求整合平台來取代獨立解決方案,以增強資料一致性和應對力。這種兩極化導致了不同的藍圖。中小企業可以獲得直覺的使用者體驗 (UX) 和人工智慧驅動的配置輔助,而大型企業則可以獲得開放 API、沙盒環境和精細化的安全措施。
區域分析
到2025年,北美將以38.10%的市佔率佔據榜首。這得益於其成熟的企業軟體生態系統、豐富的部署人才以及在財務和營運領域對人工智慧的早期應用。企業正優先考慮整合人工智慧場景和合規自動化,這推動了供應商對區域資料中心和合作夥伴認證的投資。歐洲緊隨其後,其主要驅動力是多層級的ESG(環境、社會和治理)法規,這些法規要求在可信任平台上統一披露非財務和財務資訊。資料隱私義務和主權問題正在減緩雲端遷移的速度,但這有利於提供本地託管和強大加密功能的供應商。
亞太地區是成長最快的地區,複合年成長率達7.12%,這主要得益於政府對微企業數位化津貼、金融科技的擴張以及資本市場改革。預計到2030年,亞太地區中型企業的企業績效管理(CPM)市場規模將翻倍,因為當地系統整合商開始將CPM作為ERP實施的一部分。澳洲和日本的企業優先考慮環境、社會和治理(ESG)保障,而東南亞企業則在外匯波動的情況下專注於現金流預測。在南美洲,受上市公司改革和外資流入的推動,對現代規劃工具的需求不斷成長,應用也在穩步推進。在中東和非洲,受經濟多元化和國家願景計畫的推動,相關工具的初步應用正在推進,通常從預算編制開始,然後逐步增加分析功能。
其他好處:
- Excel格式的市場預測(ME)表
- 3個月的分析師支持
目錄
第1章:引言
- 研究假設和市場定義
- 調查範圍
第2章:調查方法
第3章執行摘要
第4章 市場狀況
- 市場概覽
- 市場促進因素
- 雲端CPM平台的普及應用日益廣泛
- 更嚴格的監管和審計要求
- 人工智慧/機器學習驅動的預測分析和處方分析
- 擴展 xPandA 以進行跨部門規劃
- 針對供應鏈中斷的持續情境規劃
- 將ESG資料整合到CPM儀表板中
- 市場限制因素
- 實施和整合相關的成本相對較高。
- 資料安全和隱私問題
- CPM/FPandA分析師短缺
- 來自非財務部門的文化阻力
- 產業價值鏈分析
- 監理情勢
- 技術展望
- 波特五力分析
- 產業相關人員分析
- 宏觀經濟變化評估
第5章 市場規模與成長預測
- 按實現類型
- 現場
- 基於雲端的
- 混合
- 按組織規模
- 中小企業
- 大公司
- 按功能
- 金融
- 人力資源
- 供應鏈
- 銷售與行銷
- 按最終用戶行業分類
- 銀行、金融服務和保險(BFSI)
- 零售與電子商務
- 製造業
- 醫學與生命科學
- 資訊科技/通訊
- 能源與公共產業
- 政府/公共部門
- 其他
- 按地區
- 北美洲
- 美國
- 加拿大
- 南美洲
- 巴西
- 阿根廷
- 其他南美國家
- 歐洲
- 德國
- 英國
- 法國
- 義大利
- 西班牙
- 其他歐洲國家
- 亞太地區
- 中國
- 日本
- 印度
- 韓國
- 其他亞太國家
- 中東
- 阿拉伯聯合大公國
- 沙烏地阿拉伯
- 其他中東國家
- 非洲
- 南非
- 其他非洲國家
- 北美洲
第6章 競爭情勢
- 市場集中度
- 策略趨勢
- 市佔率分析
- Vendor Positioning Analysis
- Investment Analysis
- 公司簡介
- Oracle Corporation
- SAP SE
- IBM Corporation
- Microsoft Corporation
- Workday, Inc.
- Anaplan, Inc.
- Wolters Kluwer NV(CCH Tagetik)
- OneStream Software LLC
- Infor, Inc.
- Planful, Inc.
- Prophix Software Inc.
- insightsoftware, Inc.
- Jedox AG
- Board International SA
- Unit4 NV
- Epicor Software Corporation
- SAS Institute Inc.
- Adaptive Insights LLC(Workday Adaptive Planning)
- Host Analytics Inc.
- Longview Solutions Inc.
- Vena Solutions Inc.
- Solver USA, Inc.
- insightsoftware-CXO Software
- BlackLine, Inc.
- Deltek, Inc.
第7章 市場機會與未來展望
According to Mordor Intelligence, the corporate performance management market size is expected to grow from USD 7.13 billion in 2025 to USD 7.58 billion in 2026 and is forecast to reach USD 10.29 billion by 2031 at 6.31% CAGR over 2026-2031.
This report is Segmented by Deployment Mode (On-Premises, Cloud-Based, and Hybrid), Organization Size (Small and Medium Enterprises, and Large Enterprises), Function (Finance, Human Resources, Supply Chain, and More), End-User Vertical (BFSI, Retail and E-Commerce, Manufacturing, Healthcare, Energy and Utilities, and More), and Geography. The Market Forecasts are Provided in Terms of Value (USD).
Global Corporate Performance Management Market Trends and Insights
Rising adoption of cloud-based CPM platforms
Cloud migration reshapes deployment economics by eliminating on-premises infrastructure and enabling real-time collaboration across finance teams. In 2025, 79% of new CPM implementations are cloud-native, with adoption highest in North America, followed closely by Asia-Pacific, while Europe trails. Self-service planning now involves 68% of users, reducing IT dependence and compressing decision cycles. Vendors demonstrate value by consolidating ERP and CPM workloads on unified clouds, cutting both latency and operating costs. The widening adoption gap opens geographic whitespace for providers specializing in data-sovereignty and low-latency cloud zones.
Tightening regulatory and audit requirements
Converging financial and non-financial disclosure mandates, from EU CSRD to enhanced SEC XBRL tagging, require automated data lineage and auditable reporting. Asset managers must now substantiate sustainability claims and align 10-K filings with granular ledger detail. Integrated CPM suites that support double-materiality assessments and secure evidence repositories gain favor, while ISO-certified data centers become table stakes. Organizations unable to automate reconciliations incur higher compliance cost and slower report cycles, reinforcing platform demand.
High implementation and integration costs
Complex rollouts demand sizeable investments in software, integration, and change management. Multi-entity projects often span 12 weeks to 2 years, with cross-functional teams dedicating hundreds of hours. Connecting 150-plus legacy ERP systems magnifies scope and budget. Cloud subscription models partially offset capital outlay, yet full ROI depends on disciplined scope, robust data migration, and ongoing user enablement.
Other drivers and restraints analyzed in the detailed report include:
- AI/ML-driven predictive and prescriptive analytics
- Expansion of xPandA for cross-functional planning
- Data-security and privacy concerns
For complete list of drivers and restraints, kindly check the Table Of Contents.
Segment Analysis
Cloud platforms accounted for 68.05% of 2025 revenue, confirming their position as the primary delivery model for the Corporate Performance Management market. This segment is projected to post an 8.07% CAGR through 2031. Hybrid models persist in heavily regulated sectors that retain sensitive workloads on-premises yet tap cloud analytics for collaboration. The Corporate Performance Management market size attributed to cloud is widening fastest in Asia-Pacific, where adoption outpaces Europe by more than 25 percentage points. Continuous updates, embedded AI, and lower total cost propel conversions, while data-sovereignty features ease European concerns. Providers emphasize zero-downtime releases and single-tenant security to win risk-averse clients. On-premises deployments still serve air-gapped environments but face shrinking budgets and lengthier upgrade cycles. Competitive differentiation now pivots on cloud service level, scalability, and integrated AI pipelines, prompting legacy vendors to accelerate SaaS roadmaps.
In Europe, slower cloud uptake stems from data-localization directives and conservative IT governance, leaving room for lift-and-shift initiatives and vendor partnerships with sovereign-cloud providers. North American and Asia-Pacific enterprises, by contrast, expedite migration of consolidation, budgeting, and scenario planning workloads to unified cloud stacks, enabling cohesive governance and faster innovation. This regional divergence shapes product localization, pricing, and partner enablement strategies among market participants.
Large enterprises retained 62.98% of 2025 revenue, primarily due to multi-currency consolidation and stringent compliance needs. However, SMEs, the fastest-growing cohort at 7.74% CAGR, propel incremental gains in the Corporate Performance Management market. Cloud affordability, subscription pricing, and prebuilt templates decrease barriers, helping SMEs satisfy formal reporting and lending requirements. Asia-Pacific MSME digitalization programs and simplified capital-market listings further stimulate demand.
SMEs prioritize rapid deployment, Office-based interfaces, and minimal IT overhead, contrasting with enterprise preferences for extensibility and governance. Vendors respond with tiered editions, guided implementations, and in-product tutorials that compress time-to-value to weeks. At the upper end, conglomerates seek unified platforms to replace point solutions, enhancing data consistency and audit readiness. This bifurcation drives differentiated roadmaps: intuitive UX and AI-guided configuration for SMEs, versus open APIs, sandbox environments, and fine-grained security for large enterprises.
Complete Report Scope:
- By Deployment Mode
- On-Premises
- Cloud-Based
- Hybrid
- By Organization Size
- Small and Medium Enterprises (SMEs)
- Large Enterprises
- By Function
- Finance
- Human Resources
- Supply Chain
- Sales and Marketing
- By End-user Vertical
- Banking, Financial Services and Insurance (BFSI)
- Retail and E-commerce
- Manufacturing
- Healthcare and Life Sciences
- IT and Telecommunications
- Energy and Utilities
- Government and Public Sector
- Other End-user Verticals
- By Geography
- North America
- United States
- Canada
- South America
- Brazil
- Argentina
- Rest of South America
- Europe
- Germany
- United Kingdom
- France
- Italy
- Spain
- Rest of Europe
- Asia-Pacific
- China
- Japan
- India
- South Korea
- Rest of Asia-Pacific
- Middle East
- United Arab Emirates
- Saudi Arabia
- Rest of Middle East
- Africa
- South Africa
- Rest of Africa
- North America
Geography Analysis
North America led with a 38.10% share in 2025, underpinned by mature enterprise-software ecosystems, deep implementation talent, and early AI adoption across finance and operations. Enterprises prioritize integrated AI scenarios and compliance automation, reinforcing vendor investment in regional data centers and partner certification. Europe follows, driven by multi-layered ESG mandates that demand unified non-financial and financial disclosures within trusted platforms. Data-privacy obligations and sovereignty concerns slow cloud conversion but favor providers offering in-region hosting and robust encryption.
Asia-Pacific is the fastest-growing geography at 7.12% CAGR, fueled by government-backed MSME digitization grants, fintech expansion, and capital-market reforms. The Corporate Performance Management market size across Asia-Pacific mid-market firms is projected to double by 2030 as local integrators bundle CPM with ERP rollouts. Australian and Japanese enterprises emphasize ESG assurance, while Southeast Asian companies focus on cash-flow forecasting amid currency volatility. South America exhibits a steady uptake as public company reforms and foreign investment inflows demand modern planning tools. In the Middle East and Africa, economic diversification and national vision programs trigger initial deployments, often starting with budgeting and gradually layering analytics.
- Oracle Corporation
- SAP SE
- IBM Corporation
- Microsoft Corporation
- Workday, Inc.
- Anaplan, Inc.
- Wolters Kluwer N.V. (CCH Tagetik)
- OneStream Software LLC
- Infor, Inc.
- Planful, Inc.
- Prophix Software Inc.
- insightsoftware, Inc.
- Jedox AG
- Board International S.A.
- Unit4 N.V.
- Epicor Software Corporation
- SAS Institute Inc.
- Adaptive Insights LLC (Workday Adaptive Planning)
- Host Analytics Inc.
- Longview Solutions Inc.
- Vena Solutions Inc.
- Solver USA, Inc.
- insightsoftware-CXO Software
- BlackLine, Inc.
- Deltek, Inc.
Additional Benefits:
- The market estimate (ME) sheet in Excel format
- 3 months of analyst support
TABLE OF CONTENTS
1 INTRODUCTION
- 1.1 Study Assumptions and Market Definition
- 1.2 Scope of the Study
2 RESEARCH METHODOLOGY
3 EXECUTIVE SUMMARY
4 MARKET LANDSCAPE
- 4.1 Market Overview
- 4.2 Market Drivers
- 4.2.1 Rising adoption of cloud-based CPM platforms
- 4.2.2 Tightening regulatory and audit requirements
- 4.2.3 AI/ML-driven predictive and prescriptive analytics
- 4.2.4 Expansion of xPandA for cross-functional planning
- 4.2.5 Continuous scenario planning for supply-chain shocks
- 4.2.6 ESG data integration into CPM dashboards
- 4.3 Market Restraints
- 4.3.1 High implementation and integration costs
- 4.3.2 Data-security and privacy concerns
- 4.3.3 Shortage of CPM/FPandA analytics talent
- 4.3.4 Cultural resistance from non-finance functions
- 4.4 Industry Value Chain Analysis
- 4.5 Regulatory Landscape
- 4.6 Technological Outlook
- 4.7 Porter's Five Forces Analysis
- 4.7.1 Bargaining Power of Suppliers
- 4.7.2 Bargaining Power of Buyers
- 4.7.3 Threat of New Entrants
- 4.7.4 Threat of Substitutes
- 4.7.5 Intensity of Competitive Rivalry
- 4.8 Industry Stakeholder Analysis
- 4.9 Assessment of Macro-Economic Changes
5 MARKET SIZE AND GROWTH FORECASTS (VALUE)
- 5.1 By Deployment Mode
- 5.1.1 On-Premises
- 5.1.2 Cloud-Based
- 5.1.3 Hybrid
- 5.2 By Organization Size
- 5.2.1 Small and Medium Enterprises (SMEs)
- 5.2.2 Large Enterprises
- 5.3 By Function
- 5.3.1 Finance
- 5.3.2 Human Resources
- 5.3.3 Supply Chain
- 5.3.4 Sales and Marketing
- 5.4 By End-user Vertical
- 5.4.1 Banking, Financial Services and Insurance (BFSI)
- 5.4.2 Retail and E-commerce
- 5.4.3 Manufacturing
- 5.4.4 Healthcare and Life Sciences
- 5.4.5 IT and Telecommunications
- 5.4.6 Energy and Utilities
- 5.4.7 Government and Public Sector
- 5.4.8 Other End-user Verticals
- 5.5 By Geography
- 5.5.1 North America
- 5.5.1.1 United States
- 5.5.1.2 Canada
- 5.5.2 South America
- 5.5.2.1 Brazil
- 5.5.2.2 Argentina
- 5.5.2.3 Rest of South America
- 5.5.3 Europe
- 5.5.3.1 Germany
- 5.5.3.2 United Kingdom
- 5.5.3.3 France
- 5.5.3.4 Italy
- 5.5.3.5 Spain
- 5.5.3.6 Rest of Europe
- 5.5.4 Asia-Pacific
- 5.5.4.1 China
- 5.5.4.2 Japan
- 5.5.4.3 India
- 5.5.4.4 South Korea
- 5.5.4.5 Rest of Asia-Pacific
- 5.5.5 Middle East
- 5.5.5.1 United Arab Emirates
- 5.5.5.2 Saudi Arabia
- 5.5.5.3 Rest of Middle East
- 5.5.6 Africa
- 5.5.6.1 South Africa
- 5.5.6.2 Rest of Africa
- 5.5.1 North America
6 COMPETITIVE LANDSCAPE
- 6.1 Market Concentration
- 6.2 Strategic Moves
- 6.3 Market Share Analysis
- 6.4 Vendor Positioning Analysis
- 6.5 Investment Analysis
- 6.6 Company Profiles (includes Global-level Overview, Market-level Overview, Core Segments, Financials, Strategic Information, Market Rank/Share, Products and Services, Recent Developments)
- 6.6.1 Oracle Corporation
- 6.6.2 SAP SE
- 6.6.3 IBM Corporation
- 6.6.4 Microsoft Corporation
- 6.6.5 Workday, Inc.
- 6.6.6 Anaplan, Inc.
- 6.6.7 Wolters Kluwer N.V. (CCH Tagetik)
- 6.6.8 OneStream Software LLC
- 6.6.9 Infor, Inc.
- 6.6.10 Planful, Inc.
- 6.6.11 Prophix Software Inc.
- 6.6.12 insightsoftware, Inc.
- 6.6.13 Jedox AG
- 6.6.14 Board International S.A.
- 6.6.15 Unit4 N.V.
- 6.6.16 Epicor Software Corporation
- 6.6.17 SAS Institute Inc.
- 6.6.18 Adaptive Insights LLC (Workday Adaptive Planning)
- 6.6.19 Host Analytics Inc.
- 6.6.20 Longview Solutions Inc.
- 6.6.21 Vena Solutions Inc.
- 6.6.22 Solver USA, Inc.
- 6.6.23 insightsoftware-CXO Software
- 6.6.24 BlackLine, Inc.
- 6.6.25 Deltek, Inc.
7 MARKET OPPORTUNITIES AND FUTURE OUTLOOK
- 7.1 White-space and Unmet-need Assessment

 PPP專案績效管理軟體市場:全球市場預測,2026-2032年財務績效管理軟體市場:全球市場預測,2026-2032年
 2026-2030年全球企業績效管理(CPM)軟體市場
 2026-2030年全球企業績效管理(EPM)應用市場
 企業績效管理:市場佔有率分析、產業趨勢與統計、成長預測(2026-2031)企業績效管理市場-2026-2032年全球市場預測
 企業績效管理 (EPM) 市場預測 2034 年-按解決方案類型、部署模式、組件、應用、企業規模和地區分類的全球分析
 企業績效管理 (EPM) 市場規模、佔有率和成長分析:按組件、部署類型、企業規模、最終用戶和地區分類-2026-2033 年產業預測
 全球企業績效管理市場:機會與策略展望(至2035年)
 企業績效管理 (EPM) 市場分析及至 2035 年預測:按類型、產品類型、服務、技術、組件、應用、部署模式、最終用戶、模組和功能分類