


 |
市場調查報告書
商品編碼
2119395
海底電纜登陸站:市場佔有率分析、產業趨勢與統計、成長預測(2026-2031 年)Cable Landing Station - Market Share Analysis, Industry Trends & Statistics, Growth Forecasts (2026 - 2031) |
||||||

※ 本網頁內容可能與最新版本有所差異。詳細情況請與我們聯繫。
根據 Mordor Intelligence 預測,海底電纜登陸站的市場規模預計將在 2025 年達到 42.1 億美元,2026 年達到 44.8 億美元,到 2031 年達到 62.3 億美元,2026 年至 2031 年的複合年成長率為 6.82%。
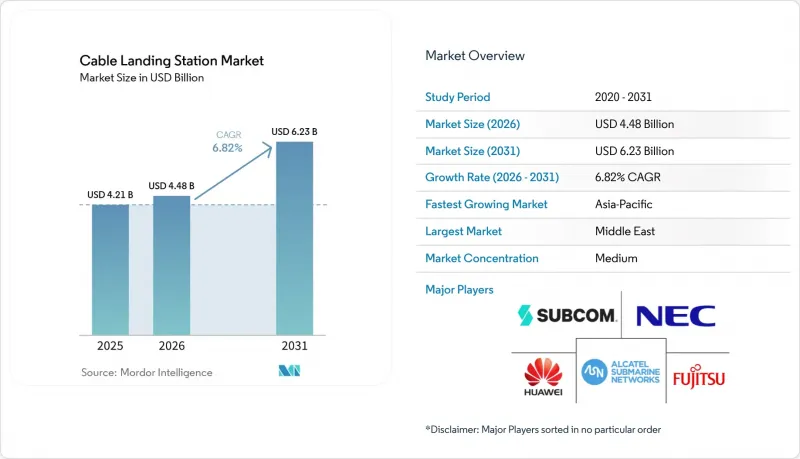
本報告按組件(電源設備、海底電纜終端設備、監控設備、保護設備等)、服務(升級和維修等)、應用(國際和島際互聯等)、所有權和經營模式(單一所有者系統等)以及地區進行細分。市場預測以美元計價。
全球海底電纜登陸站市場趨勢及洞察
雲端運算和人工智慧正在推動新的國際通訊能力。
人工智慧 (AI) 推理需要低延遲,並且需要在不同地點之間定期傳輸大規模模型檔案。預計 2025 年至 2035 年間,國際頻寬使用量將以每年 24% 的速度成長,因此需要持續投資於長途傳輸容量,而不是進行單一網路升級。隨著流量密度的增加,沿海設施光纖通訊監控的需求也在增加。營運商在擴展港口容量的同時,也需要可靠的電源、冷卻系統和回程傳輸線路。海底電纜登陸站市場受益匪淺,因為每條新線路都必須連接到一個可連接陸地網路的受保護站點。在雲區域需要跨越大西洋、太平洋和印度洋進行直接連接的地區,這種需求尤其顯著。
超大規模資料中心業者營運商對單一所有者海底電纜系統的投資
大型科技公司越來越傾向於選擇能夠自主掌控容量、路由和網路設計的方案。 Meta公司於2025年宣布的「沃特沃斯計畫」(Project Waterworth)就是一個例證,該計畫是一條由該公司擁有的、連接五大洲的5萬公里海底光纜系統。亞馬遜也在2025年宣布了「Fastnet」項目,這是一條連接馬裡蘭州和科克郡、容量超過320Terabit/秒的海底光纜。這些項目需要專用的光纖系統和能夠處理專用陸地連接的基地台。主機營運商可以透過協調專用系統內的電源供應、實體佈局和光纖配線架來獲得業務收益。這種所有權模式支援單一所有者部署的擴展,並有助於現有設施的維修。
沿海地區因授權和環境審查而造成的延誤
環境評估和地方政府批准可能會使海底電纜登陸工程延誤數年。每條線路都需要多個機構的批准,而商業運作可能取決於所有規劃的登陸點是否準備就緒。 2025年,美國眾議院通過了《海底電纜保護法案》,取消了《國家海洋安全區法案》下重疊的特殊用途許可要求。雖然這項法案針對的是具體的核准程序,但它並未取消更廣泛的沿海、環境和社區審查要求。即使系統的海洋部分已經完工,也可能因為某個登陸點尚未準備好而導致工程延誤。這種不確定性增加了海底電纜登陸站市場的發展風險,尤其是在審查程序嚴格的沿海地區。
細分市場分析
2025年,海底電纜終端設備(SMT)將佔據海底電纜登陸站市場佔有率的32.51%。這些設備在海底和陸地系統之間的流量轉換中發揮著至關重要的作用,是任何高容量電纜終端的核心。由於其關鍵作用,營運商在開發新的登陸站時總是需要大量的設備。諾基亞為孟加拉私人電纜系統項目提供了SMT,該項目總投資達1.5億美元。在選擇這些系統時,買家會評估容量、能耗、設備間的互通性和安全性。此外,光纖通訊標準的進步也要求對現有設備進行定期升級。
預計2026年至2031年間,監控設備市場將以7.46%的複合年成長率成長。隨著光纖對數和波長容量的增加,電信業者需要持續監控光纖效能。監控有助於在效能下降導致更嚴重的服務問題之前將其識別出來。電源和保護設備是登陸設施電氣和物理完整性的基礎。由於許多設施是在先前的光纖部署期間建造的,現有系統可能無法適應目前的連貫光技術。電訊(ITU)在2026年指出,不斷變化的環境壓力正在影響電纜和沿海基礎設施的容錯能力。這種更新需求將支撐在擴建階段和新建設放緩時期對組件的需求。這也為設備供應商提供了持續改進自動化、故障可見性、能源管理以及與新型光纖系統相容性的機會。站點所有者可以利用這些升級來延長受保護沿海設施的使用壽命,而無需重建整個站點。
2025年,「安裝試運行」服務在海底電纜登陸站市佔率中佔43.26%。該服務包括岸上連接、電纜敷設、光學對準、測試以及站點設備的最終整合。這些工作需要專業的工程技術,並與海底電纜安裝人員進行協調。計劃於2026年至2029年間投入營運的電纜總價值超過160億美元,為現有已鋪設的管網提供支援。 NEC公司擔任「Candle」系統的系統整合商,負責製造、線路設計、安裝和測試。承包工程合約降低了電纜所有者的協調風險,因為他們只需要一個負責的交付合作夥伴。
預計2026年至2031年間,升級和維修市場將以8.15%的複合年成長率成長。現有站點需要更大的光容量、更強的電源管理能力以及為大型科技公司擁有的專用系統預留空間。隨著營運商需要持續的效能監控,維護和支援合約的價值也隨之提升。在營運商中立站點,由於開發商必須為未來的佈線預留管道、電力容量和機架空間,設計和工程變得越來越複雜。採用模組化建造可以減少新建設施所需的現場工作量。這些服務需求為海底電纜登陸站產業創造了商機,不僅來自新建登陸站,也來自運作中站點。了解當地施工法規和光纖通訊系統整合的服務供應商可以為客戶提供從設計和試運行到維護、擴展和事件回應的全程支援。這種廣泛的服務範圍在專業人員有限的地區至關重要。
區域分析
2025年,亞太地區佔據了海底光纜登陸站市場38.63%的佔有率。該地區擁有龐大的網路使用者群體、亞洲內部高密度的網路流量以及重要的跨太平洋線路。預計2026年至2029年間,亞洲新增海底光纜投資將超過37億美元。在日本的位置多元化計畫中,Softbank Corporation被選中於2025年在北海道和九州建造新的海底光纜登陸站。印度、中國、馬來西亞、印尼和菲律賓也是線路開發的重要來源。亞太地區海底光纜登陸站市場的發展得益於商業雲端需求和公共網路彈性提升計畫的推動。
預計中東地區在2026年至2031年間將以8.37%的複合年成長率成長。其作為中轉區域的地位得益於其位於亞洲、歐洲和非洲海底光纜線路的中點。 2025年,Mobilly公司在沙烏地阿拉伯杜拜完成了其「Africa-1」海底光纜的登陸。這條全長10,000公里的系統擁有8對光纖和11個登陸點。埃及在塞得港和拉斯加萊布為SEA-ME-WE-6海底光纜增設了登陸基礎設施。沿著紅海和地中海分佈的登陸點為處理東西向流量的營運商提供了更多線路選擇。在北美,超大規模資料中心業者營運商對專用設施的需求旺盛。亞馬遜選擇馬裡蘭州作為其Fastnet海底光纜的登陸點,該光纖將連接美國和愛爾蘭。
到2027年,歐洲計劃投資3.47億歐元(3.81億美元)用於海底電纜安全和優先項目。非洲可以受益於營運商中立的設施,從而降低跨大西洋線路的接入成本。南美洲有空間建造模組化設施,並建立與亞太地區的新連接。這些地區的海底電纜登陸站市場取決於當地的授權、電網接入、海岸安全以及容錯陸地回程傳輸。當地的開發條件與實際線路同等重要,因為只有在陸地站點和陸地鏈路建成後,電纜才能提供容量。儘早滿足這些要求的開發商可以降低海底建設開始後延誤的風險。
其他好處:
- Excel格式的市場預測(ME)表
- 3個月的分析師支持
目錄
第1章:引言
- 研究假設和市場定義
- 調查範圍
第2章:調查方法
第3章執行摘要
第4章 市場狀況
- 市場概覽
- 市場促進因素
- 雲端運算和人工智慧流量正在推動新的國際網路容量的擴張。
- 超大規模資料中心業者對單一所有者海底系統的投資
- 新興走廊中操作員中立著陸站的擴建
- 海上能源和島嶼間互聯互通的需求
- 國家數位主權和關鍵基礎設施支出
- 模組化和預製著陸站的部署
- 市場限制因素
- 沿海地區授權和環境評估的延誤
- 電纜維修船和專業人員的限制
- 著陸點集中化以及回程傳輸故障所帶來的風險。
- 網路安全和實體安全合規成本
- 宏觀經濟因素對市場的影響
- 產業生態系分析
- 監理情勢
- 技術展望
- 波特五力分析
第5章 市場規模與成長預測
- 按組件
- 電源設備
- 海底網路終端設備
- 監控設備
- 防護裝備
- 其他規則
- 按服務
- 設計與工程
- 安裝和試運行
- 維護和支援
- 升級和維修
- 透過使用
- 通訊及網際網路骨幹網
- 超大規模資料中心和資料中心互連
- 政府和國防部門的互聯互通
- 海上能源和工業互聯互通
- 國家間和島嶼間的聯繫
- 按所有權類型和經營模式
- 該系統由該財團擁有
- 單一所有者系統
- 中立承運人登陸隊模式
- 由政府和開發銀行支持的體系
- 按地區
- 北美洲
- 美國
- 加拿大
- 墨西哥
- 南美洲
- 巴西
- 阿根廷
- 智利
- 其他南美國家
- 歐洲
- 德國
- 英國
- 法國
- 義大利
- 西班牙
- 其他歐洲國家
- 亞太地區
- 中國
- 日本
- 印度
- 韓國
- 澳洲
- 其他亞太國家
- 中東
- 阿拉伯聯合大公國
- 沙烏地阿拉伯
- 卡達
- 其他中東國家
- 非洲
- 南非
- 埃及
- 奈及利亞
- 其他非洲國家
- 北美洲
第6章 競爭情勢
- 市場集中度
- 策略趨勢
- 市佔率分析
- 公司簡介
- Alcatel Submarine Networks SAS
- SubCom, LLC
- Huawei Marine Networks Co., Ltd.
- NEC Corporation
- Fujitsu Limited
- Nokia Corporation
- Ciena Corporation
- Xtera Limited
- Global Marine Systems Limited
- Prysmian SpA
- Nexans SA
- Sumitomo Electric Industries, Ltd.
- Hengtong Optic-Electric Co., Ltd.
- ZTT International Limited
- LS Cable & System Ltd.
- TE Connectivity Ltd.
- Corning Incorporated
- Infinera Corporation
- ZTE Corporation
- Elettra Tlc SpA
第7章 市場機會與未來展望
According to Mordor Intelligence, the cable landing station market size is projected to be USD 4.21 billion in 2025, USD 4.48 billion in 2026, and reach USD 6.23 billion by 2031, growing at a CAGR of 6.82% from 2026 to 2031.
This report is Segmented by Component (Power Feeding Equipment, Submarine Line Terminal Equipment, Monitoring and Control Equipment, Protection Equipment, and More), Service (Upgrades and Retrofits, and More), Application (Inter-Country and Island Connection, and More), Ownership and Business Model (Single-Owner Systems, and More), and Geography. The Market Forecasts are Provided in Terms of Value (USD).
Global Cable Landing Station Market Trends and Insights
Cloud and AI Traffic Driving New International Capacity
Artificial intelligence inference requires low latency and recurring transfers of large model files between locations. Used international bandwidth is projected to grow at a 24% annual rate from 2025 through 2035, which requires continued investment in long-haul capacity rather than isolated network upgrades. Higher traffic density raises the need for optical monitoring at coastal facilities. Operators also need dependable power, cooling, and backhaul links when they increase port capacity. The cable landing station market benefits because each new route must connect to a protected site with terrestrial network access. Demand is especially relevant where cloud regions need direct links across the Atlantic, Pacific, and Indian Ocean basins.
Hyperscaler Investment in Single-Owner Submarine Systems
Large technology companies increasingly favor routes that give them control over capacity, routing, and network design. Meta announced Project Waterworth in 2025 as a 50,000-km, five-continent cable system that it would own, which illustrates this direction. Amazon announced Fastnet in 2025, a cable linking Maryland and County Cork with more than 320 terabits per second of capacity. These projects require stations capable of accommodating private optical systems and dedicated terrestrial connections. Host operators can capture service revenue by modifying power, physical layout, and optical distribution frames in private systems. This ownership model supports growth in single-owner deployments and in retrofit work at existing facilities.
Coastal Permitting and Environmental Review Delays
Environmental review and local approvals can delay a cable landing project for years. Each route requires approvals from multiple authorities, and its commercial operation may depend on all planned landing points being ready. The United States House of Representatives passed the Undersea Cable Protection Act in 2025 to remove a duplicative special-use permit requirement under the National Marine Sanctuary Act. The measure addresses a specific approval step but does not remove broader coastal, environmental, and community review requirements. Delays can leave completed marine portions of a system waiting for a single unready site. This uncertainty increases development risk for the cable landing station market, particularly in coastal areas with strict review processes.
Other drivers and restraints analyzed in the detailed report include:
- National Digital Sovereignty and Critical Infrastructure Spending
- Carrier-Neutral Landing Station Expansion in Emerging Corridors
- Cybersecurity and Physical-Security Compliance Costs
For complete list of drivers and restraints, kindly check the Table Of Contents.
Segment Analysis
Submarine Line Terminal Equipment held 32.51% of the cable landing station market share in 2025. It converts traffic between submarine and terrestrial systems, making it central to every high-capacity cable termination. Its role results in a significant equipment requirement whenever operators develop a new landing point. Nokia supplied Submarine Line Terminal Equipment for the Bangladesh Private Cable System, a project with a total investment of USD 150 million. Buyers assess capacity, energy use, equipment interoperability, and security when they select these systems. The installed base also requires periodic replacement as optical standards advance.
Monitoring and Control Equipment is projected to expand at a 7.46% CAGR from 2026 to 2031. Operators need continuous visibility into optical performance as fiber-pair counts and wavelength capacity rise. Monitoring can identify degraded performance before it creates a larger service issue. Power Feeding Equipment and Protection Equipment support the electrical and physical integrity of the landing installation. Many facilities date from earlier fiber deployments, so existing systems may not have been designed for current coherent optical technologies. The International Telecommunication Union noted in 2026 that changing environmental pressures affect the resilience of cables and coastal infrastructure. This replacement need supports component demand during both expansion and slower new-build periods. It also gives equipment suppliers recurring opportunities to improve automation, fault visibility, energy management, and compatibility with new optical systems. Station owners can use these upgrades to extend the useful life of protected coastal facilities without rebuilding the entire site.
Installation and Commissioning held 43.26% of the cable landing station market share in 2025. The service includes beach-joint work, cable burial, optical alignment, testing, and the final integration of station equipment. These activities require specialized engineering and coordination with the marine cable contractor. Cables due to enter service from 2026 to 2029 exceed USD 16 billion in value, supporting the current installation pipeline. NEC served as system integrator for the Candle system, covering manufacturing, route design, installation, and testing. Turnkey contracts can reduce coordination risk for cable owners who need a single accountable delivery partner.
Upgrades and Retrofits are projected to expand at a 8.15% CAGR from 2026 to 2031. Existing sites need more optical capacity, additional power management, and room for private systems owned by large technology companies. Maintenance and Support contracts also become more valuable when operators require continuous performance oversight. Design and engineering are becoming more complex at carrier-neutral sites because developers must reserve conduits, power capacity, and frame space for future cables. Modular construction can shorten the on-site work required for a new facility. These service needs allow the cable landing station industry to generate activity from operating sites as well as from new landings. Service providers that understand local construction rules and optical integration can support customers throughout design, commissioning, maintenance, expansion, and incident response. That broader service role can be important in regions with limited specialist capacity.
Complete Report Scope:
- By Component
- Power Feeding Equipment
- Submarine Line Terminal Equipment
- Monitoring and Control Equipment
- Protection Equipment
- Other Components
- By Service
- Design and Engineering
- Installation and Commissioning
- Maintenance and Support
- Upgrades and Retrofits
- By Application
- Telecommunications and Internet Backbone
- Hyperscale and Data Center Interconnection
- Government and Defense Connectivity
- Offshore Energy and Industrial Connectivity
- Inter-Country and Island Connection
- By Ownership and Business Model
- Consortium-Owned Systems
- Single-Owner Systems
- Carrier-Neutral Landing-Party Model
- Government and Development-Bank-Backed Systems
- By Geography
- North America
- United States
- Canada
- Mexico
- South America
- Brazil
- Argentina
- Chile
- Rest of South America
- Europe
- Germany
- United Kingdom
- France
- Italy
- Spain
- Rest of Europe
- Asia-Pacific
- China
- Japan
- India
- South Korea
- Australia
- Rest of Asia-Pacific
- Middle East
- United Arab Emirates
- Saudi Arabia
- Qatar
- Rest of Middle East
- Africa
- South Africa
- Egypt
- Nigeria
- Rest of Africa
- North America
Geography Analysis
Asia-Pacific held 38.63% of the cable landing station market share in 2025. The region combines large internet populations, dense intra-Asian traffic, and major transpacific routes. New Asian cable investment is expected to exceed USD 3.7 billion during 2026-2029. Japan's location-diversification program selected SoftBank to establish new cable landing stations in Hokkaido and Kyushu in 2025. India, China, Malaysia, Indonesia, and the Philippines provide additional sources of route development. The cable landing station market in Asia-Pacific is supported by commercial cloud demand and public resilience programs.
The Middle East is projected to expand at a 8.37% CAGR from 2026 to 2031. Its location between Asian, European, and African cable routes supports its role as a transit region. Mobily landed the Africa-1 cable in Dubai, Saudi Arabia, in 2025. The 10,000-km system has 8 fiber pairs and 11 landing points. Egypt added SEA-ME-WE-6 landing infrastructure at Port Said and Ras Ghareb. Diversified sites along the Red Sea and Mediterranean improve route options for operators serving east-west traffic. North America reflects demand for private facilities used by hyperscalers. Amazon selected a Maryland landing location for Fastnet, while its cable will connect the United States and Ireland.
Europe is directing EUR 347 million (USD 381 million) toward cable security and priority projects through 2027. Africa can gain from carrier-neutral facilities that lower the cost of entering Atlantic routes. South America has scope for modular installations and new links to Asia-Pacific. The cable landing station market across these regions depends on local permitting, grid access, coastal security, and resilient terrestrial backhaul. Local development conditions can be as important as the physical route because a cable cannot deliver capacity until its station and terrestrial links are ready. Developers that secure these requirements early can reduce the risk of delays after marine construction begins.
- Alcatel Submarine Networks SAS
- SubCom, LLC
- Huawei Marine Networks Co., Ltd.
- NEC Corporation
- Fujitsu Limited
- Nokia Corporation
- Ciena Corporation
- Xtera Limited
- Global Marine Systems Limited
- Prysmian S.p.A.
- Nexans S.A.
- Sumitomo Electric Industries, Ltd.
- Hengtong Optic-Electric Co., Ltd.
- ZTT International Limited
- LS Cable & System Ltd.
- TE Connectivity Ltd.
- Corning Incorporated
- Infinera Corporation
- ZTE Corporation
- Elettra Tlc S.p.A.
Additional Benefits:
- The market estimate (ME) sheet in Excel format
- 3 months of analyst support
TABLE OF CONTENTS
1 INTRODUCTION
- 1.1 Study Assumptions and Market Definition
- 1.2 Scope of the Study
2 RESEARCH METHODOLOGY
3 EXECUTIVE SUMMARY
4 MARKET LANDSCAPE
- 4.1 Market Overview
- 4.2 Market Drivers
- 4.2.1 Cloud and AI Traffic Driving New International Capacity
- 4.2.2 Hyperscaler Investment in Single-Owner Submarine Systems
- 4.2.3 Carrier-Neutral Landing Station Expansion in Emerging Corridors
- 4.2.4 Offshore Energy and Island Connectivity Requirements
- 4.2.5 National Digital Sovereignty and Critical-Infrastructure Spending
- 4.2.6 Modular and Prefabricated Landing Station Deployment
- 4.3 Market Restraints
- 4.3.1 Coastal Permitting and Environmental Review Delays
- 4.3.2 Cable Repair Vessel and Specialized Workforce Constraints
- 4.3.3 Concentrated Landing-Point and Backhaul Failure Exposure
- 4.3.4 Cybersecurity and Physical-Security Compliance Costs
- 4.4 Impact of Macroeconomic Factors on the Market
- 4.5 Industry Ecosystem Analysis
- 4.6 Regulatory Landscape
- 4.7 Technological Outlook
- 4.8 Porter's Five Forces Analysis
- 4.8.1 Bargaining Power of Suppliers
- 4.8.2 Bargaining Power of Buyers
- 4.8.3 Threat of New Entrants
- 4.8.4 Threat of Substitutes
- 4.8.5 Competitive Rivalry
5 MARKET SIZE AND GROWTH FORECASTS (VALUE)
- 5.1 By Component
- 5.1.1 Power Feeding Equipment
- 5.1.2 Submarine Line Terminal Equipment
- 5.1.3 Monitoring and Control Equipment
- 5.1.4 Protection Equipment
- 5.1.5 Other Components
- 5.2 By Service
- 5.2.1 Design and Engineering
- 5.2.2 Installation and Commissioning
- 5.2.3 Maintenance and Support
- 5.2.4 Upgrades and Retrofits
- 5.3 By Application
- 5.3.1 Telecommunications and Internet Backbone
- 5.3.2 Hyperscale and Data Center Interconnection
- 5.3.3 Government and Defense Connectivity
- 5.3.4 Offshore Energy and Industrial Connectivity
- 5.3.5 Inter-Country and Island Connection
- 5.4 By Ownership and Business Model
- 5.4.1 Consortium-Owned Systems
- 5.4.2 Single-Owner Systems
- 5.4.3 Carrier-Neutral Landing-Party Model
- 5.4.4 Government and Development-Bank-Backed Systems
- 5.5 By Geography
- 5.5.1 North America
- 5.5.1.1 United States
- 5.5.1.2 Canada
- 5.5.1.3 Mexico
- 5.5.2 South America
- 5.5.2.1 Brazil
- 5.5.2.2 Argentina
- 5.5.2.3 Chile
- 5.5.2.4 Rest of South America
- 5.5.3 Europe
- 5.5.3.1 Germany
- 5.5.3.2 United Kingdom
- 5.5.3.3 France
- 5.5.3.4 Italy
- 5.5.3.5 Spain
- 5.5.3.6 Rest of Europe
- 5.5.4 Asia-Pacific
- 5.5.4.1 China
- 5.5.4.2 Japan
- 5.5.4.3 India
- 5.5.4.4 South Korea
- 5.5.4.5 Australia
- 5.5.4.6 Rest of Asia-Pacific
- 5.5.5 Middle East
- 5.5.5.1 United Arab Emirates
- 5.5.5.2 Saudi Arabia
- 5.5.5.3 Qatar
- 5.5.5.4 Rest of Middle East
- 5.5.6 Africa
- 5.5.6.1 South Africa
- 5.5.6.2 Egypt
- 5.5.6.3 Nigeria
- 5.5.6.4 Rest of Africa
- 5.5.1 North America
6 COMPETITIVE LANDSCAPE
- 6.1 Market Concentration
- 6.2 Strategic Moves
- 6.3 Market Share Analysis
- 6.4 Company Profiles (includes Global Level Overview, Market Level Overview, Core Segments, Financials as available, Strategic Information, Market Rank/Share, Products and Services, Recent Developments)
- 6.4.1 Alcatel Submarine Networks SAS
- 6.4.2 SubCom, LLC
- 6.4.3 Huawei Marine Networks Co., Ltd.
- 6.4.4 NEC Corporation
- 6.4.5 Fujitsu Limited
- 6.4.6 Nokia Corporation
- 6.4.7 Ciena Corporation
- 6.4.8 Xtera Limited
- 6.4.9 Global Marine Systems Limited
- 6.4.10 Prysmian S.p.A.
- 6.4.11 Nexans S.A.
- 6.4.12 Sumitomo Electric Industries, Ltd.
- 6.4.13 Hengtong Optic-Electric Co., Ltd.
- 6.4.14 ZTT International Limited
- 6.4.15 LS Cable & System Ltd.
- 6.4.16 TE Connectivity Ltd.
- 6.4.17 Corning Incorporated
- 6.4.18 Infinera Corporation
- 6.4.19 ZTE Corporation
- 6.4.20 Elettra Tlc S.p.A.
7 MARKET OPPORTUNITIES AND FUTURE OUTLOOK
- 7.1 White-Space and Unmet-Need Assessment

 主動式光纜市場-全球市場預測(2026-2032年)
 主動式光纜市場規模、佔有率、趨勢和預測:按連接器類型、技術、應用和地區分類,2026-2034年環形基地台光纜市場:依光纜類型、光纖類型、安裝方式、施工應用、終端用戶產業及應用領域分類-2026-2032年全球預測
 全球主動光纜及延長器市場規模、佔有率、趨勢及成長分析報告(2026-2034)
 主動光纜市場 - 全球產業規模、佔有率、趨勢、機會及預測(按通訊協定、外形規格尺寸、最終用戶應用、地區和競爭格局分類,2021-2031年)室內光纜市場按產品類型、光纖數量、光纜結構、安裝類型和應用分類-全球預測,2026-2032年主動式光纜市場-2026-2031年預測
 主動光纜市場規模、佔有率及成長分析(依產品類型、通訊協定、外形規格、傳輸距離、材料類型、應用及地區分類)-產業預測,2026-2033年球透鏡擴束光纖連接器市場(依傳輸模式、連接器介面、應用和銷售管道)——2025-2030 年全球預測
 主動式光纖 (AOC) 的全球市場:類型·尺寸規格·用途·終端用戶·各地區 (~2030年)