


 |
市場調查報告書
商品編碼
2119365
新興技術雷達平台:市場佔有率分析、產業趨勢與統計、成長預測(2026-2031 年)Emerging Technology Radar Platforms - Market Share Analysis, Industry Trends & Statistics, Growth Forecasts (2026 - 2031) |
||||||

※ 本網頁內容可能與最新版本有所差異。詳細情況請與我們聯繫。
根據 Mordor Intelligence 預測,新興技術雷達平台市場將從 2025 年的 11.4 億美元成長到 2026 年的 12.7 億美元,到 2031 年達到 25.4 億美元,2026 年至 2031 年的年複合成長率(CAGR)為 10.96%。
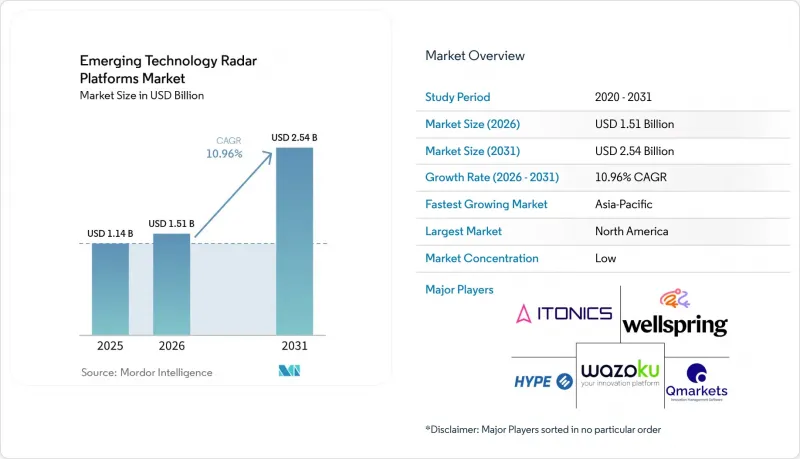
本報告按平台功能(趨勢和未來預測等)、部署類型(雲端、混合等)、組織規模(大型企業、中小企業)、應用領域(研發等)、最終用戶(能源和公共產業等)以及地區進行細分。市場預測以美元計價。
全球新興技術雷達平台市場趨勢及洞察
企業對持續技術前瞻性的需求
各組織機構越來越傾向將技術前瞻視為一項持續性責任,而非一次性的年度活動。這種轉變正在改變新興技術雷達平台市場的採購邏輯,因為團隊在審查預算、產品計劃和投資方案時需要最新的資訊。利用此類平台,策略團隊可以對不斷發展、充滿不確定性或日漸式微的技術達成通用。它也有助於記錄技術決策背後的邏輯,供經營團隊和董事會參考。當產品發佈時間和技術選擇直接影響競爭地位時,持續更新尤其重要。由此產生的需求傾向於那些能夠將最新資訊轉化為清晰且具說服力的決策依據,而非靜態報告的供應商。
人工智慧驅動的弱訊號檢測與融合
人工智慧技術正將雷達平台的功能擴展到基礎關鍵字監控和人工審核之外。芬蘭VTT技術研究中心發布的一項研究描述了一種大規模方法,利用語言模型和「強度」與「擴散」兩個指標,從約9萬篇科學論文中識別大規模訊號。這種方法使預測團隊能夠在無需增加分析師數量的情況下,審查更廣泛的研究資料,以應對日益成長的資訊量。據ITONICS稱,Prism AI處理超過5,000萬個訊號,包括專利、論文和競爭對手活動,從而建構技術雷達。其實際價值取決於系統能否區分高度相關的早期證據和僅僅是新穎或引人注目的訊號。因此,每個供應商都將自動化整合功能與資訊來源可追溯性和使用者審核功能結合。
資料來源、授權和知識產權限制
雷達平台依賴對出版物、專利、企業資料和其他外部記錄的存取。授權條款和資料使用法規會增加維護廣泛覆蓋範圍的成本,尤其對於小規模的供應商。歐洲採購團隊在批准多源平台之前,也會評估資料權利、隱私和敏感資訊處理。這些驗證流程可能會延長銷售週期,因此資料管治成為產品選擇中的關鍵要求。當買家需要驗證平台可以存取哪些資料時,擁有完善的資料協定和清晰的資料來源記錄的供應商具有實際優勢。因此,在新興的雷達平台市場中,無法證明其資料管理實務合法透明的公司可能面臨較高的進入門檻。
細分市場分析
2025年,「技術偵察與前瞻性掃描」功能佔平台收入的38.42%,在「新興技術雷達平台市場」中佔據平台功能類別的最大佔有率。大規模研發和策略團隊甚至在人工智慧(AI)新技術出現之前就已經開始利用技術偵察工作流程。這使得供應商有時間將技術偵察操作與客戶關係管理(CRM)工具、研發組合和階段性流程整合起來。由於企業需要系統化的方法來識別與其產品、營運和投資計畫相關的技術,因此這個過程仍然十分重要。其高佔有率也反映了維護可重複流程以整合外部技術資訊的實際價值。這使得企業能夠在正式討論某個主題之前,確保記錄資訊來源、日期、相關性和負責人。在「新興技術雷達平台市場」中,此功能為使用者提供了一個可操作的起點,用於將外部趨勢與既定的技術優先事項進行比較。它還有助於團隊記錄選擇該主題的原因、參與討論的人員以及該主題在內部決策流程中的進展。當多個部門監控同一主題並需要對現有證據達成通用時,這種結構非常有用。
預計2026年至2031年間,趨勢和前瞻情報市場將以14.27%的複合年成長率成長。這種能力有助於高階主管了解技術發展的更廣泛影響,而不僅僅是接收一系列訊號。這使他們能夠將技術趨勢與業務方向、時機和資源分配方面的挑戰聯繫起來。專利和科學文獻情報,以及新創公司、大型企業和合作夥伴發現功能,對於那些最初有特定資訊需求的買家來說仍然非常有用。這些功能可以作為組織轉向更廣泛平台之前的切入點。監管和地緣政治情報的疊加功能也為監控軍民兩用技術和核准流程的能源和國防用戶增添了價值。 「新興技術雷達平台市場」透過平台將訊號與用戶已經面臨的決策挑戰連結起來,從而支援這些廣泛的應用。這為高階主管提供了一個更清晰的基礎來討論不確定性,而無需立即將每個可見的趨勢視為投資機會。
到2025年,81.23%的平台訂閱將採用雲端部署,這反映了分散式創新團隊對存取的需求。雲端交付大大減輕了本地基礎設施的工作量,並使用戶能夠基於共用的雷達輸出進行協作。這種模式適用於策略、研發、創投和產品團隊分佈在不同辦公室或國家的組織。 Planview透過展示其Anvi產品中包含60多個連接器的資料架構,證明了將雲端平台與客戶系統整合的重要性。隨著雲端功能的普及,資料深度、訊號新鮮度和實用整合正成為比部署模式本身更重要的差異化因素。客戶也重視提供者在眾多使用者新增評論、更新評分或將內部證據附加到外部訊號時能否保持上下文一致性。雲端平台必須能夠清晰地反映這些變化,而不會創建相同技術評估的多個不一致版本。在「新興技術雷達平台市場」中,通用存取環境使不同部門能夠處理相同資料集,而不是分發單獨的文件。它的價值仍然取決於存取權限的管理以及對可以共用哪些資料的清晰了解。
混合部署預計將在2026年至2031年間以14.36%的複合年成長率成長。金融服務、國防和醫療保健行業的機構可能需要在指定管轄範圍內保留敏感數據,同時利用基於雲端的人工智慧功能開展其他業務。雖然基於Web和本地部署的訂閱用戶佔比很小,但本地配置在國防和國家主導的人工智慧專案中仍然發揮著重要作用。歐洲買家可以利用混合模式將高度敏感的內部數據與敏感度較低的外部訊號處理分開。 2026年6月,Planview發布了“成果智慧圖譜”,該圖譜將投資組合決策、資源和成果連結起來。這種架構確保了可訪問性,同時又不會損害管治控制。在「新興技術雷達平台市場」中,混合設計解決了廣泛的外部情報和有限的內部資訊之間的現實困境。這使得客戶能夠決定哪些內容遷移到雲層,哪些內容應該保留在受控環境中。
區域分析
到2025年,北美將佔全球銷售額的37.28%,佔據新興技術雷達平台市場的最大佔有率。這主要得益於負責正式創新、創投和技術情報的採購負責人的需求。財富500強企業的創新實驗室、企業創投部門和大學技術轉移辦公室正在推動整體平台功能的需求。由於許多組織已經廣泛使用技術偵察和競爭情報工具,美國在該地區擁有最大的市場規模。這種良好的發展記錄使得供應商更容易進入客戶的工作流程,尤其是在競爭對手已經在使用類似系統的情況下。加拿大的公共資助創新計畫以及墨西哥航太和汽車供應鏈的措施也進一步促進了需求。
預計亞太地區2026年至2031年的複合年成長率將達到14.81%。這一成長並非由單一採購模式驅動,而是由公共技術項目和私營部門需求共同推動。印度IT服務和製藥公司正利用前瞻性工具尋找生物技術和先進製造領域的合作夥伴。在日本和韓國,由於電子和半導體相關企業需要持續監控競爭對手的動向,因此對以專利為中心的智慧資訊需求旺盛。 2026年4月,NEXEA和MyInnovationX宣布推出一個人工智慧驅動的開放式創新平台,該平台連接了東南亞8,000多家技術解決方案供應商的資料庫。這一發展表明,該地區的創新生態系統正在超越現有的創新中心而擴展。
預計到2025年,歐洲將佔據相當大的收入佔有率,其中德國、英國和法國將成為主要市場。這得歸功於工業研發投入和成熟的企業創新能力。 GDPR和歐盟人工智慧法規增加了合規性的考量,使擁有健全的資料管理系統和已通過核准的資料存取機制的供應商更具優勢。 2025年4月,法國公共投資銀行(Bpifrance)與Dealroom合作推出了「創新雷達」(Radar de l'Innovation),涵蓋綠色科技、工業新創公司、商業技術和深度科技。南美洲雖然規模較小,但也展現出積極的發展勢頭,巴西透過其位於聖保羅的研發協調中心支持企業創新。同時,在中東和非洲地區,沙烏地阿拉伯和阿拉伯聯合大公國正在推動對技術預測工具的機構需求,從而創造新的機會。
其他好處:
- Excel格式的市場預測(ME)表
- 3個月的分析師支持
目錄
第1章:引言
- 研究假設和市場定義
- 調查範圍
第2章:調查方法
第3章執行摘要
第4章 市場狀況
- 市場概覽
- 市場促進因素
- 企業對持續技術預測的需求
- 基於人工智慧的弱訊號檢測與合成
- 克服技術過時和縮短創新周期的壓力
- 整合與專利、出版品、資金籌措和採用相關的訊號。
- 在分散式團隊中擴展基於雲端的創新工作流程
- 評估可解釋技術的採用、成熟度和發展動能。
- 市場限制因素
- 資料來源、授權和知識產權限制
- 人工智慧產生的技術訊號存在較高的假陽性風險
- 整合分散式企業資料和工作流程的難度
- 缺乏將雷達訊號轉化為已獲資助的飛行員所需的內部能力。
- 宏觀經濟因素對市場的影響
- 產業價值鏈分析
- 科技趨勢
- 監理情勢
- 波特五力分析
第5章 市場規模與成長預測
- 平台功能
- 技術探索與前瞻性研究
- 趨勢和未來預測智慧
- 專利和學術文獻情報
- 發掘新創公司、企業和合作夥伴
- 其他平台功能
- 部署模式
- 基於雲端的
- 基於網路的
- 現場
- 混合
- 按組織規模
- 大公司
- 小型企業
- 透過使用
- 企業策略與策略遠見
- 研究與開發
- 企業創投和併購;
- 開放式創新與科技探索
- 競爭資訊
- 監管和風險訊息
- 最終用戶
- 科技與軟體
- 製造業和工業
- 醫療保健和生命科學
- 金融服務和保險
- 能源公用事業
- 汽車與出行
- 航太/國防
- 其他最終用戶
- 按地區
- 北美洲
- 美國
- 加拿大
- 墨西哥
- 南美洲
- 巴西
- 阿根廷
- 智利
- 其他南美國家
- 歐洲
- 德國
- 英國
- 法國
- 義大利
- 西班牙
- 其他歐洲國家
- 亞太地區
- 中國
- 日本
- 印度
- 韓國
- 澳洲
- 其他亞太國家
- 中東
- 阿拉伯聯合大公國
- 沙烏地阿拉伯
- 卡達
- 其他中東國家
- 非洲
- 南非
- 埃及
- 奈及利亞
- 其他非洲國家
- 北美洲
第6章 競爭情勢
- 市場集中度
- 策略趨勢
- 市佔率分析
- 公司簡介
- Tera
- Trendtracker
- Avantion
- Tolaga Research, Inc.
- Traction Technology, Inc.
- Ezassi, Inc.
- ITONICS Innovation GmbH
- Wazoku Limited
- HYPE Innovation GmbH
- Qmarkets Ltd.
- Brightidea, Inc.
- Wellspring International, Inc.
- IdeaScale, Inc.
- InnovationCast, Inc.
- Planview, Inc.
- Tracxn Technologies Private Limited
- CB Insights, LLC
- StartUs Insights GmbH
- Bloomflow SAS
- Viima Solutions Oy
第7章 市場機會與未來展望
According to Mordor Intelligence, the emerging technology radar platforms market size is projected to expand from USD 1.14 billion in 2025 to USD 1.27 billion in 2026, and to USD 2.54 billion by 2031, registering a CAGR of 10.96% between 2026 and 2031.
This report is Segmented by Platform Function (Trend and Foresight Intelligence, and More), Deployment Mode (Cloud-Based, Hybrid and More), Organization Size (Large Enterprises, and Small and Medium-Size Enterprises), Application (Research and Development, and More), End User (Energy and Utilities, and More), and Geography. The Market Forecasts are Provided in Terms of Value (USD).
Global Emerging Technology Radar Platforms Market Trends and Insights
Enterprise Demand for Continuous Technology Foresight
Organizations are making technology foresight an ongoing responsibility instead of an annual exercise. This shift changes the buying case for the Emerging Technology Radar Platforms Market because teams need updated evidence when budgets, product plans, and investment choices are reviewed. A platform can give strategy teams a common view of technologies that are advancing, uncertain, or losing relevance. It can also make it easier to document a technology decision for senior management and boards. Continuous updates are most useful where product timing and technology choices directly affect competitive position. The resulting demand favors providers that translate current information into clear, defensible decisions rather than static reports.
AI-Assisted Weak-Signal Detection and Synthesis
AI functions are extending radar platforms beyond basic keyword monitoring and manual review. Research published by VTT Technical Research Center of Finland described a large-scale approach that used language models and 2 indicators, intensity and diffusion, to identify weak signals in a body of nearly 90,000 scientific publications. This approach can help foresight teams examine a wider set of research materials without matching the increase in information volume with an equivalent increase in analyst hiring. ITONICS stated that Prism AI processes more than 50 million signals, including patents, publications, and competitor developments, to create technology radars. The practical value depends on whether the system separates relevant early evidence from signals that are merely new or highly visible. Providers are therefore pairing automated synthesis with source traceability and user review.
Data Provenance, Licensing, and Intellectual Property Constraints
Radar platforms depend on access to publications, patents, company information, and other external records. Licensing terms and data-use controls can increase the cost of maintaining broad coverage, particularly for smaller providers. European procurement teams also assess data rights, privacy, and the handling of proprietary information before approving a multi-source platform. These checks can lengthen sales cycles and make data governance a decisive product requirement. Providers with established data agreements and clear provenance records have a practical advantage when buyers need to validate what a platform can use. The Emerging Technology Radar Platforms Market may therefore see a higher barrier to entry for firms that cannot demonstrate lawful and transparent data practices.
Other drivers and restraints analyzed in the detailed report include:
- Pressure to Reduce Technology Obsolescence and Innovation Cycle Time
- Integration of Patent, Publication, Funding, and Deployment Signals
- High False-Positive Risk in AI-Generated Technology Signals
For complete list of drivers and restraints, kindly check the Table Of Contents.
Segment Analysis
Technology Scouting and Horizon Scanning commanded 38.42% of platform revenue in 2025, giving it the largest Emerging Technology Radar Platforms Market share by platform function. Large R&D and strategy teams had used scouting workflows before newer AI functions became available. This history gave vendors time to connect scouting work with CRM tools, R&D portfolios, and stage-gate processes. The segment remains important because organizations need a disciplined way to identify technologies relevant to their products, operations, and investment plans. Its large share also reflects the practical value of maintaining a repeatable intake process for external technology evidence. It gives organizations a place to capture the source, date, relevance, and owner of a topic before it is elevated into a formal discussion. In the Emerging Technology Radar Platforms Market, this function gives users a practical starting point for comparing external developments against established technical priorities. It also helps teams record why a topic was reviewed, who considered it, and how it moved through an internal decision process. That structure is useful when several units monitor the same subject but require a common view of the available evidence.
Trend and Foresight Intelligence is forecast to grow at a 14.27% CAGR from 2026 to 2031. The function serves executives who need to understand the broader implications of technological developments rather than receive an inventory of signals. It can connect technology movement with questions about business direction, timing, and resource allocation. Patent and Scientific-Literature Intelligence, together with Startup, Company, and Partner Discovery, remains useful for buyers who begin with a specific information need. These functions can become entry points before an organization moves to a broader platform. Regulatory and geopolitical intelligence overlays also add value for energy and defense users monitoring dual-use technologies and approval paths. The Emerging Technology Radar Platforms Market supports this broader use when the platform links a signal to a decision question that users already need to resolve. It can give executives a clearer basis for discussing uncertainty without treating every visible development as an immediate investment case.
Cloud-based deployment held 81.23% of platform subscriptions in 2025, reflecting demand for access across distributed innovation teams. Cloud delivery reduces much of the local infrastructure work and enables users to collaborate on shared radar outputs. This model fits organizations where strategy, R&D, venture, and product teams work in different offices or countries. Planview described a data fabric with more than 60 connectors as part of its Anvi offering, showing the importance of linking a cloud platform with customer systems. As cloud capabilities become common, data depth, signal freshness, and useful synthesis become stronger differentiators than deployment alone. Customers also assess whether a provider can preserve context when many users add comments, update a rating, or attach internal evidence to an external signal. A cloud platform must make those changes understandable without creating several inconsistent versions of the same technology assessment. For the Emerging Technology Radar Platforms Market, common access also allows different functions to work from the same source set rather than circulate separate files. The value remains dependent on permission controls and a clear understanding of which data can be shared.
Hybrid deployment is forecast to grow at a 14.36% CAGR from 2026 to 2031. Financial services, defense, and healthcare organizations may need to keep sensitive data within defined jurisdictions while using cloud-based AI functions for other work. Web-based and on-premises deployments accounted for smaller shares of subscriptions, although on-premises configurations remain relevant for national defense and sovereign AI programs. European buyers can use hybrid models to separate sensitive internal data from less-sensitive external signal processing. Planview introduced its Outcome Intelligence Graph in June 2026 to connect portfolio decisions, resources, and outcomes. The architecture supports accessibility without removing governance controls. In the Emerging Technology Radar Platforms Market, hybrid designs address the practical tension between broad external intelligence and restricted internal information. They allow a customer to decide which content can move to a cloud layer and which content must remain in a controlled setting.
Complete Report Scope:
- By Platform Function
- Technology Scouting and Horizon Scanning
- Trend and Foresight Intelligence
- Patent and Scientific-Literature Intelligence
- Startup, Company, and Partner Discovery
- Other Platform Functions
- By Deployment Mode
- Cloud-Based
- Web-Based
- On-Premises
- Hybrid
- By Organization Size
- Large Enterprises
- Small and Medium-Size Enterprises
- By Application
- Corporate Strategy and Strategic Foresight
- Research and Development
- Corporate Venture Capital and M&A
- Open Innovation and Technology Scouting
- Competitive Intelligence
- Regulatory and Risk Intelligence
- By End User
- Technology and Software
- Manufacturing and Industrial
- Healthcare and Life Sciences
- Financial Services and Insurance
- Energy and Utilities
- Automotive and Mobility
- Aerospace and Defense
- Other End Users
- By Geography
- North America
- United States
- Canada
- Mexico
- South America
- Brazil
- Argentina
- Chile
- Rest of South America
- Europe
- Germany
- United Kingdom
- France
- Italy
- Spain
- Rest of Europe
- Asia-Pacific
- China
- Japan
- India
- South Korea
- Australia
- Rest of Asia-Pacific
- Middle East
- United Arab Emirates
- Saudi Arabia
- Qatar
- Rest of Middle East
- Africa
- South Africa
- Egypt
- Nigeria
- Rest of Africa
- North America
Geography Analysis
North America retained 37.28% of global revenue in 2025, giving the region the largest share of the Emerging Technology Radar Platforms Market and benefiting from buyers with formal innovation, venture, and technology-intelligence responsibilities. Fortune 500 innovation laboratories, corporate venture units, and university technology transfer offices support demand across platform functions. The United States was the largest country within the region because technology scouting and competitive intelligence tools were already established in many organizations. This installed base can make it easier for a vendor to enter a customer's workflow when peers already use similar systems. Canada's publicly funded innovation programs and Mexico's aerospace and automotive supply chain work provide additional sources of demand.
Asia-Pacific is forecast to grow at a 14.81% CAGR from 2026 to 2031. Growth comes from both public technology programs and private-sector demand rather than one single buying pattern, with India's IT services and pharmaceutical companies using foresight tools to identify partnerships in biotechnology and advanced manufacturing. Japan and South Korea have a demand for patent-centered intelligence because electronics and semiconductor organizations need ongoing monitoring of competitors. NEXEA and MyInnovationX unveiled an AI-driven open innovation platform in April 2026 that connected a database of more than 8,000 technology solution providers across Southeast Asia. The development showed that the regional ecosystem was broadening beyond established innovation centers.
Europe accounted for a meaningful share of revenue in 2025, with Germany, the United Kingdom, and France as major markets, supported by industrial R&D spending and established corporate innovation functions. GDPR and the EU AI Act add compliance considerations that favor suppliers with strong data-handling controls and approved data-access arrangements. Bpifrance launched Radar de l'Innovation with Dealroom in April 2025, covering Greentech, industrial startups, Tech for Business, and Deeptech. South America remained smaller but active, with Brazil supporting corporate innovation work through R&D coordination centers in Sao Paulo, while Middle East and Africa presented an emerging opportunity as Saudi Arabia and the UAE developed institutional demand for technology foresight tools.
- Tera
- Trendtracker
- Avantion
- Tolaga Research, Inc.
- Traction Technology, Inc.
- Ezassi, Inc.
- ITONICS Innovation GmbH
- Wazoku Limited
- HYPE Innovation GmbH
- Qmarkets Ltd.
- Brightidea, Inc.
- Wellspring International, Inc.
- IdeaScale, Inc.
- InnovationCast, Inc.
- Planview, Inc.
- Tracxn Technologies Private Limited
- CB Insights, LLC
- StartUs Insights GmbH
- Bloomflow SAS
- Viima Solutions Oy
Additional Benefits:
- The market estimate (ME) sheet in Excel format
- 3 months of analyst support
TABLE OF CONTENTS
1 INTRODUCTION
- 1.1 Study Assumptions and Market Definition
- 1.2 Scope of the Study
2 RESEARCH METHODOLOGY
3 EXECUTIVE SUMMARY
4 MARKET LANDSCAPE
- 4.1 Market Overview
- 4.2 Market Drivers
- 4.2.1 Enterprise Demand for Continuous Technology Foresight
- 4.2.2 AI-Assisted Weak-Signal Detection and Synthesis
- 4.2.3 Pressure to Reduce Technology Obsolescence and Innovation Cycle Time
- 4.2.4 Integration of Patent, Publication, Funding, and Deployment Signals
- 4.2.5 Expansion of Cloud-Based Innovation Workflows Across Distributed Teams
- 4.2.6 Adoption of Explainable Technology Maturity and Momentum Scoring
- 4.3 Market Restraints
- 4.3.1 Data Provenance, Licensing, and Intellectual-Property Constraints
- 4.3.2 High False-Positive Risk in AI-Generated Technology Signals
- 4.3.3 Fragmented Enterprise Data and Difficult Workflow Integration
- 4.3.4 Limited Internal Capacity to Convert Radar Signals into Funded Pilots
- 4.4 Impact of Macroeconomic Factors on the Market
- 4.5 Industry Value-Chain Analysis
- 4.6 Technology Outlook
- 4.7 Regulatory Landscape
- 4.8 Porter's Five Forces Analysis
- 4.8.1 Threat of New Entrants
- 4.8.2 Bargaining Power of Suppliers
- 4.8.3 Bargaining Power of Buyers
- 4.8.4 Threat of Substitutes
- 4.8.5 Intensity of Competitive Rivalry
5 MARKET SIZE AND GROWTH FORECASTS (VALUE)
- 5.1 By Platform Function
- 5.1.1 Technology Scouting and Horizon Scanning
- 5.1.2 Trend and Foresight Intelligence
- 5.1.3 Patent and Scientific-Literature Intelligence
- 5.1.4 Startup, Company, and Partner Discovery
- 5.1.5 Other Platform Functions
- 5.2 By Deployment Mode
- 5.2.1 Cloud-Based
- 5.2.2 Web-Based
- 5.2.3 On-Premises
- 5.2.4 Hybrid
- 5.3 By Organization Size
- 5.3.1 Large Enterprises
- 5.3.2 Small and Medium-Size Enterprises
- 5.4 By Application
- 5.4.1 Corporate Strategy and Strategic Foresight
- 5.4.2 Research and Development
- 5.4.3 Corporate Venture Capital and M&A
- 5.4.4 Open Innovation and Technology Scouting
- 5.4.5 Competitive Intelligence
- 5.4.6 Regulatory and Risk Intelligence
- 5.5 By End User
- 5.5.1 Technology and Software
- 5.5.2 Manufacturing and Industrial
- 5.5.3 Healthcare and Life Sciences
- 5.5.4 Financial Services and Insurance
- 5.5.5 Energy and Utilities
- 5.5.6 Automotive and Mobility
- 5.5.7 Aerospace and Defense
- 5.5.8 Other End Users
- 5.6 By Geography
- 5.6.1 North America
- 5.6.1.1 United States
- 5.6.1.2 Canada
- 5.6.1.3 Mexico
- 5.6.2 South America
- 5.6.2.1 Brazil
- 5.6.2.2 Argentina
- 5.6.2.3 Chile
- 5.6.2.4 Rest of South America
- 5.6.3 Europe
- 5.6.3.1 Germany
- 5.6.3.2 United Kingdom
- 5.6.3.3 France
- 5.6.3.4 Italy
- 5.6.3.5 Spain
- 5.6.3.6 Rest of Europe
- 5.6.4 Asia-Pacific
- 5.6.4.1 China
- 5.6.4.2 Japan
- 5.6.4.3 India
- 5.6.4.4 South Korea
- 5.6.4.5 Australia
- 5.6.4.6 Rest of Asia-Pacific
- 5.6.5 Middle East
- 5.6.5.1 United Arab Emirates
- 5.6.5.2 Saudi Arabia
- 5.6.5.3 Qatar
- 5.6.5.4 Rest of Middle East
- 5.6.6 Africa
- 5.6.6.1 South Africa
- 5.6.6.2 Egypt
- 5.6.6.3 Nigeria
- 5.6.6.4 Rest of Africa
- 5.6.1 North America
6 COMPETITIVE LANDSCAPE
- 6.1 Market Concentration
- 6.2 Strategic Moves
- 6.3 Market Share Analysis
- 6.4 Company Profiles (includes Global Level Overview, Market Level Overview, Core Segments, Financials as available, Strategic Information, Market Rank/Share, Products and Services, Recent Developments)
- 6.4.1 Tera
- 6.4.2 Trendtracker
- 6.4.3 Avantion
- 6.4.4 Tolaga Research, Inc.
- 6.4.5 Traction Technology, Inc.
- 6.4.6 Ezassi, Inc.
- 6.4.7 ITONICS Innovation GmbH
- 6.4.8 Wazoku Limited
- 6.4.9 HYPE Innovation GmbH
- 6.4.10 Qmarkets Ltd.
- 6.4.11 Brightidea, Inc.
- 6.4.12 Wellspring International, Inc.
- 6.4.13 IdeaScale, Inc.
- 6.4.14 InnovationCast, Inc.
- 6.4.15 Planview, Inc.
- 6.4.16 Tracxn Technologies Private Limited
- 6.4.17 CB Insights, LLC
- 6.4.18 StartUs Insights GmbH
- 6.4.19 Bloomflow SAS
- 6.4.20 Viima Solutions Oy
7 MARKET OPPORTUNITIES AND FUTURE OUTLOOK
- 7.1 White-Space and Unmet-Need Assessment

 2026-2030年全球汽車毫米波雷達市場
 汽車雷達市場:按類型、組件、偵測範圍、頻段、應用、車輛類型和銷售管道分類-2026-2032年全球市場預測
 汽車雷達市場分析及預測(至2035年):類型、產品、技術、組件、應用、功能、安裝方式、解決方案、模式
 汽車雷達:市場佔有率分析、產業趨勢與統計、成長預測(2026-2031)
 汽車雷達市場規模、佔有率、趨勢和預測:按探測範圍、車輛類型、應用和地區分類,2026-2034年
 2026年全球車輛雷達測試系統市場報告2026年全球汽車雷達市場報告汽車雷達感測器市場:按安裝類型、技術、車輛類型、最終用戶和應用分類-2026-2032年全球市場預測
 汽車雷達市場機會、成長要素、產業趨勢分析及預測(2026年至2035年)
 汽車雷達感測器市場-全球產業規模、佔有率、趨勢、機會、預測:按範圍、應用、車輛類型、地區和競爭格局分類,2021-2031年