


 |
市場調查報告書
商品編碼
2119215
內燃機用氣體燃料:市場佔有率分析、行業趨勢和統計數據以及成長預測(2026-2031 年)Gaseous Fuels For Internal Combustion (IC) Engines - Market Share Analysis, Industry Trends & Statistics, Growth Forecasts (2026 - 2031) |
||||||

※ 本網頁內容可能與最新版本有所差異。詳細情況請與我們聯繫。
根據 Mordor Intelligence 的數據,內燃機用氣體燃料市場預計將從 2025 年的 1.2308 億噸成長到 2026 年的 1.3864 億噸(按產量計算),並將從 2026 年到 2031 年以 12.88% 的複合年成長率 200 億噸,達到 20.525 年 20.50 億噸成長率。
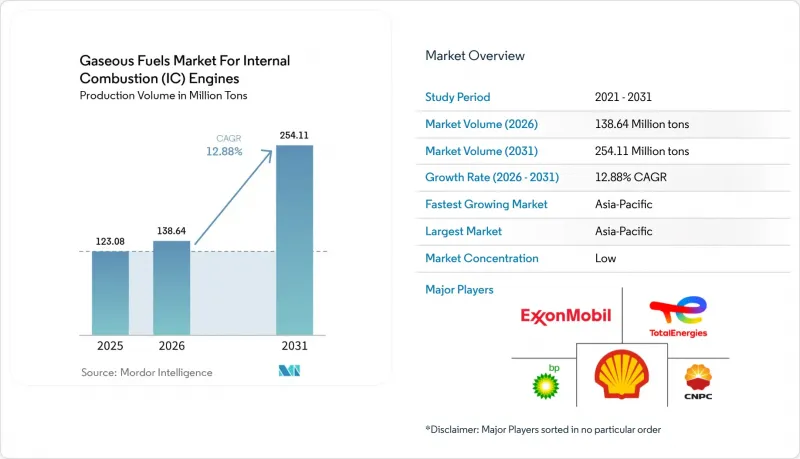
本報告按燃料類型(壓縮天然氣、液化天然氣、液化石油氣/汽車燃氣液化石油氣、沼氣/生物甲烷、氫氣及其他)、應用領域(小型車輛、中型和重型商用車輛、海運和水運、鐵路和非公路設備及其他)以及地區(北美、歐洲、亞太、南美、中東和非洲)進行細分。市場預測以銷售量(百萬噸)為單位。
內燃機燃氣燃料市場的趨勢與洞察
與柴油相比,汽油的總擁有成本更低,這是車輛燃料轉換的決定性因素。
CNG的成本效益是推動內燃車隊轉向氣體燃料市場的直接原因。 2026年5月,康明斯宣布CNG的平均價格將為每加侖2.99美元,而柴油的平均價格為每加侖4.25美元,這意味著每年消耗1萬加侖CNG可節省12,600美元的燃料成本。對於日常行駛路線固定、年行駛里程高的車輛而言,這一差異尤其顯著,而這些車輛也正是內燃氣體氣體燃料市場的主要需求群體。此外,CNG引擎無需柴油引擎廢氣處理液(DEF)系統或柴油顆粒過濾器(DPF),從而減輕了柴油引擎廢氣後處理的部分維護負擔。更低且更透明的營運成本使車隊管理者更容易證明燃料成本、維護成本以及與加氣站簽訂合約的合理性。當車隊運轉率夠高,能夠維持專用加氣設施或可靠的公共加氣站時,這項優勢將最為明顯。
對大型車輛和都市區車隊更嚴格的排放氣體法規正在創造合規驅動的需求。
排放氣體法規的實施提升了能夠滿足船隊運作需求並降低系統複雜性的引擎方案的價值。國際海事組織(IMO)於2025年4月批准了“IMO淨零排放框架”,該框架根據《國際防止船舶造成污染公約》(MARPOL)附則VI制定了應對航運溫室氣體排放績效的措施。道路運輸類似的監管趨勢也推動了對可在都市區和固定貨運路線上部署的燃料和引擎組合的需求。對於在空氣品質受到嚴格監控的地區營運的巴士、垃圾車和送貨車輛而言,合規性要求尤其重要。即使操作員需要更換車輛,如果他們無法接受電池續航里程、負載容量或充電的限制,燃氣引擎也可能是切實可行的解決方案。這些要求為內燃機燃氣燃料市場創造了一個更穩定的供應基礎,即使燃料價格出現波動。
加油站分佈不均和高昂的資本投資成本阻礙了其廣泛應用。
對於路線不固定、車隊規模有限的小規模業者而言,投資興建加氣站仍是一項挑戰。新建的加氣網路需要提供足夠的覆蓋範圍,才能讓營運商放心使用,但營運商通常需要有可靠的車輛需求證明才會進行投資。液化天然氣(LNG)的儲存和處理要求比壓縮天然氣(CNG)更為嚴格,因此這種惡性循環在使用LNG時更為突出。此外,在天然氣資源豐富但運輸燃料網路有限的地區,基礎設施不足會阻礙內燃機燃氣燃料市場的擴張。大規模車主則擁有建造專用加氣站的合理性,並且能夠將營運成本分攤到更多車輛上,從而更具優勢。因此,拓展公共交通線路並與物流營運商達成協議,對於擴大天然氣燃料的普及範圍至關重要。
細分市場分析
2025年,壓縮天然氣(CNG)在內燃機瓦斯燃料市場佔51.3%的佔有率。這得益於其在城市公車、市政垃圾收集車和本地物流運營中的長期應用。其龐大的部署規模和成熟的加氣模式為營運商的燃料和維護規劃提供了清晰的起點。 CNG特別適用於車輛每日返回基地台並行駛固定路線的情況。液化天然氣(LNG)則滿足不同的營運需求,例如長途貨運和航運,在這些情況下,續航里程可能受到壓縮氣體蘊藏量的限制。液化石油氣(LPG,也稱為車用汽車燃氣)繼續用於乘用車和輕型商用車,這些車輛的改裝技術、稅收和零售通路均已成熟。達契亞(Dacia)在2026年擴大了其LPG和汽油雙燃料車型的產品陣容,顯示原始設備製造商(OEM)對歐洲相關車型類別中這種燃料選擇的持續支持。
預計到2031年,氫氣將以17.1%的複合年成長率成長,成為內燃氣體氣體燃料市場中所有燃料類型中成長最快的。 2025年的一項技術評估顯示,氫氣內燃系統在採用傳統引擎製造流程的同時,其成本低於同類燃料電池系統。這將推動氫氣內燃系統在那些優先考慮利用率、續航里程和快速加氫的營運領域中得到應用,而非廣泛應用於普通乘用車。生物甲烷提供了一種替代性的應用途徑,因為它可以利用許多現有的燃氣引擎和分配系統。歐洲議會指出,《可再生能源指令》框架內與交通運輸相關的條款為生物甲烷的引入提供了重要的政策基礎。合成氣和合成甲烷仍處於發展初期,預計在預測期內商業性應用有限。
區域分析
預計到2025年,亞太地區將佔區域銷售佔有率的53.3%,並在2031年之前以14.8%的複合年成長率成長。該地區的特點是車隊規模大規模、壓縮天然氣(CNG)營運成熟、城市燃氣發展迅速,以及長途運輸對液化天然氣(LNG)的需求不斷成長。中國仍然是商用車的重要來源地,而印度正從都市區CNG使用轉向LNG物流基礎設施。 Indraprastha Gas於2026年在達德里(Dadri)開設了其首個LNG加氣站,為該地區的長途卡車運輸提供了更多選擇。東南亞地區由於都市區空氣品質目標、天然氣供應狀況和新的CNG項目,擁有更大的發展潛力。然而,未來的發展將取決於加氣站基礎設施能否滿足車主的需求。
北美和歐洲是內燃機燃氣燃料市場的關鍵技術和監管中心。在美國,清潔能源燃料公司(Clean Energy Fuels)正在貨運走廊沿線擴大可再生天然氣產能和加氣站。在歐洲,政策更重視生物甲烷的整合和生命週期排放績效。歐洲投資銀行(EIB)向義大利國家天然氣公司(Snam)提供的貸款將支持該生物甲烷工廠與義大利天然氣管網之間的新合作。這項投資有望使運輸企業更容易獲得整個內燃機燃氣燃料市場的可再生天然氣供應。這些地區也是氫氣燃燒設備、認證船舶系統和船隊服務模式的示範基地。
南美洲、中東和非洲蘊藏著巨大的成長潛力,但基礎建設水準卻參差不齊。天然氣供應狀況、當地燃料價格走勢、公共投資都會影響特定地區的天然氣普及率。阿根廷在車輛燃料轉型中扮演關鍵角色,其燃氣引擎的本地化生產有望增強該地區的供給能力。 FPT Industrial於2025年8月在阿根廷開始生產用於商用車、農用車和城市交通的天然氣燃氣引擎。奈及利亞規劃中的壓縮天然氣(CNG)網路以及沙烏地阿拉伯的「天然氣驅動交通」計畫表明,各方對內燃機天然氣燃料市場在區域範圍內的更廣泛擴張抱有濃厚的興趣。而這一切的實現取決於加氣站的資金籌措、可靠的燃料配送以及能夠滿足初期需求的車隊營運商。
其他好處
- Excel格式的市場預測(ME)表
- 3個月的分析師支持
目錄
第1章:引言
- 研究假設和市場定義
- 調查範圍
第2章:調查方法
第3章執行摘要
第4章 市場狀況
- 市場概覽
- 市場促進因素
- 與柴油相比,總擁有成本更低。
- 對大型車輛和都市區車隊實施更嚴格的排放氣體法規。
- 擴建壓縮天然氣 (CNG)、液化天然氣 (LNG) 和可再生氣體的加氣基礎設施
- 出廠時標配瓦斯動力傳動系統。
- 生物甲烷及其與現有燃氣引擎和基礎設施的兼容性
- 適用於難以實現電氣化的應用場景的氫燃料電池相容引擎平台。
- 市場限制因素
- 加油站網路分佈不均和高昂的資本投資成本
- 天然氣價格波動和進口依賴性
- 甲烷洩漏和生命週期排放計算的風險
- 在日益電氣化的市場中,燃油車的殘值折扣問題日益凸顯。
- 供應鏈分析
- 技術展望
- 監理情勢
- 波特五力分析
第5章 市場規模與成長預測
- 按燃料類型
- 壓縮天然氣(CNG)
- 液化天然氣(LNG)
- 液化石油氣(LPG/汽車燃氣)
- 沼氣/生物甲烷
- 氫
- 其他燃料類型(合成氣、合成甲烷等)
- 透過使用
- 小型車輛(乘用車和輕型商用車)
- 中型和大型商用車輛(卡車和巴士)
- 海上和水路運輸
- 鐵路和非公路設備
- 其他用途(固定式發電等)
- 按地區
- 北美洲
- 美國
- 加拿大
- 墨西哥
- 歐洲
- 德國
- 英國
- 法國
- 俄羅斯
- 西班牙
- 其他歐洲國家
- 亞太地區
- 中國
- 印度
- 日本
- 韓國
- 東南亞國協
- 其他亞太國家
- 南美洲
- 巴西
- 阿根廷
- 其他南美國家
- 中東和非洲
- 沙烏地阿拉伯
- 阿拉伯聯合大公國
- 南非
- 其他中東和非洲國家
- 北美洲
第6章 競爭情勢
- 市場集中度
- 策略趨勢
- 市佔率分析
- 公司簡介
- Adani Total Gas Limited
- bp plc
- Chevron Corporation
- China National Petroleum Corporation
- Clean Energy Fuels Corp.
- ENGIE SA
- Eni SpA
- Equinor ASA
- Exxon Mobil Corporation
- FortisBC Energy Inc.
- Gasum Oy
- Indian Oil Corporation Limited
- L'Air Liquide SA
- Linde plc
- Repsol, SA
- Shell plc
- Snam SpA
- TotalEnergies SE
第7章 市場機會與未來展望
According to Mordor Intelligence, the gaseous fuels market for Internal Combustion Engines Industry size in terms of production volume is expected to grow from 123.08 million tons in 2025 to 138.64 million tons in 2026 and is forecast to reach 254.11 million tons by 2031 at 12.88% CAGR over 2026-2031.
This report is Segmented by Fuel Type (CNG, LNG, LPG/Autogas, Biogas/Biomethane, Hydrogen, Other Types), Application (Light-Duty Vehicles, Medium- and Heavy-Duty Vehicles, Marine Transport, Rail and Off-Road, Others), and Geography (North America, Europe, Asia-Pacific, South America, Middle East and Africa). The Market Forecasts are Provided in Terms of Volume (Million Tons).
Insights and Trends of Gaseous Fuels Market For Internal Combustion (IC) Engines
Lower Total Cost of Ownership Versus Diesel Drives Fleet Conversion Decisions
The operating cost advantage of CNG is an immediate reason for fleet conversion in the Gaseous Fuels Market for IC Engines. Cummins stated in May 2026 that CNG averaged USD 2.99 per diesel gallon equivalent, compared with USD 4.25 for diesel, which produced USD 12,600 in annual fuel savings for 10,000 gallons consumed. The comparison matters most for vehicles with predictable daily routes and high annual mileage, which are also the operating patterns that support the Gaseous Fuels Market for IC Engines. CNG engines also avoid diesel exhaust fluid systems and diesel particulate filters, which reduces exposure to some diesel aftertreatment maintenance needs . A lower and more transparent operating cost can make fuel, maintenance, and station agreements easier for fleet managers to justify. This advantage is strongest when fleets have enough utilization to support dedicated refueling assets or dependable public stations.
Stricter Emission Standards for Heavy-Duty and Urban Fleets Create Compliance-Driven Demand
Emission requirements are raising the value of engine options that can meet fleet operating needs with lower system complexity. The International Maritime Organization approved the IMO Net-Zero Framework in April 2025, establishing measures under MARPOL Annex VI that address greenhouse gas performance in shipping. Similar regulatory direction in road transport supports demand for fuel and engine combinations that can be deployed on fixed urban and freight routes. Compliance requirements are especially relevant for buses, refuse trucks, and distribution vehicles that operate where air-quality rules are closely monitored. Gaseous engines can offer a practical response when operators need to renew fleets but cannot accept battery range, payload, or charging constraints. These requirements create a steadier procurement base for the Gaseous Fuels Market for IC Engines market, even when fuel price differences change.
Uneven Refueling Coverage and High Station Capital Costs Limit Broader Adoption
Station investment remains difficult for smaller operators with irregular routes or low vehicle volumes. A new network must provide enough coverage for fleet confidence, but providers often need proven vehicle demand before committing capital. This circular problem is more acute for LNG because storage and handling requirements are more demanding than for CNG. Infrastructure gaps can also limit the Gaseous Fuels Market for IC Engines in regions with gas resources but limited transport fuel networks. Larger fleets have an advantage because they can justify private stations and spread operating costs across more vehicles. Public corridor expansion and agreements with logistics operators are therefore important for extending adoption beyond early fleet users.
Other drivers and restraints analyzed in the detailed report include:
- Expansion of Refueling Infrastructure Unlocks Fleet Conversion in Constrained Markets
- Factory-Fitted Gaseous-Fuel and Hydrogen-Ready Platforms Broaden Practical Applications
- Natural Gas Price Volatility and Lifecycle Emissions Risk Reduce Fleet Certainty
For complete list of drivers and restraints, kindly check the Table Of Contents.
Segment Analysis
CNG held 51.3% of the Gaseous Fuels Market for IC Engines market share in 2025, supported by long-standing use in urban buses, municipal refuse fleets, and local logistics operations. Its installed vehicle base and mature refueling model give operators a clear starting point for fuel and maintenance planning. CNG is particularly suitable where vehicles return to a depot and use fixed daily routes. LNG serves a different operating need because it can support long-distance trucking and marine activity where compressed gas storage may limit range. LPG or autogas continues to serve passenger cars and light commercial vehicles where conversion capability, taxation, and retail access are established. Dacia expanded its LPG and gasoline bi-fuel lineup in 2026, which shows that OEMs continue to support this fuel option in relevant European vehicle categories.
Hydrogen is projected to grow at a 17.1% CAGR through 2031, the fastest rate among fuel types in the Gaseous Fuels Market for IC Engines market size. The 2025 technical assessment found that hydrogen internal combustion systems can cost less than comparable fuel-cell systems while using familiar engine manufacturing approaches. This supports deployment in operations where utilization, range, and rapid refueling matter more than broad passenger vehicle use. Biomethane offers a separate path because it can use much of the existing gas engine and distribution system. The European Parliament described transport provisions in the Renewable Energy Directive framework as a meaningful policy basis for biomethane deployment. Syngas and synthetic methane remain less developed and have limited commercial use during the forecast period.
Complete Report Scope:
- By Fuel Type
- Compressed Natural Gas (CNG)
- Liquefied Natural Gas (LNG)
- Liquefied Petroleum Gas (LPG / Autogas)
- Biogas / Biomethane
- Hydrogen
- Other Fuel Types (Syngas, Synthetic Methane, etc.)
- By Application
- Light-Duty Vehicles (Passenger Cars and Light Commercial Vehicles)
- Medium- and Heavy-Duty Commercial Vehicles (Trucks and Buses)
- Marine and Waterborne Transport
- Rail and Off-Road Equipment
- Other Applications (Stationary Power Generation, etc.)
- By Geography
- North America
- United States
- Canada
- Mexico
- Europe
- Germany
- United Kingdom
- France
- Russia
- Spain
- Rest of Europe
- Asia-Pacific
- China
- India
- Japan
- South Korea
- ASEAN
- Rest of Asia-Pacific
- South America
- Brazil
- Argentina
- Rest of South America
- Middle East and Africa
- Saudi Arabia
- United Arab Emirates
- South Africa
- Rest of Middle East and Africa
- North America
Geography Analysis
Asia-Pacific held 53.3% regional revenue share in 2025 and is forecast to grow at a 14.8% CAGR through 2031. The region combines large vehicle fleets, established CNG activity, city gas development, and increasing LNG demand for long-haul transport. China remains an important source of commercial vehicle volume, while India is expanding from urban CNG use toward LNG logistics infrastructure. Indraprastha Gas Limited opened the National Capital Region's first LNG station in Dadri in 2026, extending the region's options for long-distance truck operations. Southeast Asia offers additional potential where urban air-quality goals, gas availability, and new CNG programs can converge. Development will still depend on whether station coverage reaches the level needed by fleet operators.
North America and Europe are important technology and regulatory centers for the Gaseous Fuels Market for IC Engines market. In the United States, Clean Energy Fuels is expanding renewable natural gas capacity and stations along freight corridors. Europe has a stronger policy focus on biomethane integration and lifecycle emissions performance. The European Investment Bank's financing for Snam supports new links between biomethane plants and Italy's gas network. This investment can improve access to renewable gas supply for transport users across the Gaseous Fuels Market for IC Engines market. These regions also provide a testing ground for hydrogen combustion equipment, certified marine systems, and fleet service models.
South America, the Middle East and Africa provide positive growth opportunities but have more uneven infrastructure conditions. Gas availability, local fuel price relationships, and public investment can support adoption in selected locations. Argentina is relevant for vehicle conversion activity, while local production of natural gas engines can strengthen regional supply capability. FPT Industrial began producing natural gas engines in Argentina in August 2025 for commercial, agricultural, and urban transport applications. Nigeria's planned CNG network and Saudi gas-to-mobility efforts indicate interest in broader regional deployment in the Gaseous Fuels Market for IC Engines market. Execution will depend on station financing, reliable fuel distribution, and fleet operators that can anchor initial demand.
- Adani Total Gas Limited
- bp p.l.c.
- Chevron Corporation
- China National Petroleum Corporation
- Clean Energy Fuels Corp.
- ENGIE SA
- Eni S.p.A.
- Equinor ASA
- Exxon Mobil Corporation
- FortisBC Energy Inc.
- Gasum Oy
- Indian Oil Corporation Limited
- L'Air Liquide S.A.
- Linde plc
- Repsol, S.A.
- Shell plc
- Snam S.p.A.
- TotalEnergies SE
Additional Benefits:
- The market estimate (ME) sheet in Excel format
- 3 months of analyst support
TABLE OF CONTENTS
1 INTRODUCTION
- 1.1 Study Assumptions and Market Definition
- 1.2 Scope of the Study
2 RESEARCH METHODOLOGY
3 EXECUTIVE SUMMARY
4 MARKET LANDSCAPE
- 4.1 Market Overview
- 4.2 Market Drivers
- 4.2.1 Lower Total Cost of Ownership Versus Diesel
- 4.2.2 Stricter Emission Standards for Heavy-Duty and Urban Fleets
- 4.2.3 Expansion of CNG, LNG and Renewable Gas Refueling Infrastructure
- 4.2.4 Factory-Fitted Gaseous-Fuel Powertrain Adoption
- 4.2.5 Biomethane Compatibility With Existing Gas Engines and Infrastructure
- 4.2.6 Hydrogen-Ready Engine Platforms for Hard-to-Electrify Applications
- 4.3 Market Restraints
- 4.3.1 Uneven Refueling Coverage and High Station Capital Costs
- 4.3.2 Natural Gas Price Volatility and Import Exposure
- 4.3.3 Methane Slip and Lifecycle-Emission Accounting Risk
- 4.3.4 Residual Value Discount for Gaseous-Fuel Vehicles in Electrifying Markets
- 4.4 Supply-Chain Analysis
- 4.5 Technology Outlook
- 4.6 Regulatory Landscape
- 4.7 Porter's Five Forces Analysis
- 4.7.1 Bargaining Power of Suppliers
- 4.7.2 Bargaining Power of Buyers
- 4.7.3 Threat of New Entrants
- 4.7.4 Threat of Substitutes
- 4.7.5 Competitive Rivalry
5 MARKET SIZE AND GROWTH FORECASTS
- 5.1 By Fuel Type
- 5.1.1 Compressed Natural Gas (CNG)
- 5.1.2 Liquefied Natural Gas (LNG)
- 5.1.3 Liquefied Petroleum Gas (LPG / Autogas)
- 5.1.4 Biogas / Biomethane
- 5.1.5 Hydrogen
- 5.1.6 Other Fuel Types (Syngas, Synthetic Methane, etc.)
- 5.2 By Application
- 5.2.1 Light-Duty Vehicles (Passenger Cars and Light Commercial Vehicles)
- 5.2.2 Medium- and Heavy-Duty Commercial Vehicles (Trucks and Buses)
- 5.2.3 Marine and Waterborne Transport
- 5.2.4 Rail and Off-Road Equipment
- 5.2.5 Other Applications (Stationary Power Generation, etc.)
- 5.3 By Geography
- 5.3.1 North America
- 5.3.1.1 United States
- 5.3.1.2 Canada
- 5.3.1.3 Mexico
- 5.3.2 Europe
- 5.3.2.1 Germany
- 5.3.2.2 United Kingdom
- 5.3.2.3 France
- 5.3.2.4 Russia
- 5.3.2.5 Spain
- 5.3.2.6 Rest of Europe
- 5.3.3 Asia-Pacific
- 5.3.3.1 China
- 5.3.3.2 India
- 5.3.3.3 Japan
- 5.3.3.4 South Korea
- 5.3.3.5 ASEAN
- 5.3.3.6 Rest of Asia-Pacific
- 5.3.4 South America
- 5.3.4.1 Brazil
- 5.3.4.2 Argentina
- 5.3.4.3 Rest of South America
- 5.3.5 Middle East and Africa
- 5.3.5.1 Saudi Arabia
- 5.3.5.2 United Arab Emirates
- 5.3.5.3 South Africa
- 5.3.5.4 Rest of Middle East and Africa
- 5.3.1 North America
6 COMPETITIVE LANDSCAPE
- 6.1 Market Concentration
- 6.2 Strategic Moves
- 6.3 Market Share Analysis
- 6.4 Company Profiles (includes Global Level Overview, Market Level Overview, Core Segments, Financials as available, Strategic Information, Market Rank/Share, Products and Services, Recent Developments)
- 6.4.1 Adani Total Gas Limited
- 6.4.2 bp p.l.c.
- 6.4.3 Chevron Corporation
- 6.4.4 China National Petroleum Corporation
- 6.4.5 Clean Energy Fuels Corp.
- 6.4.6 ENGIE SA
- 6.4.7 Eni S.p.A.
- 6.4.8 Equinor ASA
- 6.4.9 Exxon Mobil Corporation
- 6.4.10 FortisBC Energy Inc.
- 6.4.11 Gasum Oy
- 6.4.12 Indian Oil Corporation Limited
- 6.4.13 L'Air Liquide S.A.
- 6.4.14 Linde plc
- 6.4.15 Repsol, S.A.
- 6.4.16 Shell plc
- 6.4.17 Snam S.p.A.
- 6.4.18 TotalEnergies SE
7 MARKET OPPORTUNITIES AND FUTURE OUTLOOK
- 7.1 White-Space and Unmet-Need Assessment

 2026年全球內燃機市場報告
 2026-2030年全球內燃機(ICE)市場
 內燃機市場規模、佔有率和成長分析:按燃料類型、引擎類型、應用、最終用戶和地區分類-2026-2033年產業預測
 內燃機市場-2026-2032年全球市場預測
 全球內燃機(ICE)市場規模、佔有率、趨勢和成長分析報告(2026-2034)2026年全球商用內燃機市場報告全球內燃機市場:市場規模、市場佔有率、成長率、產業分析、依類型、應用和地區劃分的分析以及未來預測(2026-2034)內燃機市場-2025-2030年預測
 內燃機市場-全球產業規模、佔有率、趨勢、機會和預測,按燃料類型(石油、天然氣)、最終用戶(汽車、船舶、飛機)、地區和競爭進行細分,2020-2030 年預測
 中東和非洲內燃機市場佔有率分析、產業趨勢和成長預測(2025-2030 年)