


 |
市場調查報告書
商品編碼
2119008
發電產業取代燃料與原料(AFR):市場佔有率分析、產業趨勢與統計、成長預測(2026-2031 年)Alternate Fuel and Raw Materials (AFR) For Power Generation Industry - Market Share Analysis, Industry Trends & Statistics, Growth Forecasts (2026 - 2031) |
||||||

※ 本網頁內容可能與最新版本有所差異。詳細情況請與我們聯繫。
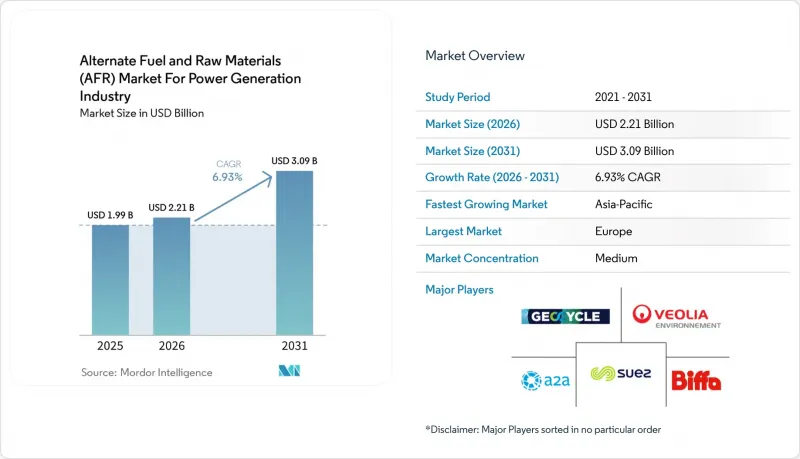
根據 Mordor Intelligence 預測,到 2025 年,發電業取代燃料和原料 (AFR) 的市場規模將達到 19.9 億美元,到 2026 年將達到 22.1 億美元,到 2031 年將達到 30.9 億美元。
預計 2026 年至 2031 年的複合年成長率為 6.93%。
本報告按燃料類型(RDF、SRF 及其他)、原料類型(飛灰及其他)、應用領域(大型發電及其他應用)和地區(北美、歐洲、亞太、南美、中東和非洲)進行細分。市場預測以美元計價。
電力產業取代燃料和原料 (AFR) 市場的洞察與趨勢
可調節的低碳電力需求
隨著風能和太陽能的擴張,對能夠在間歇性電源不可用時發電的電力資產的需求日益成長。垃圾焚化發電可以提供基本負載電力和可用熱能,因此,替代燃料和原料(AFR)與可再生能源發電。 2025年,EEW Energy from Waste和enercity開始合作,透過蒸氣渦輪旁通將漢諾威-拉赫發電廠的可用熱輸出從50兆瓦提高到85兆瓦。 2025年,太陽能發電超過天然氣,成為德國第二大電力來源。這進一步增加了火力發電廠提高運作柔軟性的需求。 EEW於2026年在普雷姆尼茨安裝的15兆瓦時電池儲能系統表明,廢棄物發電廠除了現有的能源供應功能外,還可以提供電網服務。這些能力使營運商不僅能夠回應能源供應,還能響應電網狀況,從而提高長期能源合約的價值。
關於減少垃圾掩埋廢棄物和循環經濟的義務
歐盟《掩埋指令》要求成員國到2035年將送往掩埋的都市垃圾量減少10%。此外,自2030年起,可回收或能源回收的廢棄物掩埋將受到限制,從而推動對有組織的廢棄物管理的需求。這些法規提高了市政當局選擇替代性廢棄物管理方案的重要性,並促進了替代燃料和原料(AFR)市場中關於廢棄物衍生燃料的長期協議,用於發電。 2025年12月,法國修訂了固態回收燃料(SRF)生產和聯合焚燒設施的能源效率要求,增加了工廠層面的性能要求,以促進更高品質燃料的生產。在掩埋受到限制的市場中,設施必須透過回收和能源回收管理可回收廢棄物,確保原料供應的可預測性,同時也提高了許可的處理能力的重要性。品質保證的採購平台可以透過通用的交易流程將燃料品質、熱值和交付條件連結起來,從而進一步支持這些供應。
原料品質和水分含量波動
原料品質和水分含量的變化仍然是燃料生產商和接收設施面臨的直接營運限制因素。熱帶和亞熱帶地區的都市垃圾在季風季節的含水量可達50%至60%(以重量計),這會降低垃圾衍生燃料(RDF)的熱值。 2024年的一項研究表明,永續再生燃料(SRF)生產和利用設施的平均生產效率為69.5%,該數值會根據廢棄物的可燃性而波動。這些差異會影響熱值和排放性能,並可能導致基於品質的合約項下的處罰。永續生質能殘渣的其他用途進一步限制了穩定原料的供應,尤其是在顆粒燃料、熱能和農業應用具有更高利潤潛力的情況下。在發電替代燃料和原料(AFR)市場中,營運商需要建立與分類、分類和品質檢測掛鉤的契約,以避免因原料供應波動而導致利潤率下降。
細分市場分析
截至2025年,RDF(廢棄物衍生燃料)將佔發電替代燃料和原料(AFR)市場的34.8%。這一佔有率反映了歐洲和亞洲水泥窯和發電鍋爐中已建立的聯合加工協議。對於那些需要低成本石化燃料替代品且擁有能夠處理混合品質原料的設施的營運商而言,RDF仍然具有實用價值。固態回收燃料(SRF)是成長最快的燃料細分市場,預計2026年至2031年的複合年成長率將達到8.4%。這種高標準燃料符合EN ISO 21640標準,有助於滿足更嚴格的能源閒置產能利用要求和碳排放法規。
2025年發表於《ACS能源與燃料》期刊的一篇綜述指出,源自地表富集燃料(SRF)氣化的合成氣可用於熱電聯產(CPOWER)和氫基燃料生產。這為能夠穩定供應原料的企業提供了一個替代傳統燃燒混燒的方案。在東南亞和南美洲,生質能能繼續發揮重要作用,因為那裡擁有稻殼、木屑和棕櫚仁殼等豐富的原料。廢棄塑膠具有高熱值,且循環經濟政策優先考慮機械回收,因此其使用受到不可回收成分相關法規的限制。此外,在有機廢棄物能夠與當地燃氣供應系統和區域供熱系統整合的地區,生物甲烷和沼氣的開發正在穩步推進。
區域分析
到2025年,歐洲將佔發電替代燃料和原料(AFR)市場39.5%的佔有率。該地區擁有成熟的資產基礎,更注重現代化改造、熱回收和燃料品管,而非大規模新建設施。歐盟的掩埋框架為將可回收廢棄物從掩埋轉移出去提供了明確的政策基礎。法國2025年的固體回收燃料(SRF)要求表明,國家法規如何將品質標準轉化為工廠層級的運作條件。在北美,既有特許經營模式的垃圾焚化發電項目,也有水泥、紙漿和造紙廠對固體回收燃料日益成長的興趣。
預計到2031年,亞太地區將以8.8%的複合年成長率成長,成為發電領域替代燃料和原料(AFR)市場成長最快的地區。印度2025年的政策規定,除德里-NCR地區外,所有燃煤發電廠必須使用生質能顆粒燃料。該政策也要求德里-NCR地區內的電廠使用由都市固態廢棄物製成的木炭。越南的混燒經驗表明,高混燒率是可以實現的,但要更廣泛地推廣,仍需改進設備和燃料處理方法。推廣速度將取決於基礎設施狀況和政策。
南美洲、中東和非洲的替代燃料和原料(AFR)市場規模相對較小且尚未成熟,這些市場是發電的必要組成部分。巴西的RDF氣化計畫表明,本地專案資料可以支持適合區域廢物流的商業模式。海灣國家正在將垃圾焚化發電納入其循環經濟計劃,而集中式廢棄物管理有助於原料的整合。取得進展的關鍵在於公共工程能否轉型為具有資金籌措可行性的獨立發電商(IPP)模式。
其他好處:
- Excel格式的市場預測(ME)表
- 3個月的分析師支持
目錄
第1章:引言
- 市場分析與定義的前提條件
- 分析範圍
第2章 分析方法
第3章執行摘要
第4章 市場狀況
- 市場概覽
- 市場促進因素
- 可調節的低碳電力需求
- 減少掩埋廢棄物和促進循環經濟的強制性要求。
- 工業煤和石油焦的替代品
- 將沼氣和生物甲烷與現有天然氣基礎設施整合
- 品質保證的AFR採購平台
- 碳負排放電力和生物來源碳貨幣化
- 市場限制因素
- 原料品質和水分含量的變化
- 物流成本高且經濟運輸距離有限。
- 永續生質能殘餘物的競爭性用途
- 與授權、社區接受度和減排維修相關的風險。
- 供應鏈分析
- 監理情勢
- 技術展望
- 波特五力分析
第5章:預測市場規模與成長率
- 按燃料類型
- 廢棄物衍生燃料(RDF)
- 固態回收燃料(SRF)
- 生質能
- 廢棄塑膠
- 其他類型的燃料
- 依原料類型
- 飛灰
- 高爐爐渣
- 鑄造用砂
- 煉鋼渣
- 其他類型的原料
- 透過使用
- 大規模發電
- 垃圾焚化發電發電廠
- 燃煤發電廠的混燒
- 熱電聯產
- 其他用途
- 按地區
- 北美洲
- 美國
- 加拿大
- 墨西哥
- 歐洲
- 德國
- 法國
- 義大利
- 西班牙
- 英國
- 波蘭
- 俄羅斯
- 其他歐洲國家
- 亞太地區
- 中國
- 印度
- 日本
- 韓國
- 澳洲
- 印尼
- 越南
- 泰國
- 其他亞太國家
- 南美洲
- 巴西
- 阿根廷
- 智利
- 其他南美國家
- 中東和非洲
- 沙烏地阿拉伯
- 阿拉伯聯合大公國
- 埃及
- 南非
- 摩洛哥
- 其他中東和非洲國家
- 北美洲
第6章 競爭情勢
- 市場集中度
- 策略趨勢
- 市佔率分析
- 公司簡介
- A2A SpA
- Andusia Recovered Fuels Limited
- Averda International Limited
- Biffa Limited
- Blue Phoenix Group BV
- Covanta Holding Corporation
- Ecoserv
- EEW Energy from Waste GmbH
- Enva Group Limited
- FCC Servicios Medio Ambiente Holding, SAU
- Geminor AS
- Geocycle SA
- Indaver NV
- PreZero International GmbH
- REMONDIS SE & Co. KG
- Renewi plc
- SARIA SE & Co. KG
- SUEZ SA
- Veolia Environnement SA
- Waste Management, Inc.
第7章 市場機會與未來展望
According to Mordor Intelligence, the alternate fuel and Raw Materials Market For Power Generation Industry size is projected to be USD 1.99 billion in 2025, USD 2.21 billion in 2026, and reach USD 3.09 billion by 2031, at a CAGR of 6.93% from 2026 to 2031.
This report is Segmented by Fuel Type (RDF, SRF, and Others), Raw Material Type (Fly Ash, and Others), Applications (Utility-Scale Power Generation, and Other Applications), and Geography (North America, Europe, Asia-Pacific, South America, and Middle East and Africa). The Market Forecasts are Provided in Terms of Value (USD).
Insights and Trends of Alternate Fuel and Raw Materials (AFR) Market For Power Generation Industry
Dispatchable Low-Carbon Power Demand
Wind and solar growth have increased the need for power assets that can produce electricity when intermittent sources are unavailable. Waste-to-energy plants can supply base-load electricity and useful heat, which gives the alternate fuel and raw materials for power generation market a role alongside renewable generation. EEW Energy from Waste and enercity started work in 2025 to raise usable heat output at Hannover-Lahe from 50 MW to 85 MW through a steam turbine bypass. Germany's solar generation moved into 2nd place in the national power mix in 2025, ahead of natural gas, which increased the case for thermal plants to improve their operating flexibility. EEW's 15 MWh battery storage installation at Premnitz in 2026 shows how a thermal waste plant can add grid services to its existing energy role. These capabilities can improve the value of long-term energy contracts because operators can respond to grid conditions as well as supply energy.
Landfill Diversion and Circular-Economy Mandates
The EU Landfill Directive requires member states to reduce municipal waste going to landfill to 10% by 2035. It also restricts the landfilling of waste suitable for recycling or energy recovery from 2030, which supports demand for organized waste treatment. These rules make disposal alternatives more important for municipalities and support long-term arrangements for waste-derived fuels in the alternate fuel and raw materials for power generation market. France revised energy-efficiency requirements for solid recovered fuel production and co-incineration installations in December 2025, adding plant-level performance conditions that encourage higher-quality fuel preparation. In markets with landfill restrictions, facilities must manage recoverable waste through recycling or energy recovery, which supports predictable feedstock flows but also increases the importance of permit-ready capacity. Quality-assured procurement platforms can further support these flows by linking fuel quality, calorific value, and delivery terms in a common transaction process.
Feedstock Quality and Moisture Variability
Feedstock quality and moisture variability remain a direct operating constraint for fuel producers and receiving facilities. Municipal waste in tropical and subtropical areas can contain 50% to 60% moisture by weight during monsoon periods, reducing the calorific value of RDF. A 2024 study found that manufacturing efficiency at SRF production and use facilities averaged 69.5%, with results varying according to the combustible content in incoming waste. These differences affect calorific value and emissions performance, and they can lead to penalties under quality-band contracts. Competing uses for sustainable biomass residues can further limit access to consistent material, especially where pellet, heat, or agricultural uses offer stronger returns. Operators need screening, sorting, and contracts tied to measured quality if the alternate fuel and raw materials for power generation market is to avoid margin pressure from inconsistent input streams.
Other drivers and restraints analyzed in the detailed report include:
- Industrial Coal and Petcoke Substitution
- Carbon-Negative Power and Biogenic Carbon Monetization
- High Logistics Cost and Limited Economical Haul Distance
For complete list of drivers and restraints, kindly check the Table Of Contents.
Segment Analysis
Refuse-derived fuel held 34.8% of the alternate fuel and raw materials for power generation market share in 2025. Its position reflects established co-processing agreements at cement kilns and utility boilers across Europe and Asia. RDF remains useful where operators need a lower-cost substitute for fossil fuels and have equipment designed for mixed-quality material. Solid recovered fuel is the fastest-growing fuel sub-segment, with an 8.4% CAGR from 2026 to 2031. The higher-specification fuel complies with EN ISO 21640 and can support tighter energy offtake and carbon-compliance requirements.
A 2025 review in ACS Energy & Fuels found that SRF-derived syngas from gasification can support combined heat and power generation and hydrogen-based fuel production. This creates options beyond traditional combustion co-firing for suppliers that can provide consistent material. Biomass remains important in Southeast Asia and South America, where rice husks, wood chips, and palm kernel shells can provide available feedstocks. Waste plastics have high calorific value, but their use depends on rules for non-recyclable fractions because circular economy policies give priority to mechanical recycling. Biomethane and biogas are also developing where organic waste can be linked with local gas and district heating systems.
Complete Report Scope:
- By Fuel Type
- Refuse-Derived Fuel (RDF)
- Solid Recovered Fuel (SRF)
- Biomass
- Waste Plastics
- Other Fuel Types
- By Raw Material Type
- Fly Ash
- Blast Furnace Slag
- Foundry Sand
- Steel Slag
- Other Raw Material Types
- By Application
- Utility-Scale Power Generation
- Waste-to-Energy Plants
- Coal-Fired Power Plant Co-Firing
- Combined Heat and Power
- Other Applications
- By Geography
- North America
- United States
- Canada
- Mexico
- Europe
- Germany
- France
- Italy
- Spain
- United Kingdom
- Poland
- Russia
- Rest of Europe
- Asia-Pacific
- China
- India
- Japan
- South Korea
- Australia
- Indonesia
- Vietnam
- Thailand
- Rest of Asia-Pacific
- South America
- Brazil
- Argentina
- Chile
- Rest of South America
- Middle East and Africa
- Saudi Arabia
- United Arab Emirates
- Egypt
- South Africa
- Morocco
- Rest of Middle East and Africa
- North America
Geography Analysis
Europe accounted for 39.5% of the alternate fuel and raw materials for power generation market share in 2025. The region has a mature asset base where modernization, heat recovery, and fuel quality management are more important than broad new capacity additions. The EU landfill framework creates a clear policy basis for diverting recoverable waste from disposal. France's 2025 SRF requirements show how national rules can move quality standards into plant-level operating conditions. North America combines concession-led waste-to-energy operations with growing interest in SRF at cement and pulp and paper facilities.
Asia-Pacific is forecast to grow at an 8.8% CAGR through 2031, making it the fastest-growing regional part of the alternate fuel and raw materials for power generation market. India's 2025 policy created mandatory biomass pellet demand across coal-based thermal power plants outside Delhi-NCR. The policy also introduced a municipal solid waste charcoal requirement for plants in Delhi-NCR. Vietnam's co-firing activity shows that high blending levels can be achieved, although equipment and fuel-handling changes remain necessary for wider use. The pace of adoption depends on infrastructure as much as policy.
South America and Middle East and Africa have smaller, less mature positions within the alternate fuel and raw materials for power generation market. Brazil's RDF gasification work indicates that local project data can support commercial models suited to regional waste streams. Gulf countries are incorporating waste-to-energy within circular economy programs, and centralized waste control can aid feedstock aggregation. Progress depends on whether public projects can move to bankable independent power producer structures.
- A2A S.p.A.
- Andusia Recovered Fuels Limited
- Averda International Limited
- Biffa Limited
- Blue Phoenix Group B.V.
- Covanta Holding Corporation
- Ecoserv
- EEW Energy from Waste GmbH
- Enva Group Limited
- FCC Servicios Medio Ambiente Holding, S.A.U.
- Geminor AS
- Geocycle SA
- Indaver NV
- PreZero International GmbH
- REMONDIS SE & Co. KG
- Renewi plc
- SARIA SE & Co. KG
- SUEZ S.A.
- Veolia Environnement S.A.
- Waste Management, Inc.
Additional Benefits:
- The market estimate (ME) sheet in Excel format
- 3 months of analyst support
TABLE OF CONTENTS
1 INTRODUCTION
- 1.1 Study Assumptions and Market Definition
- 1.2 Scope of the Study
2 RESEARCH METHODOLOGY
3 EXECUTIVE SUMMARY
4 MARKET LANDSCAPE
- 4.1 Market Overview
- 4.2 Market Drivers
- 4.2.1 Dispatchable Low-Carbon Power Demand
- 4.2.2 Landfill Diversion and Circular-Economy Mandates
- 4.2.3 Industrial Coal and Petcoke Substitution
- 4.2.4 Biogas and Biomethane Integration with Existing Gas Infrastructure
- 4.2.5 Quality-Assured AFR Procurement Platforms
- 4.2.6 Carbon-Negative Power and Biogenic Carbon Monetization
- 4.3 Market Restraints
- 4.3.1 Feedstock Quality and Moisture Variability
- 4.3.2 High Logistics Cost and Limited Economical Haul Distance
- 4.3.3 Competing Uses for Sustainable Biomass Residues
- 4.3.4 Permitting, Community Acceptance and Emissions Retrofit Risk
- 4.4 Supply-Chain Analysis
- 4.5 Regulatory Landscape
- 4.6 Technological Outlook
- 4.7 Porter's Five Forces Analysis
- 4.7.1 Bargaining Power of Suppliers
- 4.7.2 Bargaining Power of Buyers
- 4.7.3 Threat of New Entrants
- 4.7.4 Threat of Substitutes
- 4.7.5 Competitive Rivalry
5 MARKET SIZE AND GROWTH FORECASTS
- 5.1 By Fuel Type
- 5.1.1 Refuse-Derived Fuel (RDF)
- 5.1.2 Solid Recovered Fuel (SRF)
- 5.1.3 Biomass
- 5.1.4 Waste Plastics
- 5.1.5 Other Fuel Types
- 5.2 By Raw Material Type
- 5.2.1 Fly Ash
- 5.2.2 Blast Furnace Slag
- 5.2.3 Foundry Sand
- 5.2.4 Steel Slag
- 5.2.5 Other Raw Material Types
- 5.3 By Application
- 5.3.1 Utility-Scale Power Generation
- 5.3.2 Waste-to-Energy Plants
- 5.3.3 Coal-Fired Power Plant Co-Firing
- 5.3.4 Combined Heat and Power
- 5.3.5 Other Applications
- 5.4 By Geography
- 5.4.1 North America
- 5.4.1.1 United States
- 5.4.1.2 Canada
- 5.4.1.3 Mexico
- 5.4.2 Europe
- 5.4.2.1 Germany
- 5.4.2.2 France
- 5.4.2.3 Italy
- 5.4.2.4 Spain
- 5.4.2.5 United Kingdom
- 5.4.2.6 Poland
- 5.4.2.7 Russia
- 5.4.2.8 Rest of Europe
- 5.4.3 Asia-Pacific
- 5.4.3.1 China
- 5.4.3.2 India
- 5.4.3.3 Japan
- 5.4.3.4 South Korea
- 5.4.3.5 Australia
- 5.4.3.6 Indonesia
- 5.4.3.7 Vietnam
- 5.4.3.8 Thailand
- 5.4.3.9 Rest of Asia-Pacific
- 5.4.4 South America
- 5.4.4.1 Brazil
- 5.4.4.2 Argentina
- 5.4.4.3 Chile
- 5.4.4.4 Rest of South America
- 5.4.5 Middle East and Africa
- 5.4.5.1 Saudi Arabia
- 5.4.5.2 United Arab Emirates
- 5.4.5.3 Egypt
- 5.4.5.4 South Africa
- 5.4.5.5 Morocco
- 5.4.5.6 Rest of Middle East and Africa
- 5.4.1 North America
6 COMPETITIVE LANDSCAPE
- 6.1 Market Concentration
- 6.2 Strategic Moves
- 6.3 Market Share Analysis
- 6.4 Company Profiles (includes Global Level Overview, Market Level Overview, Core Segments, Financials as available, Strategic Information, Market Rank/Share, Products and Services, Recent Developments)
- 6.4.1 A2A S.p.A.
- 6.4.2 Andusia Recovered Fuels Limited
- 6.4.3 Averda International Limited
- 6.4.4 Biffa Limited
- 6.4.5 Blue Phoenix Group B.V.
- 6.4.6 Covanta Holding Corporation
- 6.4.7 Ecoserv
- 6.4.8 EEW Energy from Waste GmbH
- 6.4.9 Enva Group Limited
- 6.4.10 FCC Servicios Medio Ambiente Holding, S.A.U.
- 6.4.11 Geminor AS
- 6.4.12 Geocycle SA
- 6.4.13 Indaver NV
- 6.4.14 PreZero International GmbH
- 6.4.15 REMONDIS SE & Co. KG
- 6.4.16 Renewi plc
- 6.4.17 SARIA SE & Co. KG
- 6.4.18 SUEZ S.A.
- 6.4.19 Veolia Environnement S.A.
- 6.4.20 Waste Management, Inc.
7 MARKET OPPORTUNITIES AND FUTURE OUTLOOK
- 7.1 White-Space and Unmet-Need Assessment


