


 |
市場調查報告書
商品編碼
2118972
磷酸鹽:市場佔有率分析、行業趨勢和統計數據、成長預測(2026-2031 年)Phosphate - Market Share Analysis, Industry Trends & Statistics, Growth Forecasts (2026 - 2031) |
||||||

※ 本網頁內容可能與最新版本有所差異。詳細情況請與我們聯繫。
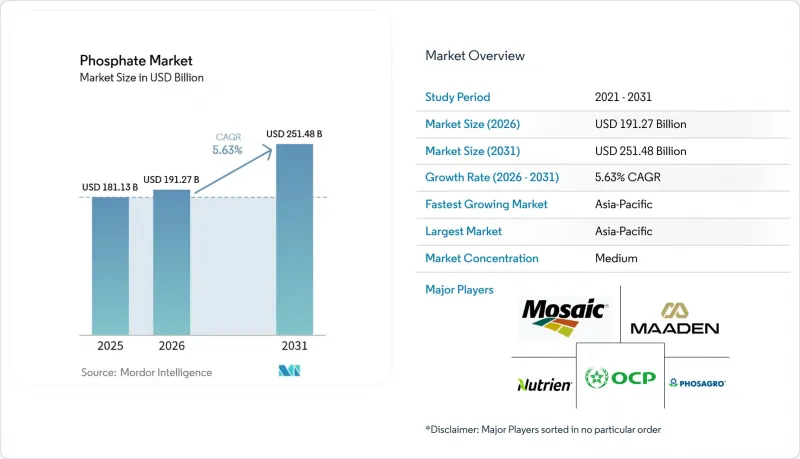
根據 Mordor Intelligence 估計,磷酸鹽市場在 2025 年的價值為 1811.3 億美元,從 2026 年的 1912.7 億美元成長到 2031 年的 2514.8 億美元,預計在預測期(2026-2031 年)內63%。
本報告按產品類型(磷酸銨、磷酸鈣等)、等級(食品和飼料、醫藥等)、終端用戶行業(農藥、食品和飲料等)以及地區(亞太地區、北美地區、歐洲地區、南美地區、中東和非洲)進行細分。市場預測以美元計價。
全球磷酸鹽市場趨勢及洞察
擴大磷酸鹽化學品在水處理和污水管理的應用。
磷酸鹽類腐蝕抑制劑和阻垢劑在城市和工業水系統中繼續發揮至關重要的作用。隨著排放標準日益嚴格,各國政府正擴大水處理能力。美國和歐洲的水質法規和化學品合規要求促使供水事業使用水處理化學品和回收試劑。污水處理廠也正從消耗磷酸鹽轉向回收鳥糞石,鳥糞石可作為緩效肥料出售。 2026年的一項研究發現,鳥糞石和鉀鳥糞石的結晶可以從洗衣廢水中回收磷,擴大了可回收工業污水的類型。東南亞和撒哈拉以南非洲地區水處理基礎設施的擴建增加了對磷酸鹽的需求,既包括作為水處理化學品的需求,也包括作為回收原料的需求。
動物營養產業的成長推動了飼料磷酸鹽需求的成長。
全球畜牧業的規模以及家禽和生豬的營養需求,支撐著飼料磷酸鹽市場的發展。肉雞飼料通常需要磷來促進骨骼發育和蛋殼形成,而生豬在生長高峰期則需要更多的磷。在飼料供應鏈中,純度標準的重要性日益凸顯,這使得擁有可控加工流程和完善文件的生產商更具優勢。根據PhosAgro公司報告,該公司2025年前九個月的磷肥和飼料磷酸鹽產量達702萬噸,比去年同期成長5.5%。作為其長期發展計劃的一部分,該公司正在推進其巴拉科沃工廠的磷酸二氫鈣現代化重建項目。此外,水產飼料生產商也正在使用經認證的合成磷酸鹽,以提高飼料的消化率和可追溯性,從而滿足出口市場的需求。
磷礦石資源供應有限且地理分佈集中
由於磷無法從大氣中生成,且依賴有限的礦床,全球磷酸鹽市場極易受到蘊藏量集中度、出口決策和物流中斷的影響。儘管中國和歐盟佔據了全球磷礦石產量的大部分,但歐盟的國內蘊藏量有限。因此,依賴進口的化肥生產商被迫依賴長期供應契約,幾乎沒有其他快速的替代方案。美國於2026年啟動了《國防生產法》以確保元素磷的供應,凸顯了供應可靠性日益成長的戰略重要性。中國的出口限制和高昂的硫磺成本可能會進一步影響主要產區以外買家的磷供應、價格和生產計畫。
細分市場分析
到2025年,磷酸銨將佔產品類型銷售額的46.22%,成為最大的產品類型。這一地位反映了亞洲、北美和南美全部區域對磷酸二銨(DAP)和磷酸一銨(MAP)的持續需求。磷酸鉀是成長最快的產品類型,預計到2031年複合年成長率將達到6.47%。其需求主要集中在特種作物的養分管理、採用高壓滴灌的園藝以及需要嚴格控制磷鉀比例的食品配料領域。這些應用包括咖啡伴侶的緩衝和非乳製蛋白的穩定性。到2025年,巴西的化肥出貨量將達到4,911萬噸,其中磷酸鹽產品佔進口需求的很大一部分,凸顯了大規模農業市場在磷酸銨消費中的重要角色。
磷酸鹽的應用領域正在不斷多元化,涵蓋肥料和工業用途。預計到2024年,用於磷酸鋰鐵正極材料的電池級磷酸鹽將佔中國工業磷酸鹽需求的15%,且需求量將以每年超過20%的速度成長。磷酸鈣被用作藥品和營養補充劑的賦形劑,這些領域對品質標準要求極高。磷酸鈉則繼續在食品加工、清潔劑配方和鍋爐水處理等領域中發揮傳統作用。其他磷酸鹽,包括多聚磷酸鹽和電子級試劑,則用於半導體製造和特殊工業清洗。在這些小規模應用中,對於專業製造商而言,配方品質和客戶認可比產量更為重要。
區域分析
截至2025年,亞太地區將佔磷酸鹽市場44.81%的佔有率,預計到2031年將以6.14%的複合年成長率成長。農業集約化、食品加工和電池材料對磷酸鹽的需求是該地區磷酸鹽消費的主要驅動力。中國磷酸鹽產量約佔全球總產量的41%,而其已探明蘊藏量僅佔5%,引發了人們對資源枯竭和保護的擔憂。印度仍然是磷酸二銨(DAP)的主要進口國,其補貼政策支撐了化肥的強勁需求。 2026年2月,CRISIL評級公司宣布,預計未來三個會計年度印度複合肥產能將成長25%。日本和韓國支撐著對特種用途和醫藥級磷酸鹽的需求,而越南和印尼則代表快速成長的飼料和水產養殖市場。
北美和歐洲都是磷酸鹽市場的重要淨進口地區,但它們的因應方式有所不同。在北美,Mosaic 和 Nutriene 兩家公司佔據了該地區磷酸鹽產能的 90% 以上。 Nutriene 正在考慮其磷酸鹽業務的未來發展方向,而 Mosaic 則已調整了其位於路易斯安那州和巴託的工廠的產量,以應對 2026 年硫磺成本的上漲。美國 2025 年以後的政策措施著重於增強國內供給的韌性。在歐洲,碳排放法規和合規要求正被用來影響進口化肥的來源。德國、法國和義大利的下游加工商正在重新審視長期以來依賴摩洛哥磷酸鹽的供應鏈。
南美洲和中東/非洲在磷酸鹽市場中各自扮演著獨特的角色。巴西是主要的進口來源國。在2025年全球供應趨緊的情況下,阿根廷仍然是對磷酸一銨(MAP)價格高度敏感的買家,並從沙烏地阿拉伯進口化肥。摩洛哥的OCP公司正在投資化肥生產能力、綠色氨、海水淡化和可再生能源基礎設施,目標是到2028年將其化肥產能提高900萬噸。沙烏地阿拉伯的Maaden公司作為多元化生產商持續發展壯大,而南非的需求與糧食安全密切相關。安哥拉也正透過Cavinda磷酸鹽化肥廠計畫擴大其區域供給能力。
其他好處:
- Excel格式的市場預測(ME)表
- 3個月的分析師支持
目錄
第1章:引言
- 研究假設和市場定義
- 調查範圍
第2章:調查方法
第3章執行摘要
第4章 市場狀況
- 市場概覽
- 市場促進因素
- 擴大磷酸鹽化學品在水處理和污水管理的應用。
- 受動物營養產業成長的推動,飼料磷酸鹽的需求正在擴大。
- 磷回收和循環利用技術的廣泛應用
- 擴大對綜合磷酸鹽開採和加工企業的投資
- 對永續和低碳肥料解決方案的需求日益成長
- 市場限制因素
- 磷礦石資源供應有限且地理分佈集中
- 嚴格的環境法規,涉及磷酸鹽排放和水污染
- 食品級、飼料和藥品級產品均有嚴格的法規和品質合規要求。
- 價值鏈分析
- 波特五力分析
第5章 市場規模與成長預測
- 依產品類型
- 磷酸銨
- 磷酸鈣
- 磷酸
- 磷酸鉀
- 磷酸鈉
- 其他磷酸鹽
- 按年級
- 食品級及飼料級
- 醫藥級
- 工業級
- 按最終用戶行業分類
- 農業化學品
- 食品/飲料
- 動物飼料
- 清潔劑和清潔劑
- 藥物和個人護理
- 水處理
- 按地區
- 亞太地區
- 中國
- 印度
- 日本
- 韓國
- 其他亞太國家
- 北美洲
- 美國
- 加拿大
- 墨西哥
- 歐洲
- 德國
- 英國
- 法國
- 義大利
- 俄羅斯
- 其他歐洲國家
- 南美洲
- 巴西
- 阿根廷
- 其他南美國家
- 中東和非洲
- 沙烏地阿拉伯
- 南非
- 其他中東和非洲國家
- 亞太地區
第6章 競爭情勢
- 市場集中度
- 策略趨勢
- 市佔率和排名分析
- 公司簡介
- Chemische Fabrik Budenheim KG
- EuroChem Group
- Fosfitalia Group
- Guizhou Phosphate Chemical Group
- Hubei Xingfa Chemicals Group Co., Ltd.
- ICL Group Ltd.
- Innophos Holdings, Inc.
- Jordan Phosphate Mines Company(JPMC)
- Maaden
- Mosaic
- Nutrien
- OCP SA
- PhosAgro Group
- Prayon SA
- Reciphos SAS
- WENGFU GROUP CO. LTD.
- Yara International ASA
- Yunnan Yuntianhua Co., Ltd.
第7章 市場機會與未來展望
According to Mordor Intelligence, the phosphate market size was estimated at USD 181.13 billion in 2025 and is projected to grow from USD 191.27 billion in 2026 to USD 251.48 billion by 2031, at a CAGR of 5.63% over the forecast period (2026-2031).
This report is Segmented by Product Type (Ammonium Phosphate, Calcium Phosphate, and More), Grade (Food and Feed Grade, Pharmaceutical Grade, and More), End-User Industry (Agrochemicals, Food and Beverages, and More), and Geography (Asia-Pacific, North America, Europe, South America, and Middle-East and Africa). The Market Forecasts are Provided in Terms of Value (USD).
Global Phosphate Market Trends and Insights
Increasing Use of Phosphate Chemicals in Water Treatment and Wastewater Management
Phosphate corrosion inhibitors and scale-control compounds remain important in municipal and industrial water systems. Governments are expanding treatment capacity as discharge requirements become more stringent. Water regulations in the United States and Europe, along with chemical compliance requirements, encourage utilities to use treatment chemicals and recovery reagents. Wastewater plants are also shifting from phosphate consumption toward struvite recovery, which can be sold as a slow-release fertilizer. A 2026 study found that struvite and struvite-K crystallization can recover phosphorus from laundry effluent, broadening the range of industrial wastewater streams that can support recovery. Expanding treatment infrastructure in Southeast Asia and sub-Saharan Africa is increasing demand for phosphate in both water-treatment chemicals and recovery inputs.
Rising Demand for Feed-Grade Phosphates Driven by Growth in Animal Nutrition
Feed-grade phosphate demand supports the phosphate market through the scale of global livestock production and the nutritional requirements of poultry and swine. Broiler diets generally require phosphorus for bone development and shell formation, while swine requirements increase during peak growth stages. Purity standards are becoming more important in feed supply chains, favoring producers with controlled processing and documentation. PhosAgro reported that its phosphate-based fertilizer and feed-phosphate production rose 5.5% year over year to 7.02 million tons in the first nine months of 2025. Its Balakovo monocalcium phosphate modernization program was advancing as part of the company's long-term development plan. Certified synthetic phosphate salts are also being used by aquafeed mills seeking improved digestibility and traceability for export markets.
Limited Availability and Geographic Concentration of Phosphate Rock Resources
Phosphorus cannot be produced from the atmosphere and depends on finite mined deposits, making the global phosphate market sensitive to reserve concentration, export decisions, and logistics disruptions. OCP and China account for a large share of global phosphate rock output, while the European Union has limited domestic reserves. Import-dependent fertilizer producers therefore rely on long-term supply arrangements and have few rapid alternatives. The United States invoked the Defense Production Act in 2026 to secure supplies of elemental phosphorus, highlighting the growing strategic importance of supply reliability. China's export restrictions and high sulfur costs can further affect availability, pricing, and production planning for buyers outside major producing regions.
Other drivers and restraints analyzed in the detailed report include:
- Expanding Adoption of Phosphorus Recovery and Recycling Technologies
- Increasing Demand for Sustainable and Low-Carbon Fertilizer Solutions
- Stringent Environmental Regulations Related to Phosphate Emissions and Water Pollution
For complete list of drivers and restraints, kindly check the Table Of Contents.
Segment Analysis
Ammonium phosphate held 46.22% of product-category revenue in 2025, making it the largest product category. This position reflects sustained demand for diammonium phosphate (DAP) and monoammonium phosphate (MAP) across grain-producing regions in Asia, North America, and South America. Potassium phosphate is the fastest-growing product type, with a projected CAGR of 6.47% through 2031. Demand is concentrated in specialty crop nutrition, high-pressure drip-irrigation horticulture, and food ingredients that require controlled phosphorus-to-potassium ratios. These uses include coffee-creamer buffering and non-dairy protein stabilization. Brazil's fertilizer deliveries reached 49.11 million tons in 2025, with phosphate products accounting for a material share of import demand, underscoring the importance of large agricultural markets to ammonium phosphate consumption.
Phosphoric acid is developing into distinct fertilizer and industrial application streams. Battery-grade phosphoric acid for lithium iron phosphate cathodes represented an estimated 15% of China's industrial phosphoric acid demand in 2024, with demand growing at more than 20% annually from its current base. Calcium phosphate is used as a pharmaceutical excipient and in nutraceutical products, where quality specifications are important. Sodium phosphate retains established roles in food processing, detergent formulations, and boiler-water treatment. Other phosphates, including polyphosphates and electronic-grade reagents, serve semiconductor production and specialty industrial cleaning. These smaller applications give specialty producers areas where formulation quality and customer approvals matter more than volume.
Complete Report Scope:
- By Product Type
- Ammonium Phosphate
- Calcium Phosphate
- Phosphoric Acid
- Potassium Phosphate
- Sodium Phosphate
- Other Phosphates
- By Grade
- Food and Feed Grade
- Pharmaceutical Grade
- Industrial Grade
- By End-User Industry
- Agrochemicals
- Food and Beverages
- Animal Feed
- Cleansers and Detergents
- Pharmaceutical and Personal Care
- Water Treatment
- By Geography
- Asia-Pacific
- China
- India
- Japan
- South Korea
- Rest of Asia-Pacific
- North America
- United States
- Canada
- Mexico
- Europe
- Germany
- United Kingdom
- France
- Italy
- Russia
- Rest of Europe
- South America
- Brazil
- Argentina
- Rest of South America
- Middle-East and Africa
- Saudi Arabia
- South Africa
- Rest of Middle-East and Africa
- Asia-Pacific
Geography Analysis
Asia-Pacific accounted for 44.81% of the phosphate market in 2025 and is forecast to grow at a 6.14% CAGR through 2031. Agricultural intensification, food processing, and demand for battery materials support phosphate consumption in the region. China produces an estimated 41% of global phosphate output from 5% of known reserves, raising concerns about resource depletion and conservation. India remains a major DAP importer, and its subsidy system supports large fertilizer demand. CRISIL Ratings stated in February 2026 that India's complex fertilizer capacity is expected to increase by 25% over the next three fiscal years. Japan and South Korea support specialty and pharmaceutical-grade demand, while Vietnam and Indonesia represent growing feed and aquaculture markets.
North America and Europe are both significant net-importing regions in the phosphate market, though their approaches differ. In North America, Mosaic and Nutrien account for more than 90% of regional phosphate production capacity. Nutrien is evaluating options for its phosphate division, while Mosaic adjusted output at its Louisiana and Bartow facilities amid high sulfur costs in 2026. U.S. policy actions since 2025 have focused on domestic supply resilience. Europe is using carbon and compliance requirements to influence the sourcing of imported fertilizers. Downstream processors in Germany, France, and Italy are reviewing supply chains that have long relied on Moroccan phosphate flows.
South America, the Middle-East, and Africa each have distinct roles in the phosphate market. Brazil is a major import destination. Argentina remains a price-sensitive MAP buyer and imported cargoes from Saudi Arabia during tighter global supply conditions in 2025. Morocco's OCP is investing in fertilizer capacity, green ammonia, desalination, and renewable energy infrastructure, aiming to add 9 million tons of fertilizer production capacity by 2028. Saudi Arabia's Maaden is growing as an integrated producer, while South African demand is tied to food security. Angola is also adding regional supply capacity through the Cabinda Phosphate Fertilizer Plant Project.
- Chemische Fabrik Budenheim KG
- EuroChem Group
- Fosfitalia Group
- Guizhou Phosphate Chemical Group
- Hubei Xingfa Chemicals Group Co., Ltd.
- ICL Group Ltd.
- Innophos Holdings, Inc.
- Jordan Phosphate Mines Company (JPMC)
- Maaden
- Mosaic
- Nutrien
- OCP S.A.
- PhosAgro Group
- Prayon SA
- Reciphos SAS
- WENGFU GROUP CO. LTD.
- Yara International ASA
- Yunnan Yuntianhua Co., Ltd.
Additional Benefits:
- The market estimate (ME) sheet in Excel format
- 3 months of analyst support
TABLE OF CONTENTS
1 Introduction
- 1.1 Study Assumptions and Market Definition
- 1.2 Scope of the Study
2 Research Methodology
3 Executive Summary
4 Market Landscape
- 4.1 Market Overview
- 4.2 Market Drivers
- 4.2.1 Increasing Use of Phosphate Chemicals in Water Treatment and Wastewater Management
- 4.2.2 Rising Demand for Feed-Grade Phosphates Driven by Growth in Animal Nutrition
- 4.2.3 Expanding Adoption of Phosphorus Recovery and Recycling Technologies
- 4.2.4 Growing Investments in Integrated Phosphate Mining and Processing Operations
- 4.2.5 Increasing Demand for Sustainable and Low-Carbon Fertilizer Solutions
- 4.3 Market Restraints
- 4.3.1 Limited Availability and Geographic Concentration of Phosphate Rock Resources
- 4.3.2 Stringent Environmental Regulations Related to Phosphate Emissions and Water Pollution
- 4.3.3 Stringent Regulatory and Quality Compliance Requirements for Food, Feed, and Pharmaceutical Grades
- 4.4 Value Chain Analysis
- 4.5 Porter's Five Forces Analysis
- 4.5.1 Threat of New Entrants
- 4.5.2 Bargaining Power of Suppliers
- 4.5.3 Bargaining Power of Buyers
- 4.5.4 Threat of Substitutes
- 4.5.5 Competitive Rivalry
5 Market Size and Growth Forecasts (Value)
- 5.1 By Product Type
- 5.1.1 Ammonium Phosphate
- 5.1.2 Calcium Phosphate
- 5.1.3 Phosphoric Acid
- 5.1.4 Potassium Phosphate
- 5.1.5 Sodium Phosphate
- 5.1.6 Other Phosphates
- 5.2 By Grade
- 5.2.1 Food and Feed Grade
- 5.2.2 Pharmaceutical Grade
- 5.2.3 Industrial Grade
- 5.3 By End-User Industry
- 5.3.1 Agrochemicals
- 5.3.2 Food and Beverages
- 5.3.3 Animal Feed
- 5.3.4 Cleansers and Detergents
- 5.3.5 Pharmaceutical and Personal Care
- 5.3.6 Water Treatment
- 5.4 By Geography
- 5.4.1 Asia-Pacific
- 5.4.1.1 China
- 5.4.1.2 India
- 5.4.1.3 Japan
- 5.4.1.4 South Korea
- 5.4.1.5 Rest of Asia-Pacific
- 5.4.2 North America
- 5.4.2.1 United States
- 5.4.2.2 Canada
- 5.4.2.3 Mexico
- 5.4.3 Europe
- 5.4.3.1 Germany
- 5.4.3.2 United Kingdom
- 5.4.3.3 France
- 5.4.3.4 Italy
- 5.4.3.5 Russia
- 5.4.3.6 Rest of Europe
- 5.4.4 South America
- 5.4.4.1 Brazil
- 5.4.4.2 Argentina
- 5.4.4.3 Rest of South America
- 5.4.5 Middle-East and Africa
- 5.4.5.1 Saudi Arabia
- 5.4.5.2 South Africa
- 5.4.5.3 Rest of Middle-East and Africa
- 5.4.1 Asia-Pacific
6 Competitive Landscape
- 6.1 Market Concentration
- 6.2 Strategic Moves
- 6.3 Market Share (%)/Ranking Analysis
- 6.4 Company Profiles (includes Global Overview, Market Overview, Core Segments, Financials as available, Strategic Information, Products and Services, and Recent Developments)
- 6.4.1 Chemische Fabrik Budenheim KG
- 6.4.2 EuroChem Group
- 6.4.3 Fosfitalia Group
- 6.4.4 Guizhou Phosphate Chemical Group
- 6.4.5 Hubei Xingfa Chemicals Group Co., Ltd.
- 6.4.6 ICL Group Ltd.
- 6.4.7 Innophos Holdings, Inc.
- 6.4.8 Jordan Phosphate Mines Company (JPMC)
- 6.4.9 Maaden
- 6.4.10 Mosaic
- 6.4.11 Nutrien
- 6.4.12 OCP S.A.
- 6.4.13 PhosAgro Group
- 6.4.14 Prayon SA
- 6.4.15 Reciphos SAS
- 6.4.16 WENGFU GROUP CO. LTD.
- 6.4.17 Yara International ASA
- 6.4.18 Yunnan Yuntianhua Co., Ltd.
7 Market Opportunities and Future Outlook
- 7.1 White-Space and Unmet-Need Assessment

 丁基三苯基磷酸酯:市場佔有率分析、行業趨勢和統計數據、成長預測(2026-2031)
 磷酸鹽市場規模、佔有率和成長分析:按產品類型、最終用途產業、應用、銷售管道和地區分類-2026-2033年產業預測
 二辛基苯基磷酸酯塑化劑市場-全球產業規模、佔有率、趨勢、機會、預測:按等級、應用、地區和競爭格局分類,2021-2031年
 磷酸鹽市場:按類型、生產流程、等級、應用和最終用戶產業分類-2026-2032年全球市場預測丁基三苯基磷酸酯市場:依形態、等級、應用、終端用戶產業及通路分類-2026-2032年全球預測
 磷酸鹽市場分析及預測(至2035年):類型、產品類型、應用、形態、材料類型、最終用戶、製程、技術、功能、設備
 全球磷酸鹽轉化膜市場規模、佔有率、趨勢及成長分析報告(2026-2034)
 磷酸鋅市場規模、佔有率及成長分析(按應用、形態、等級、粒度、產業細分及地區分類)-2026-2033年產業預測
 2026-2030年全球磷酸鹽市場全球鋅磷酸鹽電鍍服務市場(依服務模式、製程類型、基材、鍍層厚度及應用分類)預測(2026-2032年)