


 |
市場調查報告書
商品編碼
2118879
付費搜尋管理軟體:市場佔有率分析、產業趨勢與統計資料、成長預測(2026-2031 年)Paid Search Management Software - Market Share Analysis, Industry Trends & Statistics, Growth Forecasts (2026 - 2031) |
||||||

※ 本網頁內容可能與最新版本有所差異。詳細情況請與我們聯繫。
根據 Mordor Intelligence 預測,付費搜尋管理軟體的市場規模預計將從 2025 年的 36.8 億美元和 2026 年的 40.2 億美元成長到 2031 年的 76.8 億美元,2026 年至 2031 年的複合年成長率為 13.81%。
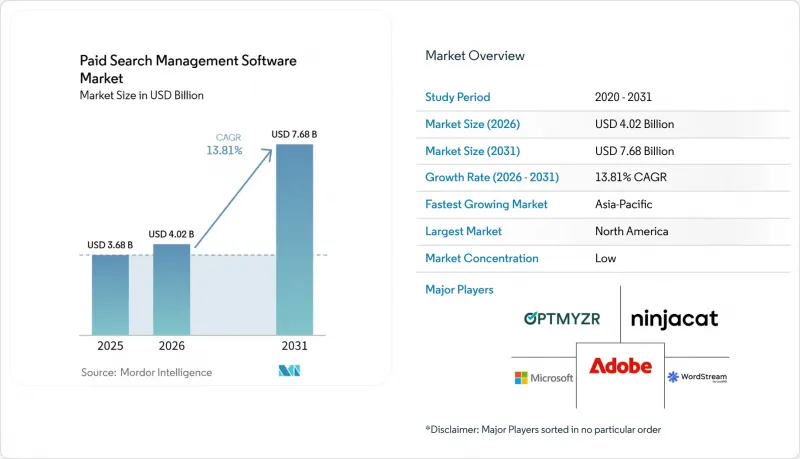
本報告按元件(軟體和服務)、部署模式(雲端和本地部署)、組織規模(大型企業和中小企業)、應用程式(例如搜尋廣告宣傳管理)、最終用戶產業(例如資訊科技和電信)以及地區進行細分。市場預測以美元計價。
全球付費搜尋管理軟體市場趨勢及洞察
對競標和預算重新分配自動化日益成長的需求。
付費搜尋管理軟體市場正受到大規模廣告組合層面最佳化的推動,這種最佳化取代了手動競標規則。這是因為,即使搜尋需求、轉換品質和可用預算發生細微變化,也需要頻繁地進行決策,而僅靠手動驗證已不足以應對這些變化。 Google Ads API v25 引入了「AI Max」宣傳活動設置,使互聯平台能夠大規模配置「AI Max for Search」。這意味著第三方自動化工具不會簡單地取代原生平台的自動化功能,而是會作為領先層發揮作用。隨著軟體不斷增加控制功能,廣告主可以跨帳戶、團隊和不斷變化的宣傳活動條件一致地應用這些功能,付費搜尋管理軟體市場也將從中受益。在 COLING 2025 上發表的學術研究表明,動態關鍵字產生比靜態關鍵字集更能有效地適應不斷變化的效果指標。微軟廣告也提高了第三方工具的標準,於 2026 年 5 月推出了搜尋和購物廣告的跨帳號競標組合出價功能。即使宣傳活動設定變得越來越自動化,廣告主仍然需要跨帳戶和管道保持預算管理的一致性。
向第一方搜尋效能分析過渡
向第一方數據的轉變正在推動付費搜尋管理軟體市場對衡量功能的需求成長。儘管Google在2025年向英國競爭與市場管理局(CMA)表示,Chrome瀏覽器將保留用戶對第三方Cookie的選擇權,但這並不意味著恢復廣泛的跨站點衡量。谷歌分析支援收集用戶提供的數據,以便在獲得用戶同意的第一方數據可用時改進轉換模型。這些設定需要可靠的資料處理和跨帳戶一致的宣傳活動流程。將更清晰的第一方資料整合到競標和報告中的平台,不僅可以幫助廣告主提高效果指標的質量,還可以為代理商提供一致的流程,用於驗證客戶帳戶中的同意狀態、轉換輸入和報告定義。此外,由於隱私和同意要求使得合規性分析在歐洲和其他受監管市場至關重要,付費搜尋管理軟體市場正在幫助團隊在檢驗搜尋效果的同時,保持一致的資料管理實踐。
對平台策略和API變更的依賴
付費搜尋管理軟體市場依賴廣告平台的政策和發布計劃。 Google將於 2026 年 1 月停止透過 Google Ads API 支援“僅調用廣告”,現有僅調用廣告的投放計劃將於 2027 年 2 月停止。谷歌也在 2025 年 6 月至 10 月期間發布了 API 版本 20 至 22。每次版本更新,軟體供應商都需要更新其整合功能和宣傳活動工作流程,這導致付費搜尋管理軟體市場持續增加成本,並給工程資源有限的小規模供應商帶來更大壓力。小規模供應商可能需要將工程資源從新產品開發轉移到維護。如果廣告平台的變更速度超過與其整合的軟體產品的更新速度,廣告主可能會面臨工作流程中斷。這是因為,當供應商調整其整合功能以適應平台變更要求時,宣傳活動團隊必須暫停日常變更,並審查設定和資料流。
細分市場分析
至2025年,軟體將佔據付費搜尋管理軟體市場68.19%的佔有率。訂閱式授權仍然是企業平台和代理商控制面板的核心收入模式。這種模式使得軟體成為需要持續進行宣傳活動管理的廣告主的首選。付費搜尋管理軟體產業之所以繼續依賴這種授權模式,是因為搜尋程式需要頻繁調整,而非一次性部署。
預計2026年至2031年,服務業務部門的複合年成長率將達到16.67%。這一成長反映了隨著廣告主使用更多平台,對實施支援、託管服務和API整合的需求日益成長。當團隊需要協調搜尋、零售媒體和衡量系統時,人工支援的重要性也日益凸顯。 2026年5月,微軟廣告推出了全新的“導入中心”,旨在簡化從Google Ads和Meta Ads遷移宣傳活動。遷移和資料規範化可能涉及僅靠訂閱軟體無法完成的任務。因此,該板塊將可擴展的授權收入與日益複雜的宣傳活動環境所驅動的服務需求相結合。
預計到2025年,雲端服務將佔總營收的70.21%,並將以16.05%的複合年成長率持續成長至2031年。這確立了雲端服務作為主要部署模式和成長最快選項的地位。雲端系統能夠處理即時競標訊號和跨廣告平台的多個API呼叫。它們還支援跨帳戶組合操作,無需在每個客戶所在地建立本地基礎設施。隨著宣傳活動活動日益持續,這些功能滿足了付費搜尋管理軟體市場的需求。
對於資料居住和合規性要求嚴格的廣告主而言,本地部署仍然是一個可行的選擇。金融服務、醫療保健和政府機構如果其內部政策限制雲端遷移,則可能會保留這些系統。隨著雲端優先供應商更快發布新功能,兩種模式之間的差異將變得更加明顯。 Optmyzr 介紹了其基於雲端的 MCP 連接,該連接允許用戶透過 AI 工具對即時帳戶資料進行受控存取。 Smartly 於 2026 年 6 月推出了 Synapse AI編配層,進一步強化了其向雲端原生廣告營運的轉型。
區域分析
到2025年,北美將佔據付費搜尋管理軟體市場36.44%的佔有率。該地區受益於成熟的數位廣告基礎設施以及廣告平台、代理商和企業買家的集中佈局。美國是支持組合競標和詳細報告的軟體的主要需求中心。北美買家也是漸進式測試、多網路管理和人工智慧驅動的查詢流程的早期採用者。隨著廣告主除了現有的搜尋平台外,也越來越關注零售媒體,該地區的付費搜尋管理軟體市場正在不斷發展,因此,能夠整合跨多個網路宣傳活動資訊並為代理商提供帳戶級績效概覽的工具,其實際價值也隨之提升。
歐洲是第二大市場,其中德國、英國和法國是企業和機構需求的主要驅動力。谷歌向英國競爭與市場管理局 (CMA) 提交的關於其「隱私沙盒」的 2025 年進展報告,對該地區的衡量計劃仍然至關重要。這種法規環境支援對以使用者同意和合規性為核心的第一方分析功能的需求。南美洲的銷售額雖然小規模,但中小企業採用雲端軟體的空間依然很大,供應商可以利用在地化產品來滿足巴西和阿根廷企業的營運需求。
預計到2031年,亞太地區的複合年成長率將達到15.36%,是所有地區中成長最快的。印度、中國、韓國、澳洲和紐西蘭的廣告主群體正在不斷擴大,他們需要搜尋管理工具。在印度,對本地語言的關鍵字分析和區域競標支持的需求日益成長。在中國,百度、阿里巴巴和騰訊的技術棧與其西方平台不同,因此需要採用獨特的產品策略。這種在地化需求限制了全球供應商簡單的業務擴張,同時也為在地化產品創造了機會。
其他好處:
- Excel格式的市場預測(ME)表
- 3個月的分析師支持
目錄
第1章:引言
- 研究假設和市場定義
- 調查範圍
第2章:調查方法
第3章執行摘要
第4章 市場狀況
- 市場概覽
- 市場促進因素
- 對競標和預算重新分配自動化日益成長的需求。
- 向第一方搜尋效能分析過渡
- 零售媒體與搜尋的融合
- 擴展多帳戶代理機構的工作流程
- 擴大人工智慧驅動的查詢挖掘技術的應用
- 對增量效應和增量ROAS測量的需求日益成長
- 市場限制因素
- 對平台策略和API變更的依賴
- 小規模廣告商預算削減
- 跨裝置搜尋旅程中的歸因噪音
- 我們在高階自動化管治方面缺乏內部專業知識。
- 產業價值鏈分析
- 監理情勢
- 技術展望
- 宏觀經濟因素對市場的影響
- 波特五力分析
第5章 市場規模與成長預測
- 按組件
- 軟體
- 服務
- 部署模式
- 雲
- 現場
- 按組織規模
- 大公司
- 中小企業
- 透過使用
- 管理搜尋廣告宣傳
- 競標管理和預算最佳化
- 績效追蹤與歸因分析
- 確定目標受眾和關鍵字分析
- 按最終用戶行業分類
- 零售與電子商務
- 銀行、金融服務和保險(BFSI)
- 醫療保健和生命科學
- 資訊科技和通訊
- 媒體與娛樂
- 旅遊與飯店
- 其他終端用戶產業
- 按地區
- 北美洲
- 美國
- 加拿大
- 墨西哥
- 南美洲
- 巴西
- 阿根廷
- 其他南美國家
- 歐洲
- 德國
- 英國
- 法國
- 義大利
- 西班牙
- 俄羅斯
- 其他歐洲國家
- 亞太地區
- 中國
- 日本
- 印度
- 韓國
- 澳洲和紐西蘭
- 其他亞太國家
- 中東
- 沙烏地阿拉伯
- 阿拉伯聯合大公國
- 土耳其
- 其他中東國家
- 非洲
- 南非
- 奈及利亞
- 其他非洲國家
- 北美洲
第6章 競爭情勢
- 市場集中度
- 策略趨勢
- 市佔率分析
- 公司簡介
- Microsoft Corporation
- Adobe Inc.
- NinjaCat, Inc.
- Adzooma Limited
- Marin Software Incorporated
- Semrush Holdings, Inc.
- SpyFu, LLC
- Adalysis, LLC
- WordStream, Inc.
- Acquisio Inc.
- Search Ads 360
- PPCentive, Inc.
- Opteo Limited
- Brainlabs Digital Limited
- Smartly.io Solutions Oy
- Performance Max Pro
- Bidnamic Limited
- Kenshoo Technologies, LLC
- Skai BV
- Optmyzr Corporation
第7章 市場機會與未來展望
According to Mordor Intelligence, the paid search management software market size is projected to expand from USD 3.68 billion in 2025 and USD 4.02 billion in 2026 to USD 7.68 billion by 2031, registering a CAGR of 13.81% between 2026 and 2031.
This report is Segmented by Component (Software and Services), Deployment Mode (Cloud and On-Premises), Organization Size (Large Enterprises and Small and Medium Enterprises [SMEs]), Application (Search Advertising Campaign Management, and More), End-User Industry (Information Technology and Telecommunication, and More), and Geography. The Market Forecasts are Provided in Terms of Value (USD).
Global Paid Search Management Software Market Trends and Insights
Rising Need for Automated Bid and Budget Reallocation
The paid search management software market is driven by the replacement of manual bid rules with portfolio-level optimization across larger portfolios, where small changes in search demand, conversion quality, and available budget require frequent decisions that are difficult to sustain through manual checks alone. Google Ads API v25 introduced an AI Max campaign setting that lets connected platforms configure AI Max for Search at scale. This makes third-party automation a layer that can guide native platform automation rather than simply replace it, and the paid search management software market benefits when software adds controls that advertisers can apply consistently across accounts, teams, and changing campaign conditions. Academic work presented at COLING 2025 found that on-the-fly keyword generation can adapt to changing performance indicators more effectively than static keyword sets. Microsoft Advertising also introduced cross-account portfolio bidding for Search and Shopping in May 2026, raising the bar for independent tools. As campaign settings become more automated, advertisers still need consistent budget control across accounts and channels.
Shift Toward First-Party Search Performance Analytics
The move toward first-party data is increasing demand for measurement features in the paid search management software market. Google told the UK Competition and Markets Authority in 2025 that it would retain user choice on third-party cookies in Chrome, but this did not restore broad cross-site measurement. Google Analytics supports user-provided data collection to improve conversion modeling when consented first-party data is available. These configurations require reliable data handling and consistent campaign processes across accounts. Platforms that connect cleaner first-party data to bidding and reporting can help advertisers improve the quality of their performance signals, while also giving agencies a consistent process for checking consent status, conversion inputs, and reporting definitions across client accounts. Privacy and consent requirements also make compliance-aware analytics functions important in Europe and other regulated markets, which gives the paid search management software market a role in helping teams maintain consistent data practices while reviewing search performance.
Dependence on Platform Policy and API Changes
The paid search management software market depends on the policies and release schedules of advertising platforms. Google deprecated call-only ads from the Google Ads API in January 2026, and existing call-only ads are scheduled to stop serving in February 2027. Google also released API versions 20 through 22 between June and October 2025. Each release can require software vendors to update integrations and campaign workflows, creating ongoing costs for the paid search management software market and putting greater pressure on smaller providers with limited engineering capacity. Smaller vendors may need to reallocate engineering resources from new product development to maintenance. Advertisers can face workflow disruption when an advertising platform changes faster than a connected software product, since campaign teams may need to pause routine changes, verify settings, and review data flows while a vendor adjusts its integration to the revised platform requirements.
Other drivers and restraints analyzed in the detailed report include:
- Retail Media and Search Convergence
- Growth of Multi-Account Agency Workflows
- Budget Compression in Small Advertiser Accounts
For complete list of drivers and restraints, kindly check the Table Of Contents.
Segment Analysis
Software held 68.19% of the paid search management software market share in 2025. Subscription licensing remains the central revenue model for enterprise platforms and agency dashboards. The structure also makes software the default choice for advertisers who need ongoing campaign management. The paid search management software industry continues to rely on this licensing model because search programs require frequent adjustment rather than one-time implementation.
Services are projected to grow at a 16.67% CAGR from 2026 to 2031. This growth reflects demand for implementation support, managed services, and API integration as advertisers use more platforms. Human support becomes more important when teams must connect search, retail media, and measurement systems. Microsoft Advertising introduced a new Import Center in May 2026 to simplify campaign migration from Google Ads and Meta Ads. Migration and data normalization can create work that subscription software alone does not complete. The segment, therefore, combines scalable license revenue with a services need created by more complex campaign environments.
Cloud accounted for 70.21% of revenue in 2025 and is projected to advance at a 16.05% CAGR through 2031. This establishes cloud as both the leading deployment mode and the faster-growing option. Cloud systems can support real-time bid signals and multiple API calls across advertising platforms. They also enable cross-account portfolio work without requiring local infrastructure at each client location. These capabilities align with the needs of the paid search management software market as campaign activity becomes more continuous.
On-premises deployment remains relevant for advertisers with strict data residency and compliance requirements. Financial services, healthcare, and government-related organizations may retain these systems when internal policies limit cloud migration. The difference between the two models is likely to become clearer as cloud-first vendors release new functions more quickly. Optmyzr has described cloud-based MCP connections that give users controlled access to live account data through AI tools. Smartly introduced its Synapse AI orchestration layer in June 2026, reinforcing the direction of cloud-native advertising operations.
Complete Report Scope:
- By Component
- Software
- Services
- By Deployment Mode
- Cloud
- On-Premises
- By Organization Size
- Large Enterprises
- Small and Medium Enterprises (SMEs)
- By Application
- Search Advertising Campaign Management
- Bid Management and Budget Optimization
- Performance Tracking and Attribution Analytics
- Audience Targeting and Keyword Intelligence
- By End-User Industry
- Retail and E-Commerce
- Banking, Financial Services, and Insurance (BFSI)
- Healthcare and Life Sciences
- Information Technology and Telecommunication
- Media and Entertainment
- Travel and Hospitality
- Other End-User Industries
- By Geography
- North America
- United States
- Canada
- Mexico
- South America
- Brazil
- Argentina
- Rest of South America
- Europe
- Germany
- United Kingdom
- France
- Italy
- Spain
- Russia
- Rest of Europe
- Asia-Pacific
- China
- Japan
- India
- South Korea
- Australia and New Zealand
- Rest of Asia-Pacific
- Middle East
- Saudi Arabia
- United Arab Emirates
- Turkey
- Rest of Middle East
- Africa
- South Africa
- Nigeria
- Rest of Africa
- North America
Geography Analysis
North America held 36.44% of the paid search management software market share in 2025. The region benefits from a mature digital advertising base and a concentration of advertising platforms, agencies, and enterprise buyers. The United States provides a major demand center for software that supports portfolio bidding and detailed reporting. North American buyers have also adopted incrementality testing, multi-network management, and AI-assisted query processes early. The paid search management software market in the region is also evolving as advertisers place greater emphasis on retail media alongside established search platforms, thereby expanding the practical value of tools that reconcile campaign information across multiple networks and provide agencies with an account-level view of performance.
Europe is the second-largest regional area, with Germany, the United Kingdom, and France supporting enterprise and agency demand. Google's 2025 Privacy Sandbox progress report to the UK Competition and Markets Authority remains relevant to measurement planning in the region. This regulatory environment supports demand for first-party analytics functions that are designed with consent and compliance in mind. South America is smaller in revenue but offers room for cloud software adoption among SMEs, and vendors can use localized products to address the operational needs of businesses in Brazil and Argentina.
Asia-Pacific is projected to grow at a 15.36% CAGR through 2031, the fastest rate among the regions. India, China, South Korea, Australia, and New Zealand are expanding the base of advertisers that require search management tools. India creates demand for local-language keyword intelligence and regional bidding support. China requires a distinct product approach because Baidu, Alibaba, and Tencent operate on different technology stacks than Western platforms. This localization requirement can limit simple expansion by global vendors while creating an opening for adapted products.
- Microsoft Corporation
- Adobe Inc.
- NinjaCat, Inc.
- Adzooma Limited
- Marin Software Incorporated
- Semrush Holdings, Inc.
- SpyFu, LLC
- Adalysis, LLC
- WordStream, Inc.
- Acquisio Inc.
- Search Ads 360
- PPCentive, Inc.
- Opteo Limited
- Brainlabs Digital Limited
- Smartly.io Solutions Oy
- Performance Max Pro
- Bidnamic Limited
- Kenshoo Technologies, LLC
- Skai B.V.
- Optmyzr Corporation
Additional Benefits:
- The market estimate (ME) sheet in Excel format
- 3 months of analyst support
TABLE OF CONTENTS
1 INTRODUCTION
- 1.1 Study Assumptions and Market Definition
- 1.2 Scope of the Study
2 RESEARCH METHODOLOGY
3 EXECUTIVE SUMMARY
4 MARKET LANDSCAPE
- 4.1 Market Overview
- 4.2 Market Drivers
- 4.2.1 Rising Need For Automated Bid and Budget Reallocation
- 4.2.2 Shift Toward First-Party Search Performance Analytics
- 4.2.3 Retail Media and Search Convergence
- 4.2.4 Growth of Multi-Account Agency Workflows
- 4.2.5 Increased Adoption of AI Assisted Query Mining
- 4.2.6 Greater Demand for Incrementality and Incremental ROAS Measurement
- 4.3 Market Restraints
- 4.3.1 Dependence on Platform Policy and API Changes
- 4.3.2 Budget Compression in Small Advertiser Accounts
- 4.3.3 Attribution Noise across Cross-Device Search Journeys
- 4.3.4 Limited In-House Expertise for Advanced Automation Governance
- 4.4 Industry Value Chain Analysis
- 4.5 Regulatory Landscape
- 4.6 Technological Outlook
- 4.7 Impact of Macroeconomic Factors on the Market
- 4.8 Porter's Five Forces Analysis
- 4.8.1 Threat of New Entrants
- 4.8.2 Bargaining Power of Suppliers
- 4.8.3 Bargaining Power of Buyers
- 4.8.4 Threat of Substitutes
- 4.8.5 Intensity of Competitive Rivalry
5 MARKET SIZE AND GROWTH FORECASTS (VALUE)
- 5.1 By Component
- 5.1.1 Software
- 5.1.2 Services
- 5.2 By Deployment Mode
- 5.2.1 Cloud
- 5.2.2 On-Premises
- 5.3 By Organization Size
- 5.3.1 Large Enterprises
- 5.3.2 Small and Medium Enterprises (SMEs)
- 5.4 By Application
- 5.4.1 Search Advertising Campaign Management
- 5.4.2 Bid Management and Budget Optimization
- 5.4.3 Performance Tracking and Attribution Analytics
- 5.4.4 Audience Targeting and Keyword Intelligence
- 5.5 By End-User Industry
- 5.5.1 Retail and E-Commerce
- 5.5.2 Banking, Financial Services, and Insurance (BFSI)
- 5.5.3 Healthcare and Life Sciences
- 5.5.4 Information Technology and Telecommunication
- 5.5.5 Media and Entertainment
- 5.5.6 Travel and Hospitality
- 5.5.7 Other End-User Industries
- 5.6 By Geography
- 5.6.1 North America
- 5.6.1.1 United States
- 5.6.1.2 Canada
- 5.6.1.3 Mexico
- 5.6.2 South America
- 5.6.2.1 Brazil
- 5.6.2.2 Argentina
- 5.6.2.3 Rest of South America
- 5.6.3 Europe
- 5.6.3.1 Germany
- 5.6.3.2 United Kingdom
- 5.6.3.3 France
- 5.6.3.4 Italy
- 5.6.3.5 Spain
- 5.6.3.6 Russia
- 5.6.3.7 Rest of Europe
- 5.6.4 Asia-Pacific
- 5.6.4.1 China
- 5.6.4.2 Japan
- 5.6.4.3 India
- 5.6.4.4 South Korea
- 5.6.4.5 Australia and New Zealand
- 5.6.4.6 Rest of Asia-Pacific
- 5.6.5 Middle East
- 5.6.5.1 Saudi Arabia
- 5.6.5.2 United Arab Emirates
- 5.6.5.3 Turkey
- 5.6.5.4 Rest of Middle East
- 5.6.6 Africa
- 5.6.6.1 South Africa
- 5.6.6.2 Nigeria
- 5.6.6.3 Rest of Africa
- 5.6.1 North America
6 COMPETITIVE LANDSCAPE
- 6.1 Market Concentration
- 6.2 Strategic Moves
- 6.3 Market Share Analysis
- 6.4 Company Profiles (includes Global Level Overview, Market Level Overview, Core Segments, Financials as available, Strategic Information, Market Rank/Share, Products and Services, Recent Developments)
- 6.4.1 Microsoft Corporation
- 6.4.2 Adobe Inc.
- 6.4.3 NinjaCat, Inc.
- 6.4.4 Adzooma Limited
- 6.4.5 Marin Software Incorporated
- 6.4.6 Semrush Holdings, Inc.
- 6.4.7 SpyFu, LLC
- 6.4.8 Adalysis, LLC
- 6.4.9 WordStream, Inc.
- 6.4.10 Acquisio Inc.
- 6.4.11 Search Ads 360
- 6.4.12 PPCentive, Inc.
- 6.4.13 Opteo Limited
- 6.4.14 Brainlabs Digital Limited
- 6.4.15 Smartly.io Solutions Oy
- 6.4.16 Performance Max Pro
- 6.4.17 Bidnamic Limited
- 6.4.18 Kenshoo Technologies, LLC
- 6.4.19 Skai B.V.
- 6.4.20 Optmyzr Corporation
7 MARKET OPPORTUNITIES AND FUTURE OUTLOOK
- 7.1 White-Space And Unmet-Need Assessment

 人工智慧知識圖譜平台市場預測至2034年-全球分析:基於圖架構、知識處理能力、人工智慧整合、資料來源、應用、最終使用者和區域
 搜尋引擎行銷軟體:市場佔有率分析、產業趨勢與統計、成長預測(2026-2031)基於語義層和知識圖譜的代理人工智慧:市場佔有率分析、行業趨勢和統計數據以及成長預測(2026-2031 年)語意資料層技術市場預測-全球分析(按組件、架構類型、技術類型、整合層、應用、最終用戶和地區分類)——2034年
 語意知識圖譜市場規模、佔有率和成長分析:按圖類型、應用、最終用戶產業和地區分類-2026-2033年產業預測
 語意知識抓取市場:按技術、組件、應用和地區分類
 下一代搜尋引擎市場:按平台類型、最終用戶、分銷管道和地區分類,2026-2034 年
 企業知識圖譜市場規模、佔有率和趨勢分析報告:按產品/服務、類型、應用、部署模式、組織規模、最終用途、地區和細分市場預測,2026-2033年
 2026年全球企業知識圖譜市場報告2026年全球多模態產品搜尋市場報告