


 |
市場調查報告書
商品編碼
2117573
串流版權:市場佔有率分析、產業趨勢與統計、成長預測(2026-2031)Streaming Rights - Market Share Analysis, Industry Trends & Statistics, Growth Forecasts (2026 - 2031) |
||||||

※ 本網頁內容可能與最新版本有所差異。詳細情況請與我們聯繫。
據 Mordor Intelligence 稱,2025 年串流版權市場價值 393.6 億美元,預計到 2031 年將達到 600.1 億美元,而 2026 年為 422.4 億美元,2026 年至 2031 年預測期內的複合年成長率為 7.28%。
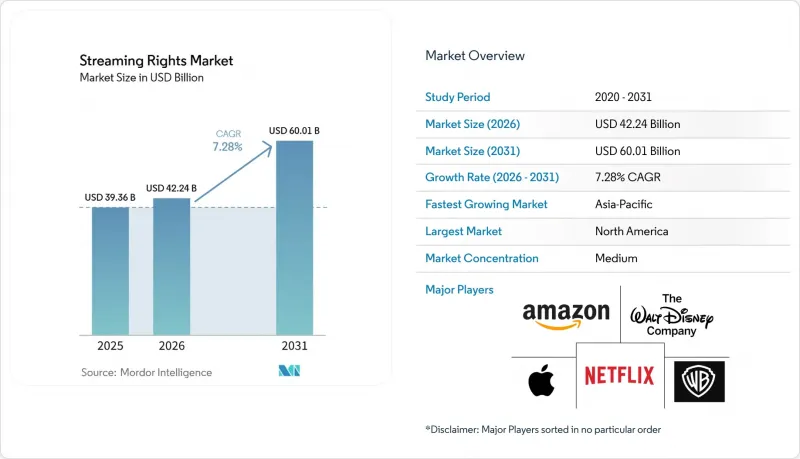
本報告按版權類型(獨家串流播放權、非獨家串流媒體播放權、窗口期串流媒體播放權)、內容類型(電影、電視節目和劇集內容、其他)、最終用戶(OTT平台、廣播公司、電信營運商和付費電視營運商、媒體和娛樂公司)以及地區(北美、其他)進行分類。市場預測以美元計價。
全球串流媒體版權市場趨勢及洞察
體育賽事和實況活動的獨家串流播放權優質化。
優質直播節目已成為串流版權市場的主要競爭者。這是因為獨家體育內容能夠吸引用戶並降低解約率。亞馬遜Prime Video與NBA簽訂的11年媒體版權協議表明,全球數位平台正對大型運動內容採取長期策略。派拉蒙+也獲得了UFC在美國的獨家發行權,該權利將於2026年生效,這將使另一項重要的直播內容納入串流媒體主導的發行模式。版權所有擁有者不僅可以獲得主要直播影像的授權,還可以獲得其他拍攝角度、說明音軌、多語言廣播、即時統計資料和資料疊加層的授權。這些資源擴大了可協商版權的範圍,同時也要求服務提供者在賽事開始前協調製作、發行和版權許可事宜。因此,獨家性、打包銷售以及大規模、穩定的直播發行變得越來越重要。
擴大了 FAST、AVOD 和廣告支援的投放窗口。
廣告支援的串流媒體正在改變內容在授權視窗期間的流通順序。一部作品可能首先透過訂閱服務發布,然後提供給廣告支援的觀眾,隨後進行更廣泛的授權。這種順序使版權所有者能夠在保留早期發行作品價值的同時,透過廣告和更廣泛的發行管道獲得後續收益。 2026年7月,Titan OS透過與NBC環球全球電視發行公司達成協議,擴大了在歐洲的FAST發行範圍。該協議涵蓋英國、德國、西班牙、義大利、北歐國家和荷蘭。這項安排將製片公司、設備平台和廣告支援的頻道營運商整合到一個統一的授權鏈中,同時為舊節目庫創造了新的商業性機會。
區域範圍內權利所有權的分散性和權利管理的複雜性。
區域授權仍然是全球串流媒體發行中一個複雜的因素。在聯合製作中,串流媒體服務商可能獲得其他國家的版權,而國內廣播公司則保留本國的版權。這種結構可能導致發行不暢,並限制客製化廣告和推廣宣傳活動的覆蓋範圍。每項例外情況都可能需要單獨的法律審查、內容轉移、付款條款、合規性監控以及與不同發行合作夥伴的溝通。即使節目本身在不同市場相同,這些工作也會增加成本。因此,對於希望擴大發行範圍的版權持有者而言,在串流版權市場中,細緻的版權授權至關重要。
細分市場分析
到2025年,獨家串流媒體播放權將佔串流媒體播放權市場佔有率的46.33%,成為一項重要的版權類別。這一地位反映了串流媒體服務能夠提供其他平台無法獲得的內容的價值,尤其是在觀眾需要即時觀看的情況下。獨家播放權能夠促進用戶成長,並能證明非獨家協議下無法實現的授權費用的合理性。體育賽事和實況活動尤其重要,因為觀眾的時間有限,這提升了優質獨家協議的價值。亞馬遜與NBA的合作表明,串流媒體播放權市場對高價值獨家直播權的需求仍然強勁。
預計到2031年,窗口期串流發行權將以7.76%的複合年成長率成長,成為該版權類別中成長最快的領域。這些協議使版權所有者能夠按照計劃順序,透過訂閱、廣告支援發行以及更廣泛的授權發行管道分發其節目。較短的窗口期允許在多個發行管道產生收入,同時保持初始發行的價值。平台無需簽訂長期獨家協議即可獲得優質內容,版權所有者也擁有更大的自主權來控制後續的發行時間。非獨家協議、授權合約、片段協議和格式協議仍然是串流版權市場的重要組成部分,因為它們拓寬了智慧財產權授權的方式。
區域分析
2025年,北美仍將是最大的區域授權市場,佔串流媒體版權市場佔有率的42.62%。美國憑藉著頻繁的體育賽事版權續約、大型平台工作室集團以及龐大的串流媒體用戶群體,鞏固了其市場地位。亞馬遜與NBA達成的協議以及派拉蒙+與UFC達成的協議表明,優質體育賽事對區域買家而言仍然有價值。聯邦通訊法規和版權費率架構正在影響數位發行的相關規定。體育賽事、劇本節目和現場娛樂領域的激烈競爭正在推動串流版權市場的競標。
預計到2031年,亞太地區將以8.24%的複合年成長率成長,成為成長最快的地區。印度是主要的需求來源,因為當地體育賽事版權和電信業者提供的配套服務使得向大規模的消費群體提供多種服務成為可能。 Jio在2026年推出的OTT捆綁套餐表明,電信業者可以將行動存取和娛樂存取整合到單一服務中。日本擁有成熟的用戶基礎,並專注於高階定價和以體育為中心的差異化策略,而中國、韓國、澳洲和東南亞的觀看環境和監管情況則有所不同。在地化規則、語言要求和多樣化的服務模式使得串流版權市場的多區域合約極具價值,但也帶來了巨大的營運負擔。
歐洲是全球第二大收入地區,其視聽市場在2024年將達到1,420億歐元(約1,550億美元)。歐盟委員會對《視聽媒體服務指令》的審查可能會影響跨區域服務的本地內容和投資義務。在南美洲,基於串流媒體的體育賽事轉播潛力正在不斷擴大,例如CazeTV獲得了2026年國際足總世界盃全部104場比賽以及2026年冬季奧運會和2028年夏季奧運會的轉播權。雖然對體育和娛樂產業的投資正在推動中東的發展,但非洲的發展起步較晚,這為FAST服務提供了更方便的切入點。
其他好處:
- Excel格式的市場預測(ME)表
- 3個月的分析師支持
目錄
第1章:引言
- 研究假設和市場定義
- 調查範圍
第2章:調查方法
第3章執行摘要
第4章 市場狀況
- 市場概覽
- 市場促進因素
- 體育賽事和實況活動的獨家轉播權優質化
- 延長快速付費、廣告支援隨選和廣告支援串流媒體播放期限。
- 對跨境本地化和多地區發布的需求
- 雲端原生權限管理和自動化可用性管理
- 人工智慧驅動的元資料、指紋辨識和權限匹配
- 電信營運商和串流媒體生態系統之間的捆綁式交付合約
- 市場限制因素
- 所有權的碎片化和區域性定居點的複雜性
- 內容授權成本上升和利潤率下降
- 持續不斷的盜版、洩漏和未經授權的再分發
- 資料隱私、在地化和合規性的負擔。
- 產業價值鏈分析
- 監理情勢
- 技術展望
- 宏觀經濟因素對市場的影響
- 波特五力分析
第5章 市場規模與成長預測
- 依法
- 獨家串流媒體播放權
- 非獨家串流媒體播放權
- 具有視窗串流權限
- 其他權利
- 按內容類型
- 電影和影像作品
- 電視節目和劇集內容
- 記錄
- 其他內容類型
- 最終用戶
- OTT串流平台
- 廣播員
- 電信業者和付費電視業者
- 媒體和娛樂公司
- 其他最終用戶
- 按地區
- 北美洲
- 美國
- 加拿大
- 墨西哥
- 南美洲
- 巴西
- 阿根廷
- 智利
- 其他南美國家
- 歐洲
- 德國
- 英國
- 法國
- 義大利
- 西班牙
- 其他歐洲國家
- 亞太地區
- 中國
- 日本
- 印度
- 韓國
- 澳洲
- 其他亞太國家
- 中東
- 沙烏地阿拉伯
- 阿拉伯聯合大公國
- 卡達
- 其他中東國家
- 非洲
- 南非
- 埃及
- 奈及利亞
- 其他非洲國家
- 北美洲
第6章 競爭情勢
- 市場集中度
- 策略趨勢
- Vendor Positioning Analysis
- 公司簡介
- Netflix, Inc.
- The Walt Disney Company
- Warner Bros. Discovery, Inc.
- Amazon.com, Inc.
- Apple Inc.
- Alphabet Inc.
- Paramount Global
- Comcast Corporation
- Fox Corporation
- Spotify Technology SA
- Sony Group Corporation
- TelevisaUnivision, Inc.
- Viaplay Group AB
- DAZN Group Limited
- beIN MEDIA GROUP
- Vubiquity, Inc.
- Rightsline, Inc.
- Whip Media Group, Inc.
- FADEL, Inc.
- Vistex, Inc.
第7章 市場機會與未來展望
According to Mordor Intelligence, the streaming rights market size was valued at USD 39.36 billion in 2025 and is estimated to grow from USD 42.24 billion in 2026 to reach USD 60.01 billion by 2031, at a CAGR of 7.28% during the forecast period 2026-2031.
This report is Segmented by Rights (Exclusive Streaming Rights, Non-Exclusive Streaming Rights, and Windowed Streaming Rights), Content Type (Movies and Films, TV Shows and Episodic Content, and More), End User (OTT Platforms, Broadcasters, Telecom and Pay-TV Operators, and Media and Entertainment Companies), and Geography (North America, and More). The Market Forecasts are Provided in Terms of Value (USD).
Global Streaming Rights Market Trends and Insights
Exclusive Sports and Live Event Rights Premiumization
Premium live programming is a major source of competition in the Streaming rights market because exclusive sports can attract subscribers and reduce cancellations. Amazon Prime Video's 11-year NBA media rights agreement showed that global digital platforms are willing to take long-term positions in major sports properties. Paramount+ also secured exclusive U.S. UFC rights beginning in 2026, which brought another major live property under a streaming-led distribution model. Rights owners can license more than the primary live feed, including alternate camera angles, commentary tracks, language feeds, real-time statistics, and data overlays. These assets can widen the set of rights available for negotiation and require services to coordinate production, delivery, and clearance before an event begins. The result is greater emphasis on exclusivity, packaging, and reliable live delivery at scale.
FAST, AVOD, and Ad-Supported Window Expansion
Ad-supported viewing is changing the order in which content moves through licensing windows. A title can first appear through a subscription service, then reach ad-supported viewers, and later be licensed more broadly. This sequencing can let owners protect the value of an early release while building later revenue from advertising and wider distribution. Titan OS expanded its European FAST distribution through an agreement with NBCUniversal Global TV Distribution in July 2026. The agreement covered the United Kingdom, Germany, Spain, Italy, the Nordic markets, and the Netherlands. This arrangement brings studios, device platforms, and ad-supported channel operators into the same licensing chain while giving older catalog programs renewed commercial use.
Fragmented Rights Ownership and Territorial Clearing Complexity
Territory-by-territory licensing continues to complicate global streaming releases. A co-production may give a streamer rights outside one country while a domestic broadcaster retains the national rights. That structure can create gaps in availability and reduce the reach of a coordinated advertising or promotional campaign. Each carve-out can require separate legal review, title delivery, payment terms, compliance monitoring, and communication with a different distribution partner. These tasks add cost even when the underlying program is the same across markets. The Streaming rights market, therefore, depends on careful clearance work when owners seek wider releases.
Other drivers and restraints analyzed in the detailed report include:
- Cross-Border Localization and Multi-Territory Release Demand
- Cloud-Native Rights Operations and Automated Avails Management
- Escalating Content Licensing Costs and Margin Compression
For complete list of drivers and restraints, kindly check the Table Of Contents.
Segment Analysis
Exclusive streaming rights held 46.33% of the Streaming rights market size in 2025, making them the leading rights category. Their position reflects the value of content that a service can offer as unavailable elsewhere, particularly where viewers want immediate access. Exclusivity can support subscriber acquisition and can justify licensing fees that a non-exclusive agreement may not support. Sports and live events are important because their time-sensitive audience can make a premium, exclusive arrangement more valuable. Amazon's NBA agreement demonstrated the continued preference for high-value, exclusive live rights within the Streaming rights market.
Windowed streaming rights are projected to expand at a CAGR of 7.76% through 2031, the strongest rate in this rights group. These agreements let owners release a program through subscription, ad-supported, and broader licensing outlets in a planned sequence. A shorter window can help a title earn revenue from more than 1 route while preserving the value of its first release. Platforms can obtain appealing content without committing to a long exclusive term, which gives owners more room to manage later availability. Non-exclusive, sublicensing, clip, and format agreements remain useful parts of the Streaming rights market because they broaden the ways intellectual property can be licensed.
Complete Report Scope:
- By Rights
- Exclusive Streaming Rights
- Non-Exclusive Streaming Rights
- Windowed Streaming Rights
- Other Rights
- By Content Type
- Movies and Films
- TV Shows and Episodic Content
- Documentaries
- Other Content Types
- By End User
- OTT Streaming Platforms
- Broadcasters
- Telecom and Pay-TV Operators
- Media and Entertainment Companies
- Other End Users
- By Geography
- North America
- United States
- Canada
- Mexico
- South America
- Brazil
- Argentina
- Chile
- Rest of South America
- Europe
- Germany
- United Kingdom
- France
- Italy
- Spain
- Rest of Europe
- Asia-Pacific
- China
- Japan
- India
- South Korea
- Australia
- Rest of Asia-Pacific
- Middle East
- Saudi Arabia
- United Arab Emirates
- Qatar
- Rest of Middle East
- Africa
- South Africa
- Egypt
- Nigeria
- Rest of Africa
- North America
Geography Analysis
North America held 42.62% of the Streaming rights market in 2025 and remained the largest regional licensing base. The United States supports this position through frequent sports renewals, major platform-studio groups, and a large group of streaming subscribers. Amazon's NBA agreement and Paramount+'s U.S. UFC agreement show the continued value of premium sports to regional buyers. Federal communications and copyright royalty frameworks affect the terms used for digital distribution. Active competition across sports, scripted programming, and live entertainment sustains rights bidding in the Streaming rights market.
Asia-Pacific is projected to expand at a CAGR of 8.24% through 2031, making it the fastest-growing geography. India is a major source of demand because local sports rights and telecom bundles can bring several services to a large consumer base. Jio's 2026 OTT bundle showed how connectivity providers can combine mobile access and entertainment access in one offer. Japan relies more on premium pricing and sports-led differentiation within a mature subscriber base, while China, South Korea, Australia, and Southeast Asia have distinct viewing and regulatory conditions. Localization rules, language needs, and varied service models make multi-territory agreements valuable but operationally demanding for the Streaming rights market.
Europe is the second-largest region by revenue, and its audiovisual market reached EUR 142 billion, equivalent to USD 155 billion, in 2024. The European Commission's review of the Audiovisual Media Services Directive can affect local content and investment duties for multi-territory services. South America has growing potential for streaming-first sports distribution, illustrated by CazeTV's rights to all 104 matches of the 2026 FIFA World Cup and to the 2026 Winter Olympics and 2028 Summer Olympics. The Middle East is supported by sports and entertainment investment, while Africa is developing from a lower base where FAST services can offer a more accessible entry point.
- Netflix, Inc.
- The Walt Disney Company
- Warner Bros. Discovery, Inc.
- Amazon.com, Inc.
- Apple Inc.
- Alphabet Inc.
- Paramount Global
- Comcast Corporation
- Fox Corporation
- Spotify Technology S.A.
- Sony Group Corporation
- TelevisaUnivision, Inc.
- Viaplay Group AB
- DAZN Group Limited
- beIN MEDIA GROUP
- Vubiquity, Inc.
- Rightsline, Inc.
- Whip Media Group, Inc.
- FADEL, Inc.
- Vistex, Inc.
Additional Benefits:
- The market estimate (ME) sheet in Excel format
- 3 months of analyst support
TABLE OF CONTENTS
1 INTRODUCTION
- 1.1 Study Assumptions and Market Definition
- 1.2 Scope of the Study
2 RESEARCH METHODOLOGY
3 EXECUTIVE SUMMARY
4 MARKET LANDSCAPE
- 4.1 Market Overview
- 4.2 Market Drivers
- 4.2.1 Exclusive Sports and Live Event Rights Premiumization
- 4.2.2 FAST, AVOD, and Ad-Supported Window Expansion
- 4.2.3 Cross-Border Localization and Multi-Territory Release Demand
- 4.2.4 Cloud-Native Rights Operations and Automated Avails Management
- 4.2.5 AI-Powered Metadata, Fingerprinting, and Rights Matching
- 4.2.6 Bundled Distribution Deals Across Telco and Streaming Ecosystems
- 4.3 Market Restraints
- 4.3.1 Fragmented Rights Ownership and Territorial Clearing Complexity
- 4.3.2 Escalating Content Licensing Costs and Margin Compression
- 4.3.3 Persistent Piracy, Leakage, and Unauthorized Restreaming
- 4.3.4 Data Privacy, Localization, and Compliance Burden
- 4.4 Industry Value Chain Analysis
- 4.5 Regulatory Landscape
- 4.6 Technological Outlook
- 4.7 Impact of Macroeconomic Factors on the Market
- 4.8 Porter's Five Forces Analysis
- 4.8.1 Bargaining Power of Suppliers
- 4.8.2 Bargaining Power of Buyers
- 4.8.3 Threat of New Entrants
- 4.8.4 Threat of Substitutes
- 4.8.5 Competitive Rivalry
5 MARKET SIZE AND GROWTH FORECASTS (VALUE)
- 5.1 By Rights
- 5.1.1 Exclusive Streaming Rights
- 5.1.2 Non-Exclusive Streaming Rights
- 5.1.3 Windowed Streaming Rights
- 5.1.4 Other Rights
- 5.2 By Content Type
- 5.2.1 Movies and Films
- 5.2.2 TV Shows and Episodic Content
- 5.2.3 Documentaries
- 5.2.4 Other Content Types
- 5.3 By End User
- 5.3.1 OTT Streaming Platforms
- 5.3.2 Broadcasters
- 5.3.3 Telecom and Pay-TV Operators
- 5.3.4 Media and Entertainment Companies
- 5.3.5 Other End Users
- 5.4 By Geography
- 5.4.1 North America
- 5.4.1.1 United States
- 5.4.1.2 Canada
- 5.4.1.3 Mexico
- 5.4.2 South America
- 5.4.2.1 Brazil
- 5.4.2.2 Argentina
- 5.4.2.3 Chile
- 5.4.2.4 Rest of South America
- 5.4.3 Europe
- 5.4.3.1 Germany
- 5.4.3.2 United Kingdom
- 5.4.3.3 France
- 5.4.3.4 Italy
- 5.4.3.5 Spain
- 5.4.3.6 Rest of Europe
- 5.4.4 Asia-Pacific
- 5.4.4.1 China
- 5.4.4.2 Japan
- 5.4.4.3 India
- 5.4.4.4 South Korea
- 5.4.4.5 Australia
- 5.4.4.6 Rest of Asia-Pacific
- 5.4.5 Middle East
- 5.4.5.1 Saudi Arabia
- 5.4.5.2 United Arab Emirates
- 5.4.5.3 Qatar
- 5.4.5.4 Rest of Middle East
- 5.4.6 Africa
- 5.4.6.1 South Africa
- 5.4.6.2 Egypt
- 5.4.6.3 Nigeria
- 5.4.6.4 Rest of Africa
- 5.4.1 North America
6 COMPETITIVE LANDSCAPE
- 6.1 Market Concentration
- 6.2 Strategic Moves
- 6.3 Vendor Positioning Analysis
- 6.4 Company Profiles (includes Global Level Overview, Market Level Overview, Core Segments, Financials as available, Strategic Information, Products and Services, Recent Developments)
- 6.4.1 Netflix, Inc.
- 6.4.2 The Walt Disney Company
- 6.4.3 Warner Bros. Discovery, Inc.
- 6.4.4 Amazon.com, Inc.
- 6.4.5 Apple Inc.
- 6.4.6 Alphabet Inc.
- 6.4.7 Paramount Global
- 6.4.8 Comcast Corporation
- 6.4.9 Fox Corporation
- 6.4.10 Spotify Technology S.A.
- 6.4.11 Sony Group Corporation
- 6.4.12 TelevisaUnivision, Inc.
- 6.4.13 Viaplay Group AB
- 6.4.14 DAZN Group Limited
- 6.4.15 beIN MEDIA GROUP
- 6.4.16 Vubiquity, Inc.
- 6.4.17 Rightsline, Inc.
- 6.4.18 Whip Media Group, Inc.
- 6.4.19 FADEL, Inc.
- 6.4.20 Vistex, Inc.
7 MARKET OPPORTUNITIES AND FUTURE OUTLOOK
- 7.1 White-Space and Unmet-Need Assessment

 AI語音版權管理全球市場規模、佔有率、趨勢和成長分析報告(2026-2034年)全球企業權限管理解決方案市場規模、佔有率、趨勢和成長分析報告(2026-2034年)
 數位版權管理(DRM):市場佔有率分析、產業趨勢與統計數據、成長預測(2026-2031)
 網路版權市場-2026-2032年全球市場預測數位版權管理 (DRM) 市場:按元件、內容類型、平台類型、部署類型、產業和組織規模分類-2026-2032 年全球市場預測
 數位版權管理市場:按組件、部署方式、組織規模、最終用戶產業和地區分類
 媒體和娛樂產業數位版權管理市場:市場規模、佔有率和趨勢分析報告:按應用程式、公司規模、地區和細分市場預測(2026-2033 年)
 2026-2030年全球數位版權管理市場
 數位版權管理 (DRM) 市場報告:按元件、部署形式、企業規模、應用程式、最終用戶產業和地區分類 (2026–2034)全球反盜版市場規模、佔有率、趨勢和成長分析報告(2026-2034)