


 |
市場調查報告書
商品編碼
2117521
VR串流媒體:市佔率分析、產業趨勢與統計、成長預測(2026-2031年)VR Streaming - Market Share Analysis, Industry Trends & Statistics, Growth Forecasts (2026 - 2031) |
||||||

※ 本網頁內容可能與最新版本有所差異。詳細情況請與我們聯繫。
根據 Mordor Intelligence 估計,VR 串流媒體市場在 2025 年的價值為 26.7 億美元,在 2026 年的價值為 30.5 億美元,到 2031 年的價值為 63.3 億美元。
預計 2026 年至 2031 年的預測期內複合年成長率將達到 15.72%。
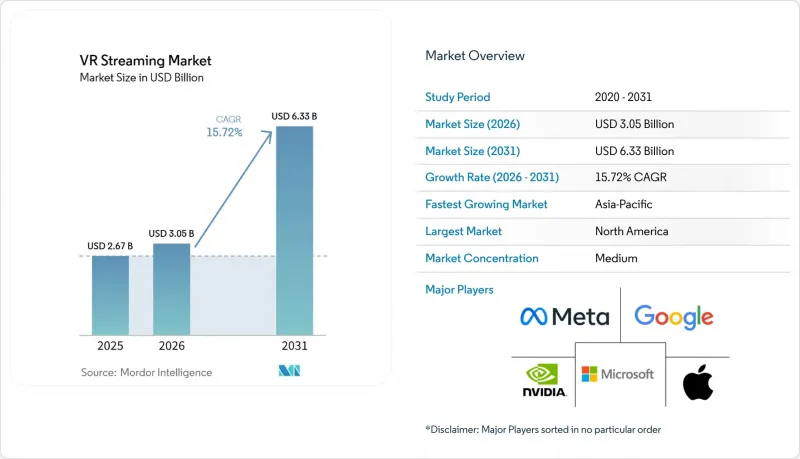
本報告按串流類型(VR直播、VR點播、互動/即時VR直播)、設備類型(獨立式VR頭戴裝置、有線VR頭戴裝置、智慧型手機VR播放器等)、內容類型(音樂和現場表演、體育賽事、教育和培訓、社交和社區活動等)以及地區進行細分。市場預測以美元(USD)為單位。
全球VR串流媒體市場趨勢與洞察
低延遲 5G 和 Wi-Fi 7 播放環境
VR串流媒體市場依賴低延遲和穩定的通訊環境,因為頭部移動導致的延遲增加會顯著降低觀看舒適度。 Wi-Fi 7多鏈路運行已展現出其對高密度XR流量的強大支援能力,學術測試表明,在相同頻寬條件下,其可同時連接比單鏈路運行多50%的VR用戶。這對於直播體育賽事、音樂會和共用虛擬活動尤其重要,因為影像延遲會直接影響沉浸感。 NTT和NTT Docomo於2026年進行的IOWN APN實驗也表明,在平均單向網路延遲為0.04毫秒的情況下,與粉絲進行即時互動是可行的,這證實了更強大的網路架構可以拓展商業應用場景。因此,VR串流媒體市場在高效能無線基礎設施已大規模普及的地區發展最為迅速。
降低獨立式耳機價格
在預測期內,隨著獨立式頭顯價格的下降,一般消費者能夠負擔得起,VR串流媒體市場將受益匪淺。獨立式裝置無需單獨的主機、智慧型手機或PC,這使得初次體驗者更容易做出購買決定。這項轉變意義重大,因為消費者在考慮單一設備而非多設備組合時,接受度往往會更高。即使2026年組件價格可能面臨暫時的成本壓力,但長期趨勢是VR設備將更加普及。這將透過擴大用戶群來支持VR串流媒體市場的發展,使更多用戶能夠觀看身臨其境型直播、隨選節目和互動內容,而無需額外購買硬體。
對快速變化內容的延遲敏感
VR串流媒體市場在處理快節奏內容時仍面臨技術瓶頸,即使是輕微的延遲也會影響舒適度和效能。 IEEE 2025年的一項研究表明,超過50毫秒的延遲會顯著降低任務執行效率,並在使用者意識到延遲之前觸發神經反應。因此,在不穩定的網路環境下擴展快速鏡頭移動、互動式體育賽事觀看和觀眾參與等元素極具挑戰性。另一項IEEE的綜合性綜述發現,延遲是網路暈動症研究中最常被提及的硬體風險因素,在72%的文獻中均有提及。這意味著VR串流媒體市場將繼續主要在高效能無線通訊已穩定可用的地區創造收入。
細分市場分析
到2025年,VR直播將佔VR串流媒體收入的47.35%,成為VR串流媒體市場中最大的內容形式。這一主導地位反映了一個簡單的事實:即時事件帶來的緊迫感是存檔觀看無法完全複製的。當價值在於親臨現場時,觀眾更願意付費觀看。因此,在整個VR串流媒體市場中,直播觀賞在體育賽事、音樂會和特別活動的節目安排中仍然佔據核心地位。
點播串流媒體繼續發揮至關重要的作用,使用戶能夠在參與直播活動之前體驗身臨其境型觀看內容。它還為平台提供內容庫,有助於在重大活動之間維持和擴大用戶互動。預計到2031年,互動式即時VR串流將以16.07%的複合年成長率成長,成為VR串流媒體市場中成長最快的串流媒體格式。 2026年,NTT和NTT Docomo舉辦了一場VR粉絲見面會,展示了這個發展方向。該見面會在平均單向網路延遲僅為0.04毫秒的環境下實現了即時高觸感互動,顯示參與式體驗如何成為付費體驗的一部分。
區域分析
到2025年,北美將佔全球銷售額的44.73%,成為VR串流媒體市場最大的地區。美國之所以佔據主導地位,是因為平台營運商、體育賽事版權擁有者、企業用戶以及加值內容的預算都集中在同一個生態系統中。 2026年1月,蘋果公司為符合Apple Vision Pro資格的Spectrum用戶推出了「Spectrum Front Row」服務,這表明美國的版權結構已經能夠支持商業身臨其境型體育賽事串流服務的發展。歐洲仍然是一個重要的市場,因為工業模擬和企業培訓正在推動VR在純粹的消費者娛樂之外的領域產生需求。
根據Focal Point XR的一份報告顯示,2025年法國網球公開賽將首次以8K解析度、單眼50幀/秒的幀率,透過Apple Vision Pro進行身臨其境型180°立體網球直播,這表明全部區域對高階身臨其境型體育賽事製作的早期投資正在興起。預計到2031年,亞太地區的複合年成長率將達到16.48%,成為VR串流媒體市場成長最快的區域。這一成長得益於卓越的網路品質、蓬勃發展的虛擬娛樂生態系統以及機構對身臨其境型內容的廣泛興趣。日本尤為突出,其虛擬主播(VTuber)和實況活動經濟正在為VR串流媒體市場帶來永續的收入模式,超越了一次性的演示活動。
NTT 和 NTT Docomo 將於 2026 年透過 IOWN APN 試點計畫展示這項成果,與傳統攝影棚設備相比,該計畫可降低 20% 的活動管理成本,同時實現與粉絲的即時虛擬互動。中國在消費娛樂和企業應用方面均取得了長足發展,而印度和澳洲則透過不同的部署模式推動了對 VR 接入和培訓的需求。南美洲的 VR 串流市場仍處於擴張初期,巴西作為區域中心發揮重要作用。由於網路基礎設施建設和頭戴裝置價格等挑戰持續阻礙 VR 的廣泛應用,其普及速度相對緩慢。在中東,由於政府對數位娛樂和身臨其境型體驗基礎設施的投資,VR 市場正在興起。非洲是 VR 串流媒體市場中最小的區域市場,預計短期發展將取決於早期採用者國家/地區頻寬。
其他好處:
- Excel格式的市場預測(ME)表
- 3個月的分析師支持
目錄
第1章:引言
- 研究假設和市場定義
- 調查範圍
第2章:調查方法
第3章執行摘要
第4章 市場狀況
- 市場概覽
- 市場促進因素
- 低延遲 5G 和 Wi-Fi 7 播放環境
- 獨立式耳機價格下降
- 引進邊緣渲染技術,實現高保真雲端交付
- 跨裝置、內容和雲端存取的訂閱商品搭售。
- 企業培訓對遠距身臨其境型教學的需求日益成長。
- 跨平台內容移植,支援不同耳機和服務之間的移植。
- 市場限制因素
- 對快速變化內容的延遲敏感
- 設備生態系統碎片化與應用商店的限制
- 優質VR內容庫有限。
- 舒適度、暈動病和時間限制
- 產業價值鏈分析
- 監理情勢
- 技術展望
- 波特五力分析
- 宏觀經濟因素對市場的影響
第5章 市場規模與成長預測
- 按串流媒體類型
- 即時VR直播
- 按需VR串流媒體
- 互動式/即時虛擬實境串流
- 依設備類型
- 獨立式VR頭戴裝置
- 有線VR頭戴裝置
- 相容於智慧型手機的VR顯示器
- 主機式VR設定
- 按內容類型
- 音樂和現場表演
- 運動的
- 教育和培訓
- 品牌體驗、品牌活動、廣告
- 社交活動和社區活動
- 其他內容類型
- 按地區
- 北美洲
- 美國
- 加拿大
- 墨西哥
- 南美洲
- 巴西
- 阿根廷
- 智利
- 其他南美國家
- 歐洲
- 德國
- 英國
- 法國
- 義大利
- 西班牙
- 其他歐洲國家
- 亞太地區
- 中國
- 日本
- 印度
- 韓國
- 澳洲
- 其他亞太國家
- 中東
- 沙烏地阿拉伯
- 阿拉伯聯合大公國
- 卡達
- 其他中東國家
- 非洲
- 南非
- 埃及
- 奈及利亞
- 其他非洲國家
- 北美洲
第6章 競爭情勢
- 市場集中度
- 策略趨勢
- Vendor Positioning Analysis
- 公司簡介
- Apple Inc.
- ByteDance Ltd.
- Ericsson
- Google LLC
- HTC Corporation
- Intel Corporation
- Meta Platforms, Inc.
- Microsoft Corporation
- NVIDIA Corporation
- PICO Immersive Pte. Ltd.
- Qualcomm Incorporated
- Samsung Electronics Co., Ltd.
- Sony Group Corporation
- Tencent Holdings Limited
- Unity Software Inc.
- Valve Corporation
- Varjo Technologies Oy
- Amazon.com, Inc.
- NetEase, Inc.
第7章 市場機會與未來展望
According to Mordor Intelligence, the VR streaming market size was valued at USD 2.67 billion in 2025 and estimated to grow from USD 3.05 billion in 2026 to reach USD 6.33 billion by 2031, at a CAGR of 15.72% during the forecast period 2026-2031.
This report is Segmented by Streaming Type (Live VR Streaming, On-Demand VR Streaming, and Interactive/Real-Time VR Streaming), Device Type (Standalone VR Headsets, Tethered VR Headsets, Smartphone-Based VR Viewers, and More), Content Type (Music and Live Performances, Sports, Education and Training, Social and Community Events, and More), and Geography. The Market Forecasts are Provided in Terms of Value (USD).
Global VR Streaming Market Trends and Insights
Lower Latency 5G And Wi-Fi 7 Playback Conditions
The VR streaming market relies on low, stable latency because viewing comfort drops sharply as latency increases during head movement. Wi-Fi 7 multi-link operation has already shown stronger support for dense XR traffic, with academic testing indicating up to 50% more concurrent VR users than single-link operation under comparable bandwidth conditions. This matters most for live sports, concerts, and shared virtual events where image delay directly affects immersion. The NTT and NTT DOCOMO IOWN APN experiment in 2026 also showed that real-time fan interaction could run at an average one-way network latency of 0.04 milliseconds, reinforcing that a stronger network architecture can expand commercial use cases. As a result, the VR streaming market is moving fastest in locations where high-performance wireless infrastructure is already usable at scale.
Falling Standalone Headset Prices
The VR streaming market should benefit as standalone headset pricing becomes easier for mainstream buyers over the forecast period. Standalone devices eliminate the need for a separate console, smartphone, or PC, simplifying the purchase decision for first-time users. That shift matters because adoption tends to rise when the buyer sees one device rather than a multi-device setup. Even with temporary cost pressure on components in 2026, the broader trend still favors broader access over time. This supports the VR streaming market by expanding the installed base able to consume immersive live, on-demand, and interactive content without additional hardware friction.
Latency Sensitivity in High-Motion Content
The VR streaming market still faces a technical ceiling for high-motion content because even modest delays can compromise comfort and performance. IEEE research in 2025 found that latency above 50 milliseconds measurably reduced task performance and triggered neural responses before users consciously recognized the delay. That makes fast camera movement, interactive sports viewing, and audience participation harder to scale across uneven network environments. A separate IEEE umbrella review found that latency was the most consistently cited hardware risk factor in cybersickness research, appearing in 72% of the reviewed literature. This means the VR streaming market will continue to generate revenue first in areas where high-performance wireless coverage is already reliable.
Other drivers and restraints analyzed in the detailed report include:
- Edge Rendering Adoption for High-Fidelity Cloud Delivery
- Subscription Bundling Across Device, Content, and Cloud Access
- Fragmented Device Ecosystems and App Store Constraints
For complete list of drivers and restraints, kindly check the Table Of Contents.
Segment Analysis
Live VR streaming accounted for 47.35% of revenue in 2025, making it the largest format in the VR streaming market. Its lead reflects the simple fact that real-time events create urgency that catalog viewing cannot fully match. Audiences are more likely to pay for access when the value depends on being present during the event itself. That keeps live viewing central to sports, concerts, and special event programming across the VR streaming market.
On-demand streaming still plays an important role because it introduces users to immersive viewing before they commit to live sessions. It also gives platforms a library layer that helps extend engagement between tentpole events. Interactive, real-time VR streaming is projected to expand at a 16.07% CAGR through 2031, making it the fastest-growing streaming type in the VR streaming market. NTT and NTT DOCOMO demonstrated this direction in 2026 through a VR fan meeting featuring real-time high-five interaction at an average one-way network latency of 0.04 milliseconds, showing how participation can become part of the paid experience.
Complete Report Scope:
- By Streaming Type
- Live VR Streaming
- On-Demand VR Streaming
- Interactive/Real-Time VR Streaming
- By Device Type
- Standalone VR Headsets
- Tethered VR Headsets
- Smartphone-Based VR Viewers
- Console-Based VR Setups
- By Content Type
- Music and Live Performances
- Sports
- Education and Training
- Branded Experiences, brand events and Advertising
- Social and Community Events
- Other Content Types
- By Geography
- North America
- United States
- Canada
- Mexico
- South America
- Brazil
- Argentina
- Chile
- Rest of South America
- Europe
- Germany
- United Kingdom
- France
- Italy
- Spain
- Rest of Europe
- Asia-Pacific
- China
- Japan
- India
- South Korea
- Australia
- Rest of Asia-Pacific
- Middle East
- Saudi Arabia
- United Arab Emirates
- Qatar
- Rest of Middle East
- Africa
- South Africa
- Egypt
- Nigeria
- Rest of Africa
- North America
Geography Analysis
North America accounted for 44.73% of global revenue in 2025, making it the largest region in the VR streaming market. The United States leads because it brings together platform operators, sports rights holders, enterprise adopters, and premium content budgets into a single ecosystem. Apple launches Spectrum Front Row in January 2026 for qualifying Spectrum subscribers on the Apple Vision Pro, demonstrating that U.S. rights structures are already supporting commercial immersive sports distribution. Europe remains important because industrial simulation and enterprise training create demand outside pure consumer entertainment.
Focal Point XR reported that Roland-Garros 2025 delivered the first 8K-per-eye, 50 FPS live, immersive, 180° stereoscopic tennis livestream on Apple Vision Pro, signaling early investment in premium immersive sports production across the region. Asia-Pacific is projected to grow at a 16.48% CAGR through 2031, making it the fastest-expanding regional segment in the VR streaming market. Growth in the region is supported by strong network quality, active virtual entertainment ecosystems, and wider institutional interest in immersive formats. Japan stands out because its VTuber and live-event economy provides the VR streaming market with a recurring commercial model beyond one-off demonstrations.
NTT and NTT DOCOMO show this in 2026 through an IOWN APN experiment that reduced event operating costs by 20% versus conventional studio setups while enabling real-time virtual fan interaction. China is developing along both consumer entertainment and enterprise deployment tracks, while India and Australia add access and training demand through different adoption models. South America remains in an earlier expansion phase of the VR streaming market, with Brazil acting as the primary regional hub. Adoption is moving more slowly because network readiness and headset affordability still limit wider scale. The Middle East is emerging through public investment in digital entertainment and immersive experience infrastructure. Africa is the smallest regional segment in the VR streaming market, and near-term progress remains tied to bandwidth upgrades and device access in early-adopter countries.
- Apple Inc.
- ByteDance Ltd.
- Ericsson
- Google LLC
- HTC Corporation
- Intel Corporation
- Meta Platforms, Inc.
- Microsoft Corporation
- NVIDIA Corporation
- PICO Immersive Pte. Ltd.
- Qualcomm Incorporated
- Samsung Electronics Co., Ltd.
- Sony Group Corporation
- Tencent Holdings Limited
- Unity Software Inc.
- Valve Corporation
- Varjo Technologies Oy
- Amazon.com, Inc.
- NetEase, Inc.
Additional Benefits:
- The market estimate (ME) sheet in Excel format
- 3 months of analyst support
TABLE OF CONTENTS
1 INTRODUCTION
- 1.1 Study Assumptions and Market Definition
- 1.2 Scope of The Study
2 RESEARCH METHODOLOGY
3 EXECUTIVE SUMMARY
4 MARKET LANDSCAPE
- 4.1 Market Overview
- 4.2 Market Drivers
- 4.2.1 Lower Latency 5G and Wi-Fi 7 Playback Conditions
- 4.2.2 Falling Standalone Headset Prices
- 4.2.3 Edge Rendering Adoption for High-Fidelity Cloud Delivery
- 4.2.4 Subscription Bundling Across Device, Content, and Cloud Access
- 4.2.5 Enterprise Training Demand for Remote Immersive Delivery
- 4.2.6 Cross-Platform Content Portability Across Headsets and Services
- 4.3 Market Restraints
- 4.3.1 Latency Sensitivity in High Motion Content
- 4.3.2 Fragmented Device Ecosystems and App Store Constraints
- 4.3.3 Limited Premium VR Content Libraries
- 4.3.4 Comfort, Motion Sickness, and Session Duration Limits
- 4.4 Industry Value Chain Analysis
- 4.5 Regulatory Landscape
- 4.6 Technological Outlook
- 4.7 Porter's Five Forces Analysis
- 4.7.1 Bargaining Power of Buyers
- 4.7.2 Bargaining Power of Suppliers
- 4.7.3 Threat of New Entrants
- 4.7.4 Threat of Substitutes
- 4.7.5 Intensity of Competitive Rivalry
- 4.8 Impact of Macroeconomic Factors on the Market
5 MARKET SIZE AND GROWTH FORECASTS (VALUE)
- 5.1 By Streaming Type
- 5.1.1 Live VR Streaming
- 5.1.2 On-Demand VR Streaming
- 5.1.3 Interactive/Real-Time VR Streaming
- 5.2 By Device Type
- 5.2.1 Standalone VR Headsets
- 5.2.2 Tethered VR Headsets
- 5.2.3 Smartphone-Based VR Viewers
- 5.2.4 Console-Based VR Setups
- 5.3 By Content Type
- 5.3.1 Music and Live Performances
- 5.3.2 Sports
- 5.3.3 Education and Training
- 5.3.4 Branded Experiences, brand events and Advertising
- 5.3.5 Social and Community Events
- 5.3.6 Other Content Types
- 5.4 By Geography
- 5.4.1 North America
- 5.4.1.1 United States
- 5.4.1.2 Canada
- 5.4.1.3 Mexico
- 5.4.2 South America
- 5.4.2.1 Brazil
- 5.4.2.2 Argentina
- 5.4.2.3 Chile
- 5.4.2.4 Rest of South America
- 5.4.3 Europe
- 5.4.3.1 Germany
- 5.4.3.2 United Kingdom
- 5.4.3.3 France
- 5.4.3.4 Italy
- 5.4.3.5 Spain
- 5.4.3.6 Rest of Europe
- 5.4.4 Asia-Pacific
- 5.4.4.1 China
- 5.4.4.2 Japan
- 5.4.4.3 India
- 5.4.4.4 South Korea
- 5.4.4.5 Australia
- 5.4.4.6 Rest of Asia-Pacific
- 5.4.5 Middle East
- 5.4.5.1 Saudi Arabia
- 5.4.5.2 United Arab Emirates
- 5.4.5.3 Qatar
- 5.4.5.4 Rest of Middle East
- 5.4.6 Africa
- 5.4.6.1 South Africa
- 5.4.6.2 Egypt
- 5.4.6.3 Nigeria
- 5.4.6.4 Rest of Africa
- 5.4.1 North America
6 COMPETITIVE LANDSCAPE
- 6.1 Market Concentration
- 6.2 Strategic Moves
- 6.3 Vendor Positioning Analysis
- 6.4 Company Profiles (includes Global Level Overview, Market Level Overview, Core Segments, Financials as available, Strategic Information, Market Rank/Share, Products and Services, Recent Developments)
- 6.4.1 Apple Inc.
- 6.4.2 ByteDance Ltd.
- 6.4.3 Ericsson
- 6.4.4 Google LLC
- 6.4.5 HTC Corporation
- 6.4.6 Intel Corporation
- 6.4.7 Meta Platforms, Inc.
- 6.4.8 Microsoft Corporation
- 6.4.9 NVIDIA Corporation
- 6.4.10 PICO Immersive Pte. Ltd.
- 6.4.11 Qualcomm Incorporated
- 6.4.12 Samsung Electronics Co., Ltd.
- 6.4.13 Sony Group Corporation
- 6.4.14 Tencent Holdings Limited
- 6.4.15 Unity Software Inc.
- 6.4.16 Valve Corporation
- 6.4.17 Varjo Technologies Oy
- 6.4.18 Amazon.com, Inc.
- 6.4.19 NetEase, Inc.
7 MARKET OPPORTUNITIES AND FUTURE OUTLOOK
- 7.1 White-Space and Unmet-Need Assessment

 VR行銷服務:市場佔有率分析、產業趨勢與統計、成長預測(2026-2031年)VR內容製作服務:市佔率分析、產業趨勢與統計、成長預測(2026-2031年)
 虛擬實境(VR)內容市場:2026-2032年全球市場預測(按內容類型、設備類型、收入模式、分發平台和最終用戶分類)
 虛擬實境(VR)內容製作市場規模、佔有率和成長分析:按內容類型、技術、應用、最終用戶和地區分類-2026-2033年產業預測
 虛擬實境(VR)內容製作市場:按內容類型、組件、最終用戶和地區分類
 2026年全球虛擬內容製作市場報告VR內容製作市場:按組件、授權模式、最終用戶、部署方法和發行管道分類-2026年至2032年全球預測
 虛擬實境(VR)內容製作市場報告:按內容類型、組件、最終用戶和地區分類(2026-2034 年)
 虛擬偶像市場規模、佔有率和成長分析:按類型、技術、內容形式、獲利模式、目標受眾和地區分類——2026-2033年產業預測
 虛擬內容創作市場分析與預測(至2035年):類型、產品類型、服務、技術、組件、應用、設備、流程、最終用戶