


 |
市場調查報告書
商品編碼
2117452
電動滑板車:市場佔有率分析、產業趨勢與統計、成長預測(2025-2030 年)Electric Scooters - Market Share Analysis, Industry Trends & Statistics, Growth Forecasts (2025 - 2030) |
||||||

※ 本網頁內容可能與最新版本有所差異。詳細情況請與我們聯繫。
根據 Mordor Intelligence 預測,電動滑板車市場規模預計將在 2025 年達到 203.5 億美元,到 2030 年達到 336.1 億美元,預測期內複合年成長率為 10.56%。
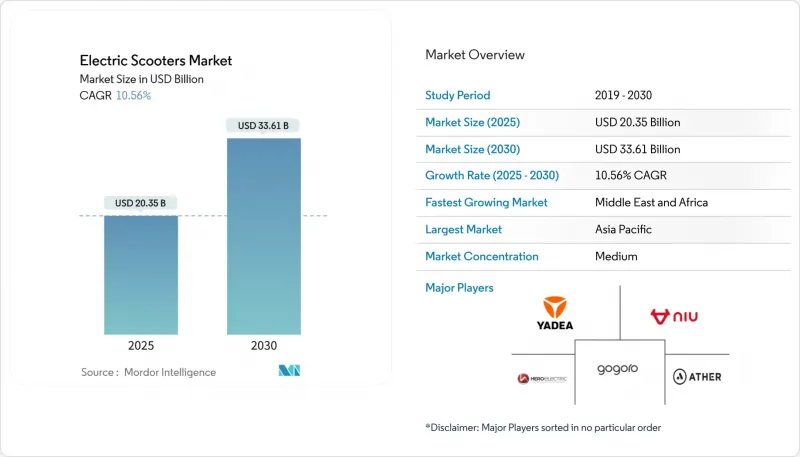
本報告按電池類型(鉛酸電池、鋰離子電池等)、輸出功率(小於3.6千瓦、3.6-7.2千瓦等)、馬達/驅動系統(輪轂式馬達、皮帶驅動等)、應用領域(個人、商業/企業車隊等)和地區(北美、南美等)進行細分。市場預測以貨幣價值(美元)和銷售(台)兩種形式呈現。
全球電動滑板車市場趨勢及洞察
都市區交通堵塞日益嚴重,以及對最後一公里運輸的需求不斷成長。
大都會圈通勤者經常遭遇長時間的交通堵塞,造成大量時間浪費和沮喪。然而,電動滑板車提供了一種高效的替代方案,它能夠靈活穿梭於擁擠路段,減少停車時間,並與大眾運輸無縫銜接。這些優勢使得電動滑板車在都市區出行中日益普及。鑑於這一趨勢,各地政府正在採取措施支持電動滑板車的推廣。例如,巴黎設立了2500個專用滑板車停車位。這是一項旨在減少城市交通堵塞、提高安全性並促進有序使用的策略性措施。這些舉措凸顯了電動滑板車在解決城市交通難題方面日益重要的角色。
政府激勵和補貼計劃
財政支持正在加速電動二輪車的普及。印度的「2024年電動出行促進計畫」累計1,090億盧比(約13億美元)用於電動二輪車,旨在降低零售價格並資金籌措。在英國,強制性車牌和頭盔的佩戴確立了合規標準,有效降低了車隊營運商的營運風險。這些法規確保了安全性和標準化,並促進了可預測的需求,使製造商能夠最佳化產能。此外,穩定的需求使製造商能夠協商更有利的供應契約,從而提高成本效益並簡化營運流程。這些政策有助於創造一個穩定且監管良好的市場環境,使製造商和車隊營運商都從中受益。
公共充電和換電基礎設施有限
在許多城市,專用充電站數量稀少,造成沒有專用停車位的用戶許多不便。這種短缺迫使用戶依賴公共基礎設施,而公共基礎設施往往無法滿足日益成長的電動車充電需求。換電網路或許是一種潛在的解決方案,但其建造和維護成本高。此外,不同品牌之間缺乏互通性,限制了使用者只能使用特定品牌的生態系統,從而降低了柔軟性和便利性。這種情況加劇了用戶對續航里程的擔憂,導致潛在買家在購買電動車時猶豫不決。因此,這種猶豫阻礙了電動車保有量的擴張,尤其是在住宅和停車本就面臨嚴峻挑戰的人口密集都市區。
細分市場分析
2024年,鋰離子電池技術在電動滑板車市場佔據79.33%的佔有率,主要得益於其高達300Wh/kg的能量密度和持續的成本下降。鉛酸電池組目前仍用於價格敏感型車型,但隨著與鋰離子電池的價格差距縮小,其吸引力正在下降。預計到2030年,鈉離子電池將以14.25%的複合年成長率成長,這主要得益於其更低的每千瓦時價格和更佳的熱穩定性。寧德時代和比亞迪等製造商正在其車隊車型中採用鈉離子電池,這不僅拓寬了原料的選擇範圍,還能有效應對鋰供應的波動。
高能量密度鋰聚合物電池適用於注重輕薄外形的高階電動滑板車,而磷酸鋰鐵(LFP)電池則在車隊市場中佔據越來越大的市場佔有率,因為車隊市場對電池的循環壽命要求高,成本也是主要考量。隨著鈉離子電池產能的擴大,其在電動滑板車市場的佔有率預計將在不進行重大設計變更的情況下超過先前的預期。鈉離子電池具有良好的安全性和寬廣的動作溫度範圍,在熱帶地區極具吸引力,並有望從2026年起贏得市政車隊競標。
到2024年,功率在3.6-7.2千瓦之間的電動滑板車將佔據電動滑板車市場39.45%的佔有率,其最高時速可達45-60公里/小時,且在許多國家/地區擁有相對寬鬆的駕照要求。車主傾向於選擇這一功率等級的電動滑板車用於日常通勤,而車隊採購商則看重其簡化的營運要求。儘管功率超過10千瓦的電動滑板車市場規模較小,但由於市場對能夠上高速公路行駛的車輛的需求不斷成長,預計該市場將以11.66%的複合年成長率成長。
BMWCE 04等高階車型,憑藉31千瓦的輸出功率和130公里的續航里程,展現了人們對高功率出行方式日益成長的需求。歐盟修訂後的L3e類法規將輸出功率限制在15千瓦以內,為踏板車性能的提升創造了空間。隨著踏板車在郊區(長途出行較為普遍)的普及,對高功率的需求可能會持續成長。
區域分析
2024年,亞太地區佔了電動滑板車市場75.14%的佔有率。這主要得益於中國充分利用其電池供應鏈優勢,以及印度在電動車推廣獎勵下實現了顯著的銷售成長。 Ola Electric則依靠本土採購和積極的零售融資策略來支撐其發展。印尼和越南等東南亞國家正透過稅收優惠和擴建組裝廠來提振區域需求。
歐洲持續保持穩健成長的動力。 2024年,歐洲的保險覆蓋範圍明確,簡化了車隊營運。德國修訂了牌照標準,簡化了類別定義。義大利修訂了道路交通法,引入了關於車牌和頭盔的規定,以支持商業保險承保,同時加強對安全標準的遵守。成熟的充電網路和低排放氣體區正在增強消費者信心。
在北美,隨著各州統一監管,市場呈現穩定成長態勢。加州推出的補貼計畫顯著降低了車輛擁有成本,從而增加了經銷商的庫存。預計到2030年,中東和非洲地區的複合年成長率將達到11.36%,該地區受益於杜拜的「綠色出行策略」和利雅德的試點走廊項目,後者在路邊安裝了電池更換站。儘管基礎設施仍存在差異,但快速的城市發展為建造專用充電叢集提供了廣闊的空間。
其他好處:
- Excel格式的市場預測(ME)表
- 3個月的分析師支持
目錄
第1章:引言
- 市場分析與定義的前提條件
- 分析範圍
第2章 分析方法
第3章執行摘要
第4章 市場狀況
- 市場概覽
- 市場促進因素
- 都市區交通堵塞日益嚴重,以及對最後一公里運輸的需求不斷成長。
- 政府獎勵計畫和補助方案
- 電子商務配送車輛的快速擴張
- 鋰離子電池的價格正在下降。
- 「電池即服務」與「可更換電池組」的生態系統
- 利用物聯網進行預測性維護可以提高車輛運作。
- 市場限制因素
- 公共充電/換電基礎設施有限
- 高昂的初始實施成本以及內燃機的替代方案
- 安全召回和火災事故促使人們推出更嚴格的認證標準。
- 下一代化學技術中關鍵礦物的供應限制
- 價值鍊和供應鏈分析
- 監理情勢
- 技術展望
- 波特五力分析
第5章:預測市場規模與成長率
- 依電池類型
- 鉛酸電池
- 鋰離子電池
- 鋰離子聚合物電池
- 鈉離子電池,新光化學電池
- 依輸出類型
- 小於 3.6 千瓦
- 3.6~7.2 kW
- 7.2~10 kW
- 超過10千瓦
- 馬達/驅動系統
- 輪轂式馬達
- 皮帶傳動
- 鏈傳動
- 中置馬達
- 按最終用途
- 個人/個人
- 商業和企業車隊
- 微行程服務供應商
- 配送/物流
- 按地區
- 北美洲
- 美國
- 加拿大
- 其他北美國家
- 南美洲
- 巴西
- 阿根廷
- 其他南美國家
- 歐洲
- 英國
- 德國
- 西班牙
- 義大利
- 法國
- 俄羅斯
- 其他歐洲國家
- 亞太地區
- 印度
- 中國
- 日本
- 韓國
- 其他亞太國家
- 中東和非洲
- 阿拉伯聯合大公國
- 沙烏地阿拉伯
- 土耳其
- 埃及
- 南非
- 其他中東和非洲國家
- 北美洲
第6章 競爭情勢
- 市場集中度
- 策略趨勢
- 市佔率分析
- 公司簡介
- Yadea Technology Group
- NIU Technologies
- Hero Electric Vehicles Private Limited
- Gogoro Inc.
- Ather Energy Limited
- Okinawa Autotec Private Limited
- TVS Motor Company
- Bajaj Auto Limited
- Yamaha Motor Co. Ltd.
- BMW Motorrad
- Piaggio & C. SpA
- Ola Electric Mobility Limited
- Vmoto Limited
- Silence Urban Ecomobility
第7章 市場機會與未來展望
According to Mordor Intelligence, the electric scooters market size stands at USD 20.35 billion in 2025 and is projected to reach USD 33.61 billion by 2030, reflecting a 10.56% CAGR during the forecast period.
This report is Segmented by Battery Type (Lead-Acid, Lithium-Ion, and More), Power Output (Less Than 3. 6 KW, 3. 6-7. 2 KW, and More), Motor/Drive Type (Hub Motor, Belt Drive, and More), End-Use (Personal/Individual, Commercial and Corporate Fleets, and More), and Geography (North America, South America, and More). The Market Forecasts are Provided in Terms of Value (USD) and Volume (Units).
Global Electric Scooters Market Trends and Insights
Growing Urban Congestion and Last-Mile Mobility Demand
Commuters often find themselves ensnared in major metropolitan areas in lengthy traffic jams, leading to significant time loss and frustration. Electric scooters, however, offer an efficient alternative by deftly navigating through congested streets, reducing parking duration, and seamlessly connecting with public transport systems. These benefits make electric scooters an increasingly popular choice in the electric scooters market for urban mobility. Recognizing this trend, city administrations are implementing measures to support their adoption. For instance, Paris has designated 2,500 parking bays exclusively for scooters, a strategic move aimed at reducing urban clutter, improving safety, and promoting organized usage. Such initiatives highlight the growing role of electric scooter in addressing urban transportation challenges.
Government Incentives and Subsidy Programs
Financial support is accelerating adoption. India's Electric Mobility Promotion Scheme 2024 set aside INR 10,900 crore (USD 1.3 billion) for electric two-wheelers, reducing retail prices and improving financing access . In the United Kingdom, mandates on number plates and helmets establish compliance rules, effectively reducing operational risks for fleet operators. These regulations ensure safety and standardization and foster a predictable demand, enabling manufacturers to optimize their production capacity. Additionally, the consistency in demand allows manufacturers to negotiate more favorable supply contracts, ensuring cost efficiency and streamlined operations. Such policies contribute to a stable and well-regulated market environment, benefiting manufacturers and fleet operators.
Limited Public Charging / Swapping Infrastructure
Many cities face a shortage of designated charging points, making it difficult for users without private parking access. This scarcity forces reliance on public infrastructure, which often can't keep pace with the rising demand for electric vehicles (EVs) charging. While battery swap networks of fer a potential solution, they have high establishment and maintenance costs. Moreover, the lack of brand interoperability limits riders to a single brand's ecosystem, curtailing their flexibility and convenience. This predicament heightens range anxiety, deterring potential buyers from embracing EVs. As a result, this reluctance hampers the expansion of EV fleets, especially in crowded urban centers where housing and parking challenges are already pronounced.
Other drivers and restraints analyzed in the detailed report include:
- Rapid Expansion of E-commerce Delivery Fleets
- Declining Lithium-ion Battery Prices
- High Upfront Acquisition Cost vs. ICE Alternatives
For complete list of drivers and restraints, kindly check the Table Of Contents.
Segment Analysis
Lithium-ion technology controlled 79.33% of the electric scooters market in 2024, backed by energy density peaks of 300 Wh/kg and steady cost declines. Lead-acid packs persist in price-led models, but shrinking premiums for lithium-ion erode their appeal. Sodium-ion cells are projected to expand at a 14.25% CAGR by 2030, driven by cheaper kilowatt-hour pricing and improved thermal stability. Manufacturers such as CATL and BYD integrated sodium-ion into fleet-targeted models, broadening raw-material options and cushioning lithium supply swings .
Energy-dense lithium-polymer cells support premium scooters where slim form factors matter, while LFP variants gain share for cost-sensitive fleets needing long cycle life. As sodium-ion capacity scales, its share of the electric scooter market size could outpace earlier projections without major design overhauls. Safety records and operating-temperature breadth make sodium-ion attractive for tropical regions, positioning it to capture municipal fleet tenders from 2026.
Scooters rated 3.6-7.2 kW held 39.45% share of the electric scooters market in 2024, balancing 45-60 km/h top speeds with lenient licensing thresholds in many countries. Owners favor the segment for daily commutes, while fleet buyers appreciate simplified operator requirements. The electric scooters market size for models above 10 kW is smaller, but is forecast to expand at 11.66% CAGR as riders demand expressway-capable machines.
Premium entries like BMW's CE 04 deliver 31 kW and 130 km range, validating appetite for higher-output mobility. Regulatory updates in the EU's L3e category cap power at 15 kW, offering room for performance growth within scooter norms. Rising adoption in peri-urban zones where longer journeys are common will continue to pull demand toward the upper-power bracket.
Complete Report Scope:
- By Battery Type
- Lead-acid
- Lithium-ion
- Lithium-ion Polymer
- Sodium-ion and Emerging Chemistries
- By Power Output
- Less than 3.6 kW
- 3.6-7.2 kW
- 7.2-10 kW
- More than 10 kW
- By Motor / Drive Type
- Hub Motor
- Belt Drive
- Chain Drive
- Mid-drive Motor
- By End-Use
- Personal / Individual
- Commercial and Corporate Fleets
- Micromobility Service Providers
- Delivery and Logistics
- By Geography
- North America
- United States
- Canada
- Rest of North America
- South America
- Brazil
- Argentina
- Rest of South America
- Europe
- United Kingdom
- Germany
- Spain
- Italy
- France
- Russia
- Rest of Europe
- Asia-Pacific
- India
- China
- Japan
- South Korea
- Rest of Asia-Pacific
- Middle East and Africa
- United Arab Emirates
- Saudi Arabia
- Turkey
- Egypt
- South Africa
- Rest of Middle-East and Africa
- North America
Geography Analysis
Asia-Pacific held a 75.14% share of the electric scooter market in 2024 as China leveraged its battery supply chain and India recorded significant sales under pro-EV incentives. Ola Electric is aided by domestic sourcing and aggressive retail financing. Southeast Asian nations such as Indonesia and Vietnam are rolling out tax cuts and assembling plants, lifting regional demand.
Europe remains a steady growth engine. In 2024, Europe clarified insurance coverage, smoothing fleet operations. Germany revised licensing standards to streamline category definitions. Italy's Highway Code update introduced plate and helmet rules that enhance safety compliance while supporting commercial insurance underwriting. Mature charging networks and low-emission zones fortify consumer confidence.
North America shows incremental gains as states harmonize rules. California's rebate inclusion slashed ownership costs and spurred dealer inventories. The Middle East and Africa, forecast to post an 11.36% CAGR through 2030, benefits from Dubai's Green Mobility Strategy and Riyadh's pilot corridors that install curbside swap cabinets. Infrastructure gaps persist but rapid urban development offers a blank slate for purpose-built charging clusters.
- Yadea Technology Group
- NIU Technologies
- Hero Electric Vehicles Private Limited
- Gogoro Inc.
- Ather Energy Limited
- Okinawa Autotec Private Limited
- TVS Motor Company
- Bajaj Auto Limited
- Yamaha Motor Co. Ltd.
- BMW Motorrad
- Piaggio & C. SpA
- Ola Electric Mobility Limited
- Vmoto Limited
- Silence Urban Ecomobility
Additional Benefits:
- The market estimate (ME) sheet in Excel format
- 3 months of analyst support
TABLE OF CONTENTS
1 Introduction
- 1.1 Study Assumptions & Market Definition
- 1.2 Scope of the Study
2 Research Methodology
3 Executive Summary
4 Market Landscape
- 4.1 Market Overview
- 4.2 Market Drivers
- 4.2.1 Growing Urban Congestion and Last-Mile Mobility Demand
- 4.2.2 Government Incentives and Subsidy Programs
- 4.2.3 Rapid Expansion of E-commerce Delivery Fleets
- 4.2.4 Declining Lithium-ion Battery Prices
- 4.2.5 Battery-as-a-Service and Swappable-Pack Ecosystems
- 4.2.6 IoT-enabled Predictive Maintenance Boosting Fleet Uptime
- 4.3 Market Restraints
- 4.3.1 Limited Public Charging / Swapping Infrastructure
- 4.3.2 High Upfront Acquisition Cost vs. ICE Alternatives
- 4.3.3 Safety Recalls and Fire Incidents Triggering Stricter Certifications
- 4.3.4 Critical-Mineral Supply Constraints for Next-Gen Chemistries
- 4.4 Value / Supply-Chain Analysis
- 4.5 Regulatory Landscape
- 4.6 Technological Outlook
- 4.7 Porter's Five Forces
- 4.7.1 Threat of New Entrants
- 4.7.2 Bargaining Power of Suppliers
- 4.7.3 Bargaining Power of Buyers
- 4.7.4 Threat of Substitutes
- 4.7.5 Competitive Rivalry
5 Market Size & Growth Forecasts (Value (USD) and Volume (Units))
- 5.1 By Battery Type
- 5.1.1 Lead-acid
- 5.1.2 Lithium-ion
- 5.1.3 Lithium-ion Polymer
- 5.1.4 Sodium-ion and Emerging Chemistries
- 5.2 By Power Output
- 5.2.1 Less than 3.6 kW
- 5.2.2 3.6-7.2 kW
- 5.2.3 7.2-10 kW
- 5.2.4 More than 10 kW
- 5.3 By Motor / Drive Type
- 5.3.1 Hub Motor
- 5.3.2 Belt Drive
- 5.3.3 Chain Drive
- 5.3.4 Mid-drive Motor
- 5.4 By End-Use
- 5.4.1 Personal / Individual
- 5.4.2 Commercial and Corporate Fleets
- 5.4.3 Micromobility Service Providers
- 5.4.4 Delivery and Logistics
- 5.5 By Geography
- 5.5.1 North America
- 5.5.1.1 United States
- 5.5.1.2 Canada
- 5.5.1.3 Rest of North America
- 5.5.2 South America
- 5.5.2.1 Brazil
- 5.5.2.2 Argentina
- 5.5.2.3 Rest of South America
- 5.5.3 Europe
- 5.5.3.1 United Kingdom
- 5.5.3.2 Germany
- 5.5.3.3 Spain
- 5.5.3.4 Italy
- 5.5.3.5 France
- 5.5.3.6 Russia
- 5.5.3.7 Rest of Europe
- 5.5.4 Asia-Pacific
- 5.5.4.1 India
- 5.5.4.2 China
- 5.5.4.3 Japan
- 5.5.4.4 South Korea
- 5.5.4.5 Rest of Asia-Pacific
- 5.5.5 Middle East and Africa
- 5.5.5.1 United Arab Emirates
- 5.5.5.2 Saudi Arabia
- 5.5.5.3 Turkey
- 5.5.5.4 Egypt
- 5.5.5.5 South Africa
- 5.5.5.6 Rest of Middle-East and Africa
- 5.5.1 North America
6 Competitive Landscape
- 6.1 Market Concentration
- 6.2 Strategic Moves
- 6.3 Market Share Analysis
- 6.4 Company Profiles (Includes Global Level Overview, Market Level Overview, Core Segments, Financials as Available, Strategic Information, Market Rank/Share for Key Companies, Products and Services, SWOT Analysis, and Recent Developments)
- 6.4.1 Yadea Technology Group
- 6.4.2 NIU Technologies
- 6.4.3 Hero Electric Vehicles Private Limited
- 6.4.4 Gogoro Inc.
- 6.4.5 Ather Energy Limited
- 6.4.6 Okinawa Autotec Private Limited
- 6.4.7 TVS Motor Company
- 6.4.8 Bajaj Auto Limited
- 6.4.9 Yamaha Motor Co. Ltd.
- 6.4.10 BMW Motorrad
- 6.4.11 Piaggio & C. SpA
- 6.4.12 Ola Electric Mobility Limited
- 6.4.13 Vmoto Limited
- 6.4.14 Silence Urban Ecomobility
7 Market Opportunities & Future Outlook
- 7.1 White-space & Unmet-Need Assessment

 全球電動滑板車市場規模、佔有率、趨勢和成長分析報告(2026-2034)
 電動滑板車融資市場規模、佔有率和成長分析:按融資類型、借款人類型、提供者類型、貸款期限、車輛類型和地區分類 - 產業預測,2026-2033 年
 電動滑板車和電動機車市場:2026-2032年全球市場預測(按車輛類型、電池類型、馬達類型、功率輸出、單次充電續航里程、最終用戶和分銷管道分類)電動滑板車市場:2026-2032年全球市場預測(依產品類型、電池類型、電池容量、馬達輸出功率、煞車系統、銷售管道和應用分類)
 電動滑板車市場:商業機會、成長要素、產業趨勢分析及2026-2035年預測
 小型電動滑板車市場分析與至2035年的預測:類型、產品、服務、技術、組件、應用、部署模式、最終用戶、功能、安裝類型電動滑板車市場分析及預測(至2035年):依類型、產品、服務、技術、組件、應用、部署、最終用戶及模式分類
 2026-2030年全球高性能電動機車市場全球電動滑板車共享市場規模、佔有率、趨勢和成長分析報告(2026-2034)高階電動機車市場機會、成長要素、產業趨勢分析及2026-2035年預測。