


 |
市場調查報告書
商品編碼
2117403
汽車排放標準及影響分析:市佔率分析、產業趨勢及統計、成長預測(2026-2031)Vehicle Emission Standards and Impact Analysis - Market Share Analysis, Industry Trends & Statistics, Growth Forecasts (2026 - 2031) |
||||||

※ 本網頁內容可能與最新版本有所差異。詳細情況請與我們聯繫。
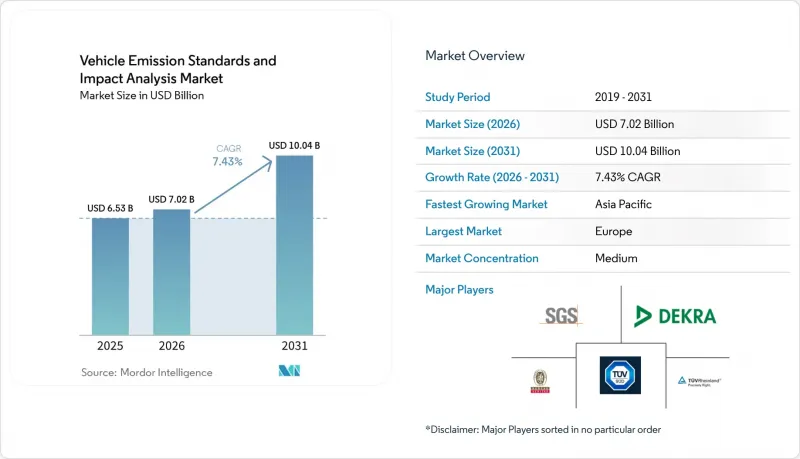
據 Mordor Intelligence 稱,2025 年汽車排放標準和影響分析市值為 65.3 億美元,2026 年估計為 70.2 億美元,預計到 2031 年將達到 100.4 億美元。
預計從 2026 年到 2031 年,其複合年成長率將達到 7.43%。
本報告按車輛類型(二輪車、三輪車、乘用車、商用車)、驅動方式(內燃機等)、廢氣類型(二氧化碳、氮氧化物、顆粒物等)、最終用戶(政府監管機構、整車製造商等)和地區(北美、南美、歐洲等)進行細分。市場預測以美元計價。
全球汽車排放標準及影響分析:市場趨勢與洞察
更嚴格的全球排放氣體標準正在推動市場轉型。
歐盟7排放標準在保留歐盟6排放標準的基礎上,引入了新的措施,例如細懸浮微粒計數、煞車顆粒物排放上限以及輪胎磨損閾值。這些措施將首先應用於新車,然後逐步推廣至所有新註冊車輛。中國的「國七」排放標準草案降低了氮氧化物排放限值,並設定了氨排放上限。最終版本預計很快就會發布,並計分類階段實施。加州的低氮氧化物排放法規將首先收緊大型引擎的排放標準,之後也將推出更嚴格的標準。預計這項措施將顯著降低加州的氮氧化物排放量。製造商面臨檢驗工作重疊的挑戰,因為他們必須符合WLTP、FTP-75和CLTC等不同的測試循環。這不僅會增加測試成本,還會擴大汽車排放標準和影響分析市場。
電動車和混合動力車產量的激增正在重新思考檢測規程。
由於電池式電動車(BEV) 車型的總重量更重,其輪胎顆粒物排放量高於內燃機汽車,因此需要引入新的非廢氣排放系統測量指標。為了符合歐盟7排放標準(該標準要求即使是再生煞車系統也必須進行煞車顆粒物測試),測試實驗室目前正在引入符合聯合國GTR 22標準的PN10計數器和煞車測功機。混合動力汽車則帶來了更多複雜性。動力分配運作、冷啟動時的排放高峰以及電池電量波動等因素,都需要進行雙循環評估,這通常會使測試時間翻倍。鑑於業界正向純電動車 (BEV) 和混合動力車 (HEV) 協議轉型,AVL已將其部分利潤用於擴大其電氣化測試平台。
由於需要大量資本投入,市場准入受到限制。
即使是一套用於顆粒物計數測量的攜帶式排放監測系統(PEMS)套件也價格不菲,而用於四輪驅動車的氣候可調底盤測功機的成本則更高。如此龐大的支出會延長投資回收期,尤其是產量較低的地區。此外,這些先進測試系統還需要定期維護和校準,進一步加重了營運成本,從而增加了經濟負擔。儘管DEKRA已獲得大量資金用於資本投資,但許多缺乏類似資金支持的區域實驗室卻因區域處理能力的限制而舉步維艱,難以滿足日益成長的排放氣體測試服務需求。
細分市場分析
預計到2025年,乘用車將佔汽車排放標準和影響分析市場的57.42%,但隨著印度和東南亞電動三輪車車隊的電氣化進程不斷推進,三輪車預計將以7.97%的複合年成長率(CAGR)實現最高成長。印度電動三輪車的註冊數量已突破一個重要里程碑,促使相關部門加強監管,並引入新的電池安全和再生煞車測試。同時,歐7輪胎法規對SUV構成挑戰,推高了此關鍵車型類別的非廢氣排放合規成本。涵蓋乘用車、商用車和兩輪/三輪車領域的測試實驗室正在策略性地多元化經營,以充分應對工作量的波動。
監理趨勢正在塑造成長軌跡。隨著泰國和印尼逐步接近歐盟4排放標準,這些國家正引導三輪車製造商前往ARAI和ICAT等認證檢測機構進行檢測。商用卡車也正在為更嚴格的排放氣體標準做準備,凸顯了對大型攜帶式排放管理系統(PEMS)的強勁需求。同時,儘管電動踏板車繞過了廢氣排放檢測,導致二輪車數量下降,但傳統汽油車仍需定期接受檢測才能進入都市區。因此,在車輛日益多樣化的動態環境中,汽車排放標準和影響分析市場正在努力平衡成熟乘用車市場的收入與快速成長的細分市場之間的差距。
純電動車(BEV)平台正以8.48%的複合年成長率成長,在所有動力系統中增速最高,儘管內燃機汽車到2025年仍將維持73.47%的銷售佔有率。歐盟7排放標準對煞車粉塵設定了嚴格的限制。因此,電動再生煞車系統現在採用客製化演算法來模擬不常用煞車皮的磨損。此外,隨著電動車總重量的增加,輪胎顆粒物排放量也增加。為了應對這一問題,檢測實驗室正在投資研發能夠檢測超細顆粒的重量分析儀。
混合動力汽車的測試成本最高。由於缺乏標準化的測試流程,汽車製造商必須同時評估混合動力汽車的內燃機模式和純電動模式。這種雙重測試不僅使測試台的運轉率加倍,也擴大了動力系統測試的市場規模,尤其是在汽車排放標準和影響分析領域。雖然內燃機的檢驗技術已經成熟,但它仍然是一個盈利豐厚的領域。這主要是由於歐盟和中國的法規強調顆粒物計數和氨洩漏測試。實驗室正在透過高價值的純電動車/混合動力汽車測試套件來取代傳統的測試台,從而最佳化資產利用率。
區域分析
歐洲34.28%的市佔率主要歸功於歐7排放標準以及超過320個低排放區的存在。光是倫敦的公車網路就覆蓋1500平方公里,老舊車隊需要定期重新認證。德國、英國、法國、義大利、西班牙和荷蘭的投資叢集正在擴大PN10計數器和電池室的規模,而東歐則從國外引進公車服務,導致等待時間延長,儘管西歐樞紐的運轉率正在提高。
亞太地區正以9.28%的複合年成長率推動成長,這主要得益於中國的「國七排放標準草案」和印度的「印度第六階段排放標準第二期」。中國的汽車技術研究中心正在升級其設施,以監測氨洩漏和10奈米顆粒計數。在印度,電池安全測試實驗室正在擴建,特別是針對電動三輪車的測試實驗室。同時,日本的JARI在氫燃料電池循環領域發揮主導作用。包括印尼和韓國在內的亞太地區國家在電池能量管理系統(PEMS)的採用方面落後於其他國家。這種差距正在推動跨境外包,雖然這增加了成本,但也加速了區域車輛排放標準和影響分析的普及。
在北美,新一代設備的批准越來越依賴加州空氣資源委員會 (CARB) 的低氮氧化物排放標準和美國環保署 (EPA) 的認證。堀場 (Horiba) 的 IRLAM™ 已獲得認證,並憑藉重型車輛訂單鞏固了其市場地位。 DEKRA 已在密西根州開設了一家測試實驗室,目標客戶是底特律的整車製造商 (OEM)叢集。在南美,正在考慮過渡到類似歐 6 標準的 Proconve L7 標準。同時,在中東,土耳其正被寄予厚望,希望獲得認證,尤其是那些進口符合歐標標準的車輛的海灣國家。在非洲,需求正在萌芽,但在監管協調更加普及之前,成長仍然緩慢。
其他好處:
- Excel格式的市場預測(ME)表
- 3個月的分析師支持
目錄
第1章:引言
- 研究假設和市場定義
- 調查範圍
第2章:調查方法
第3章執行摘要
第4章 市場狀況
- 市場概覽
- 市場促進因素
- 更嚴格的全球排放氣體法規(歐盟7、國7、加州空氣資源委員會低氮氧化物排放法規)
- 電動車和混合動力車產量的激增需要新的測試規程。
- 政府對低排放技術的獎勵措施
- 原始設備製造商 (OEM) 擴大將 TIC 服務外包
- 人工智慧遙感探測及其在現實世界分析中的應用
- 城市層面低排放區(LEZ)的擴大
- 市場限制因素
- 先進測試設備高額的購置成本
- 測量駕駛過程中實際排放量(PEMS)的複雜性
- 資料存取規則的碎片化限制了獨立檢測實驗室的活動。
- 由於國際協調機制不透明,導致重複測試。
- 價值供應鏈分析
- 監理情勢
- 技術展望
- 波特五力模型
第5章 市場規模與成長預測
- 按車輛類型
- 摩托車
- 三輪車
- 搭乘用車
- 掀背車
- 轎車
- SUV/MUV
- 商用車輛
- 輕型商用車
- 中型和大型商用車輛
- 巴士和長途汽車
- 透過驅動系統
- 內燃機車
- 混合動力汽車
- 電池式電動車
- 依廢氣類型
- 二氧化碳(CO2)
- 氮氧化物(NOx)
- PM(顆粒物)
- 氫氧根(HC)
- 其他(例如,一氧化碳)
- 最終用戶
- 政府監管機構
- OEM(汽車製造商)
- 獨立檢測實驗室
- 按地區
- 北美洲
- 美國
- 加拿大
- 其他北美國家
- 南美洲
- 巴西
- 阿根廷
- 其他南美國家
- 歐洲
- 德國
- 英國
- 西班牙
- 義大利
- 法國
- 荷蘭
- 其他歐洲國家
- 亞太地區
- 印度
- 中國
- 日本
- 韓國
- 印尼
- 其他亞太國家
- 中東和非洲
- 阿拉伯聯合大公國
- 沙烏地阿拉伯
- 土耳其
- 埃及
- 南非
- 其他中東和非洲國家
- 北美洲
第6章 競爭情勢
- 市場集中度
- 策略趨勢
- 市佔率分析
- 公司簡介
- SGS SA
- Bureau Veritas
- DEKRA SE
- TUV SUD
- TUV Rheinland
- Applus+
- HORIBA Ltd.
- AVL List GmbH
- Intertek Group plc
- Opus Group AB
- MTS Systems Corp.
- Ricardo plc
- IAV GmbH
- Automotive Research Association of India(ARAI)
第7章 市場機會與未來展望
According to Mordor Intelligence, the vehicle emission standards and impact analysis market size was valued at USD 6.53 billion in 2025, is estimated at USD 7.02 billion in 2026, and is projected to reach USD 10.04 billion by 2031, growing at a CAGR of 7.43% from 2026 to 2031.
This report is Segmented by Vehicle Type (Two-Wheeler, Three-Wheeler, Passenger Cars, and Commercial Vehicles), Propulsion Type (ICE and More), Emission Type (CO2, NOx, PM, and More), End-Users (Government Regulating Agencies, Oems, and More), and Geography (North America, South America, Europe, and More). The Market Forecasts are Provided in Terms of Value (USD).
Global Vehicle Emission Standards and Impact Analysis Market Trends and Insights
Stricter Global Emission Standards Drive Market Transformation
Euro 7 retains the tailpipe limits of Euro 6 but introduces new measures: a particle number measurement for smaller particles, a brake particulate ceiling, and thresholds for tire wear . These measures will take effect first for new vehicle types, followed by all new registrations. China's National VII draft lowers nitrogen oxide limits and sets caps on ammonia emissions. The final version is anticipated soon, with a phased enforcement extending over time. California's Low-NOx regulation initially tightens limits on heavy-duty engines, with even stricter standards planned later. This move is projected to significantly reduce statewide NOx emissions. Manufacturers face challenges as they navigate divergent cycles-WLTP, FTP-75, and CLTC-which lead to duplicate validations. This not only inflates testing expenses but also bolsters the Vehicle Emission Standards and Impact Analysis market.
Surge in EV and HEV Production Reshapes Testing Protocols
Battery-electric models, due to their heavier curb mass, produce higher tire particulate emissions than their internal-combustion counterparts, prompting the introduction of new non-exhaust metrics. In response to Euro 7 regulations, which mandate brake particulate checks even for regenerative systems, laboratories are now incorporating PN10 counters and brake dynamometers in accordance with UN GTR 22 standards. Hybrids introduce complexities: their power-split operation, cold-start spikes, and fluctuations in battery state of charge necessitate a dual-cycle evaluation, often doubling test hours. Highlighting the industry's shift towards BEV and HEV protocols, AVL allocated a portion of its revenue to expand its electrification benches.
High Capital Investment Requirements Limit Market Entry
Though a single particle-number PEMS kit commands a hefty price, the cost of a 4-wheel-drive climate chassis dynamometer is even steeper. Such a considerable outlay extends the payback period, particularly in areas with lower volumes. This financial burden is further exacerbated by the need for regular maintenance and calibration of these advanced testing systems, which increases operational costs. While DEKRA has set aside considerable resources for capital ventures, numerous local labs, without similar financial backing, grapple with limitations in their regional capacity, hindering their ability to meet growing demand for emissions testing services.
Other drivers and restraints analyzed in the detailed report include:
- AI Integration Transforms Emissions Monitoring Capabilities
- Low-Emission Zones Expansion Creates Testing Demand
- Complexity of Capturing Real-World Emissions
For complete list of drivers and restraints, kindly check the Table Of Contents.
Segment Analysis
Three-wheelers will command the fastest 7.97% CAGR as India and Southeast Asia electrify auto-rickshaw fleets, even though passenger cars retained 57.42% of the Vehicle Emission Standards and Impact Analysis market in 2025. Electric three-wheeler registrations in India have surpassed a significant threshold, prompting heightened scrutiny and new battery safety and regenerative braking tests. At the same time, Euro 7's tire restrictions imposed challenges on SUVs, escalating non-exhaust compliance costs for this leading car category. Laboratories spanning the car, commercial, and two- to three-wheeler sectors have strategically diversified to better navigate volume fluctuations.
Regulatory rhythms dictate growth trajectories. As Thailand and Indonesia move closer to Euro 4-equivalent standards, they're steering three-wheeler OEMs towards accredited hubs like ARAI and ICAT. Commercial trucks are preparing for stricter emission standards, underscoring a robust demand for heavy-duty PEMS. While two-wheeler volumes wane as battery scooters sidestep tailpipe tests, traditional petrol fleets still require regular checks for urban entry. This dynamic landscape, with its vehicle-type diversification, sees the Vehicle Emission Standards and Impact Analysis market balancing established passenger car revenues with burgeoning niches.
Battery-electric platforms post an 8.48% CAGR, the fastest among propulsion lines, yet internal combustion engines maintain a 73.47% revenue share in 2025. Euro 7 sets a stringent brake dust limit. As a result, electric regenerative systems now rely on tailored algorithms to mimic the wear of low-use pads. Furthermore, the increased curb weight of electric vehicles has led to higher tire particulate levels. In response, laboratories are channeling investments into gravimetric analyzers, capable of detecting ultra-fine particles.
Evaluating hybrid stands is the priciest endeavor. Without a unified testing cycle, OEMs are compelled to assess hybrids in both combustion and electric modes. This dual testing not only doubles bench occupancy but also amplifies the market size for propulsion testing, particularly in the realm of Vehicle Emission Standards and Impact Analysis. While internal combustion validation has matured, it remains lucrative. This is largely due to EU and Chinese regulations, which emphasize particle counting and ammonia slip checks. Laboratories that cross-subsidize legacy benches with premium BEV/HEV packages optimize asset utilization.
Complete Report Scope:
- By Vehicle Type
- Two-Wheeler
- Three-Wheeler
- Passenger Cars
- Hatchbacks
- Sedans
- SUV & MUVs
- Commercial Vehicles
- Light Commercial Vehicles
- Medium & Heavy Commercial Vehicles
- Buses & Coaches
- By Propulsion Type
- Internal-Combustion Engine Vehicles
- Hybrid Electric Vehicles
- Battery Electric Vehicles
- By Emission Type
- CO2 (Carbon Dioxide)
- NOx (Nitrogen Oxides)
- PM (Particulate Matter)
- HC (Hydrocarbons)
- Others (CO, etc.)
- By End-Users
- Government Regulating Agencies
- OEMs
- Independent Testing Labs
- By Geography
- North America
- United States
- Canada
- Rest of North America
- South America
- Brazil
- Argentina
- Rest of South America
- Europe
- Germany
- United Kingdom
- Spain
- Italy
- France
- Netherlands
- Rest of Europe
- Asia-Pacific
- India
- China
- Japan
- South Korea
- Indonesia
- Rest of Asia-Pacific
- Middle East and Africa
- United Arab Emirates
- Saudi Arabia
- Turkey
- Egypt
- South Africa
- Rest of Middle East & Africa
- North America
Geography Analysis
Europe's 34.28% slice stems from Euro 7 and more than 320 low-emission zones. London's network alone covers 1,500 km2 and requires periodic recertification of aging fleets. Investment clusters in Germany, the U.K., France, Italy, Spain, and the Netherlands are scaling PN10 counters and battery chambers, while Eastern Europe imports services, extending queue times but raising utilization at Western hubs.
Asia-Pacific leads growth at 9.28% CAGR thanks to China's National VII draft and India's Bharat Stage VI Phase 2 rules. China's Automotive Technology and Research Center is upgrading its facilities to monitor ammonia slip and 10 nm particle counts. In India, battery-safety laboratories are being expanded specifically for electric three-wheelers. Meanwhile, Japan's JARI is leading the way with hydrogen fuel cell cycles. Countries like Indonesia, Korea, and others in the Asia-Pacific region are falling behind in PEMS density. This gap has led to cross-border outsourcing, which, while inflating costs, is hastening the penetration of regional Vehicle Emission Standards and Impact Analysis.
In North America, there's a heavy reliance on CARB Low-NOx and the U.S. EPA for the green light on next-generation equipment. HORIBA's IRLAM(TM) has clinched certification, solidifying its position with heavy-duty bookings. DEKRA has set its sights on Detroit's OEM clusters with a lab in Michigan. South America is eyeing a move to a Euro 6-like Proconve L7 standard. Meanwhile, the Middle East is turning to Turkey for validation, especially as Gulf states import vehicles that meet Euro specifications. In Africa, demand is budding but remains sluggish until broader regulatory alignment occurs.
- SGS SA
- Bureau Veritas
- DEKRA SE
- TUV SUD
- TUV Rheinland
- Applus+
- HORIBA Ltd.
- AVL List GmbH
- Intertek Group plc
- Opus Group AB
- MTS Systems Corp.
- Ricardo plc
- IAV GmbH
- Automotive Research Association of India (ARAI)
Additional Benefits:
- The market estimate (ME) sheet in Excel format
- 3 months of analyst support
TABLE OF CONTENTS
1 Introduction
- 1.1 Study Assumptions and Market Definition
- 1.2 Scope of the Study
2 Research Methodology
3 Executive Summary
4 Market Landscape
- 4.1 Market Overview
- 4.2 Market Drivers
- 4.2.1 Stricter global emission standards (Euro 7, China 7, CARB Low-NOx)
- 4.2.2 Surge in EV and HEV production demanding new testing protocols
- 4.2.3 Government incentives for low-emission technologies
- 4.2.4 Rising outsourcing of TIC services by OEMs
- 4.2.5 AI-driven remote sensing & real-world analytics adoption
- 4.2.6 Expansion of city-level Low-Emission Zones (LEZs)
- 4.3 Market Restraints
- 4.3.1 High capital cost of advanced testing equipment
- 4.3.2 Complexity of capturing real-world emissions (PEMS)
- 4.3.3 Fragmented data-access rules limiting independent labs
- 4.3.4 Uncertain global harmonization causing duplicate tests
- 4.4 Value / Supply-Chain Analysis
- 4.5 Regulatory Landscape
- 4.6 Technological Outlook
- 4.7 Porter's Five Forces
- 4.7.1 Threat of New Entrants
- 4.7.2 Bargaining Power of Suppliers
- 4.7.3 Bargaining Power of Buyers
- 4.7.4 Threat of Substitutes
- 4.7.5 Intensity of Competitive Rivalry
5 Market Size and Growth Forecasts (Value in USD)
- 5.1 By Vehicle Type
- 5.1.1 Two-Wheeler
- 5.1.2 Three-Wheeler
- 5.1.3 Passenger Cars
- 5.1.3.1 Hatchbacks
- 5.1.3.2 Sedans
- 5.1.3.3 SUV & MUVs
- 5.1.4 Commercial Vehicles
- 5.1.4.1 Light Commercial Vehicles
- 5.1.4.2 Medium & Heavy Commercial Vehicles
- 5.1.4.3 Buses & Coaches
- 5.2 By Propulsion Type
- 5.2.1 Internal-Combustion Engine Vehicles
- 5.2.2 Hybrid Electric Vehicles
- 5.2.3 Battery Electric Vehicles
- 5.3 By Emission Type
- 5.3.1 CO2 (Carbon Dioxide)
- 5.3.2 NOx (Nitrogen Oxides)
- 5.3.3 PM (Particulate Matter)
- 5.3.4 HC (Hydrocarbons)
- 5.3.5 Others (CO, etc.)
- 5.4 By End-Users
- 5.4.1 Government Regulating Agencies
- 5.4.2 OEMs
- 5.4.3 Independent Testing Labs
- 5.5 By Geography
- 5.5.1 North America
- 5.5.1.1 United States
- 5.5.1.2 Canada
- 5.5.1.3 Rest of North America
- 5.5.2 South America
- 5.5.2.1 Brazil
- 5.5.2.2 Argentina
- 5.5.2.3 Rest of South America
- 5.5.3 Europe
- 5.5.3.1 Germany
- 5.5.3.2 United Kingdom
- 5.5.3.3 Spain
- 5.5.3.4 Italy
- 5.5.3.5 France
- 5.5.3.6 Netherlands
- 5.5.3.7 Rest of Europe
- 5.5.4 Asia-Pacific
- 5.5.4.1 India
- 5.5.4.2 China
- 5.5.4.3 Japan
- 5.5.4.4 South Korea
- 5.5.4.5 Indonesia
- 5.5.4.6 Rest of Asia-Pacific
- 5.5.5 Middle East and Africa
- 5.5.5.1 United Arab Emirates
- 5.5.5.2 Saudi Arabia
- 5.5.5.3 Turkey
- 5.5.5.4 Egypt
- 5.5.5.5 South Africa
- 5.5.5.6 Rest of Middle East & Africa
- 5.5.1 North America
6 Competitive Landscape
- 6.1 Market Concentration
- 6.2 Strategic Moves
- 6.3 Market Share Analysis
- 6.4 Company Profiles (Includes Global level Overview, Market level overview, Core Segments, Financials as available, Strategic Information, Market Rank/Share for key companies, Products & Services, and Recent Developments)
- 6.4.1 SGS SA
- 6.4.2 Bureau Veritas
- 6.4.3 DEKRA SE
- 6.4.4 TUV SUD
- 6.4.5 TUV Rheinland
- 6.4.6 Applus+
- 6.4.7 HORIBA Ltd.
- 6.4.8 AVL List GmbH
- 6.4.9 Intertek Group plc
- 6.4.10 Opus Group AB
- 6.4.11 MTS Systems Corp.
- 6.4.12 Ricardo plc
- 6.4.13 IAV GmbH
- 6.4.14 Automotive Research Association of India (ARAI)


