


 |
市場調查報告書
商品編碼
2117396
美國電動車充電即服務 (CaaS):市場佔有率分析、產業趨勢與統計、成長預測 (2026-2031)United States EV Charging As A Service - Market Share Analysis, Industry Trends & Statistics, Growth Forecasts (2026 - 2031) |
||||||

※ 本網頁內容可能與最新版本有所差異。詳細情況請與我們聯繫。
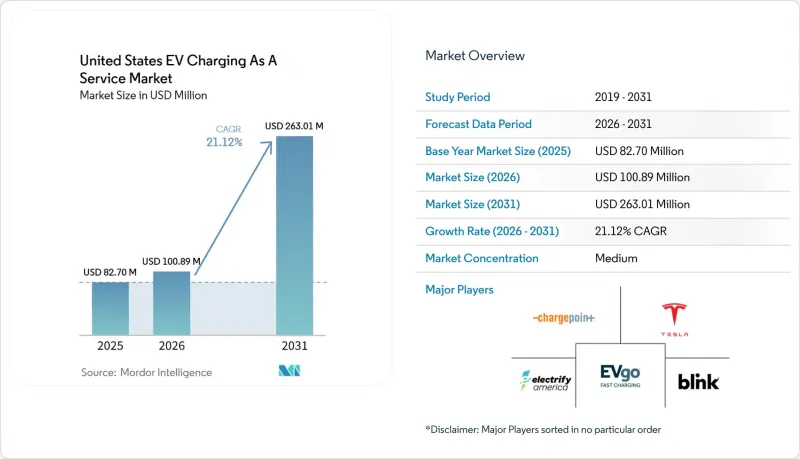
據 Mordor Intelligence 稱,2025 年美國電動車充電即服務 (CaaS) 市場價值為 8,270 萬美元,預計到 2031 年將達到 2.6301 億美元,而 2026 年為 1.0089 億美元,在預測期(2026-2031 年年成長率為 21.126-2031 年)。
本報告按充電器類型(交流充電器、直流快充)、輸出功率(1級/交流(小於22千瓦)、2級(22-50千瓦)等)、車隊服務類型(公司用車/車輛共享、配送/物流等)、最終用途、客戶經營模式和地區進行細分。市場預測以美元計價。
美國電動車充電即服務 (CaaS) 市場的趨勢與洞見。
NEVI的聯邦和州政府資助開發
NEVI計劃已撥款50億美元,要求每個津貼的站點安裝四個150千瓦的端口,全天候24小時可用,並保持97%的運轉率。這加快了專案進度,並將遠端監控能力不足的供應商排除在外。到2026年初,德克薩斯州將為眾多走廊站點撥付大量資金,其中一些站點已投入運作中,更多站點正在建設中。同樣,俄亥俄州、紐約州和密西根州也設定了類似的目標,津貼分配通常與公平性指標掛鉤,以確保資金流向資金不足的地區。
企業基於ESG的車輛電氣化義務
亞馬遜、UPS 和德迅 (DB Schenker) 已承諾在 2030 年前實現其「最後一公里」配送車輛的電氣化。此舉刺激了對充電站解決方案的需求,尤其是那些提供涵蓋硬體、軟體和維護等配套服務。在加州,WattEV 的卡車充電站已成功在短時間內為 8 級牽引車充電,證明了高功率車型在當地交通運輸中的實用性。
直流快速充電站電網維修成本高昂
在加州,併網申請可能需要數年才能完成核准,而變壓器升級則面臨巨大的資金和後勤挑戰。這些因素往往導致預算增加,並促使企業將重點放在投資更大容量的設施上。然而,FreeWire 與 BP Pulse 合作開發的整合式電池充電器,透過提供一種能夠有效管理尖峰需求並減少對大規模基礎設施升級依賴的解決方案,有效應對了部分挑戰。
細分市場分析
在美國電動車充電即服務 (CaaS) 市場,2025 年交流 2 級充電樁將佔總收入的 72.31%。這些充電樁主要安裝在職場和多用戶住宅的停車場,6 小時的停車時間符合使用者的使用習慣。同時,由於物流車輛和長途旅行者對 30 分鐘內快速充電的需求不斷成長,直流快速充電系統預計將以 25.36% 的複合年成長率成長。隨著特斯拉決定在 2025 年開放其 NACS 和超級充電網路,差異化競爭的重點已轉向最佳化能源負載的軟體層服務。
在半公共停車場,交流充電仍然佔據主導地位,因為從硬體經濟角度來看,其成本效益優於直流快充。然而,FreeWire 和 Voltera 等公司推出的電池整合式直流解決方案正在減輕電網負載。這項創新使得在無需額外變壓器成本的情況下獲得新的安裝地點成為可能。因此,像 ChargePoint 這樣的老牌公司正在調整其在美國電動車充電即服務 (CaaS) 市場的策略。 ChargePoint 正瞄準車隊客戶,並開始接受其先進的「Omni Port」設備的訂單。
2025年,額定輸出功率為22-50千瓦的二級充電樁將佔據美國電動車充電即服務(CaaS)市場規模的67.04%,這主要得益於其低資本支出(CAPEX)和對電網負載極小的優勢。預計功率超過150千瓦的充電樁將以29.45%的複合年成長率成長,因為電池驅動的卡車需要保持與柴油車相同的煞車距離。 WattEV的350千瓦卡車充電站已可在90分鐘內將電池電量恢復至80%。
對於充電時間在15-45分鐘可接受範圍內的輕型商用車車隊而言,50-150千瓦的中功率系統極具吸引力。 Rivian的多站點網路在2025年實現了高可靠性,凸顯了可靠性和品牌實力同樣重要。隨著電池化學技術的進步,美國電動車充電即服務(CaaS)市場可望透過整合高功率設備和智慧負載平衡技術,最佳化站點處理能力。
其他好處:
- Excel格式的市場預測(ME)表
- 3個月的分析師支持
目錄
第1章:引言
- 市場分析與定義的前提條件
- 分析範圍
第2章 分析方法
第3章執行摘要
第4章 市場狀況
- 市場概覽
- 市場促進因素
- NEVI的聯邦和州政府資助的部署和部署
- 基於ESG因素的企業強制車輛電氣化
- 電池組成本的降低使得整體擁有成本與電池組成本持平。
- 訂閱式費率方案可減少資本投入。
- 人工智慧驅動的預測性維護可提高運轉率。
- 新的偶像酬勞收入分成模式
- 市場限制因素
- 直流快速充電站電網維修成本高昂
- 互通性和支付標準的碎片化
- 主要電力供應區域需求激增
- NEVI合約中的可靠性違約金條款
- 價值鍊和供應鏈分析
- 監管情勢(聯邦和主要州)
- 技術趨勢(V2G、NACS、即插即用)
- 波特五力分析
第5章:預測市場規模與成長率
- 充電器類型
- 交流充電器(二級服務)
- 直流快速充電器
- 依輸出類型
- 1級/交流電(小於22千瓦)
- 2級(22-50度)
- 高速(50-150千瓦)
- 高功率(>150千瓦)
- 車隊服務類型
- 公司用車/車輛共享
- 配送/物流
- 客運車輛
- 按最終用途
- 半公共充電設施
- 公共充電設備
- 依客戶經營模式
- 訂閱式(CaaS)
- 付費使用制
- 混合模式
- 按地區
- 東北
- 中西部
- 南部
- 西
第6章 競爭情勢
- 市場集中度
- 策略趨勢
- 市佔率分析
- 公司簡介
- ChargePoint, Inc.
- Tesla, Inc.
- Electrify America
- EVgo Inc.
- Blink Charging Co.
- Shell Recharge
- BP Pulse
- FLO Services USA Inc.
- EV Connect
- Rivian Adventure Network
- IONNA
- Francis Energy
- Voltera
- Tritium Charging
- Enel Group
第7章 市場機會與未來展望
According to Mordor Intelligence, the United States EV charging as a service market size was valued at USD 82.70 million in 2025 and estimated to grow from USD 100.89 million in 2026 to reach USD 263.01 million by 2031, at a CAGR of 21.12% during the forecast period (2026-2031).
This report is Segmented by Charger Type (AC Chargers, DC Fast Chargers), Power Output (Level 1/AC (Less Than 22 KW), Level 2 (22-50 KW), and More), Fleet Service Type (Company Vehicles and Motor Pools, Delivery and Logistics, and More), End-Use, Customer Business Model, and Region. Market Forecasts are Provided in Terms of Value (USD).
United States EV Charging As A Service Market Trends and Insights
NEVI Federal-State Funding Roll-Out
The NEVI program allocates USD 5 billion and requires each funded site to offer four 150 kW ports, 24/7 access, and 97% uptime, accelerating project schedules and excluding vendors without remote-monitoring depth. By early 2026, Texas allocated significant funding across numerous corridor locations, with several active sites and many more under development. Similarly, Ohio, New York, and Michigan established comparable targets, frequently linking awards to equity metrics to direct funds into underserved neighborhoods.
Corporate ESG Fleet-Electrification Mandates
Amazon, UPS, and DB Schenker have committed to electrifying their last-mile fleets by 2030. This move is spurring a demand for depot-charging solutions, particularly those that offer bundled services encompassing hardware, software, and maintenance. In California, WattEV's truck hubs are successfully recharging Class 8 tractors within a short time frame, underscoring the viability of high-power models for regional hauling.
High Grid-Upgrade Costs for DC Fast Sites
In California, interconnection queues can take several years to process, and upgrading transformers involves significant financial and logistical challenges. These factors often lead to increased budgets and a focus on investments in areas with higher capacity. However, FreeWire's battery-integrated chargers, developed as part of a collaboration with BP Pulse, address some of these challenges by providing an efficient solution to manage peak demand and reduce dependency on extensive infrastructure upgrades.
Other drivers and restraints analyzed in the detailed report include:
- Declining Battery-Pack Costs Reach TCO Parity
- Utility Subscription-Ready Tariffs Cut Capex
- Interoperability and Payment-Standard Fragmentation
For complete list of drivers and restraints, kindly check the Table Of Contents.
Segment Analysis
AC Level 2 units supplied 72.31% of 2025 revenue in the United States EV Charging As A Service market, anchored in workplaces and multi-family garages where 6-hour dwell times align with usage patterns. DC fast systems, however, are projected for a 25.36% CAGR as logistics fleets and corridor travelers demand sub-30-minute stops. Tesla's 2025 decision to open NACS and its Supercharger network diverted differentiation toward software-layer services that optimize energy loads .
In semi-public lots, hardware economics continue to favor AC charging, which remains more cost-effective compared to DC fast charging. However, battery-integrated DC solutions from companies like FreeWire and Voltera are reducing grid footprints. This innovation allows for new deployment sites without the added expense of transformers. Consequently, the United States EV Charging As A Service market is seeing established players, such as ChargePoint, pivoting their strategies. ChargePoint has placed orders for advanced Omni Port units, targeting fleet customers.
Level 2 chargers rated 22-50 kW held 67.04% share of the United States EV Charging As A Service market size in 2025, driven by lower capex and grid friendliness. Chargers above 150 kW will post a 29.45% CAGR because battery-electric trucks must match diesel dwell times; WattEV's 350 kW truck stops already replenish 80% SOC in 90 minutes.
Mid-range 50-150 kW systems appeal to light-commercial fleets where 15-45-minute sessions are acceptable. Rivian's network, spanning multiple sites, recorded high reliability in 2025, underscoring the importance of reliability alongside brand strength. With the evolution of battery chemistries, the United States EV Charging As A Service market is poised to harmonize ultra-high power installations with intelligent load sharing, optimizing site throughput.
Complete Report Scope:
- By Charger Type
- AC Chargers (Level 2 Service)
- DC Fast Chargers
- By Power Output
- Level 1/AC (Less than 22 kW)
- Level 2 (22 to 50 kW)
- Fast (50 to 150 kW)
- High-Power (More than 150 kW)
- By Fleet Service Type
- Company Vehicles and Motor Pools
- Delivery and Logistics
- Passenger Transportation Fleets
- By End-Use
- Semi-Public Charging Setup
- Public Charging Setup
- By Customer Business Model
- Subscription-based (CaaS)
- Pay-per-Use
- Hybrid Models
- By Region
- Northeast
- Midwest
- South
- West
List of Companies Covered in this Report:
- ChargePoint, Inc.
- Tesla, Inc.
- Electrify America
- EVgo Inc.
- Blink Charging Co.
- Shell Recharge
- BP Pulse
- FLO Services USA Inc.
- EV Connect
- Rivian Adventure Network
- IONNA
- Francis Energy
- Voltera
- Tritium Charging
- Enel Group
Additional Benefits:
- The market estimate (ME) sheet in Excel format
- 3 months of analyst support
TABLE OF CONTENTS
1 Introduction
- 1.1 Study Assumptions and Market Definition
- 1.2 Scope of the Study
2 Research Methodology
3 Executive Summary
4 Market Landscape
- 4.1 Market Overview
- 4.2 Market Drivers
- 4.2.1 NEVI Federal-State Funding Roll-Out
- 4.2.2 Corporate ESG Fleet-Electrification Mandates
- 4.2.3 Declining Battery-Pack Costs Reach TCO Parity
- 4.2.4 Utility Subscription-Ready Tariffs Cut Capex
- 4.2.5 AI-Driven Predictive Maintenance Boosts Uptime
- 4.2.6 Emerging Idle-Fee Revenue-Sharing Models
- 4.3 Market Restraints
- 4.3.1 High Grid-Upgrade Costs for DC Fast Sites
- 4.3.2 Interoperability and Payment-Standard Fragmentation
- 4.3.3 Soaring Demand Charges in Key Utility Territories
- 4.3.4 Reliability-Penalty Clauses in NEVI Contracts
- 4.4 Value/Supply-Chain Analysis
- 4.5 Regulatory Landscape (Federal and Leading States)
- 4.6 Technological Outlook (V2G, NACS, Plug-and-Charge)
- 4.7 Porter's Five Forces
- 4.7.1 Threat of New Entrants
- 4.7.2 Bargaining Power of Suppliers
- 4.7.3 Bargaining Power of Buyers
- 4.7.4 Threat of Substitutes
- 4.7.5 Competitive Rivalry
5 Market Size and Growth Forecasts (Value, USD)
- 5.1 By Charger Type
- 5.1.1 AC Chargers (Level 2 Service)
- 5.1.2 DC Fast Chargers
- 5.2 By Power Output
- 5.2.1 Level 1/AC (Less than 22 kW)
- 5.2.2 Level 2 (22 to 50 kW)
- 5.2.3 Fast (50 to 150 kW)
- 5.2.4 High-Power (More than 150 kW)
- 5.3 By Fleet Service Type
- 5.3.1 Company Vehicles and Motor Pools
- 5.3.2 Delivery and Logistics
- 5.3.3 Passenger Transportation Fleets
- 5.4 By End-Use
- 5.4.1 Semi-Public Charging Setup
- 5.4.2 Public Charging Setup
- 5.5 By Customer Business Model
- 5.5.1 Subscription-based (CaaS)
- 5.5.2 Pay-per-Use
- 5.5.3 Hybrid Models
- 5.6 By Region
- 5.6.1 Northeast
- 5.6.2 Midwest
- 5.6.3 South
- 5.6.4 West
6 Competitive Landscape
- 6.1 Market Concentration
- 6.2 Strategic Moves
- 6.3 Market Share Analysis
- 6.4 Company Profiles (Includes Global Level Overview, Market Level Overview, Core Segments, Financials as Available, Strategic Information, Market Rank/Share for Key Companies, Products and Services, SWOT Analysis, and Recent Developments)
- 6.4.1 ChargePoint, Inc.
- 6.4.2 Tesla, Inc.
- 6.4.3 Electrify America
- 6.4.4 EVgo Inc.
- 6.4.5 Blink Charging Co.
- 6.4.6 Shell Recharge
- 6.4.7 BP Pulse
- 6.4.8 FLO Services USA Inc.
- 6.4.9 EV Connect
- 6.4.10 Rivian Adventure Network
- 6.4.11 IONNA
- 6.4.12 Francis Energy
- 6.4.13 Voltera
- 6.4.14 Tritium Charging
- 6.4.15 Enel Group
7 Market Opportunities and Future Outlook
- 7.1 White-space and Unmet-Need Assessment

 歐洲電動車充電即服務 (CaaS):市場佔有率分析、產業趨勢與統計、成長預測 (2026-2031)
 電動車充電服務市場:商業機會、成長要素、產業趨勢分析及2026-2035年預測
 充電服務市場規模、佔有率和成長分析:按服務模式、應用、安裝地點和地區分類-2026-2033年產業預測
 充電即服務 (CaaS) 市場:按服務、充電站、應用、區域分類
 「收費即服務」市場規模、佔有率、成長及全球產業分析:按類型、應用和地區分類的洞察,2026-2034 年預測全球充電服務市場規模、佔有率、趨勢和成長分析報告(2026-2034)
 個人化計費服務計畫市場:服務模式、訂閱類型、最終用戶和性別,全球預測(2026-2032 年)
 充電即服務 (CaaS) 市場規模、佔有率和趨勢分析報告:按服務、充電站、應用、地區和細分市場預測 (2026-2033)
 充電即服務-全球市場佔有率和排名、總收入和需求預測(2025-2031年)
 充電即服務市場(按充電器類型、最終用途、車隊服務類型和地區分類)- 預測至 2035 年