


 |
市場調查報告書
商品編碼
2117391
雷射誘導擊穿光譜(LIBS):市場佔有率分析、產業趨勢與統計、成長預測(2026-2031)Laser-Induced Breakdown Spectroscopy - Market Share Analysis, Industry Trends & Statistics, Growth Forecasts (2026 - 2031) |
||||||

※ 本網頁內容可能與最新版本有所差異。詳細情況請與我們聯繫。
據 Mordor Intelligence 稱,雷射誘導擊穿光譜 (LIBS) 市場預計將從 2025 年的 2.1833 億美元成長到 2026 年的 2.2908 億美元,到 2031 年達到 3.0754 億美元,2026 年至 2031 年的複合年成長率為 20317%。
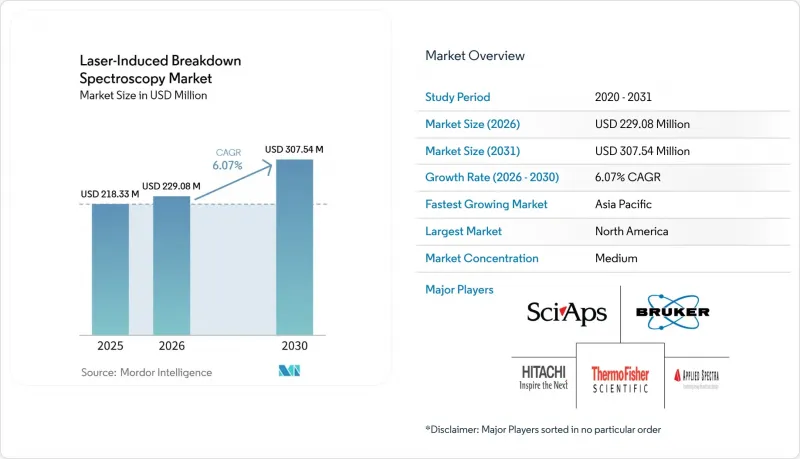
本報告按產品類型(桌上型系統、手持/可攜式分析儀、遠距離/遠端雷射誘導擊穿光譜儀、整合式雷射誘導擊穿光譜-拉曼光譜系統等)、終端用戶產業(金屬和採礦、工業製造和廢料回收、環境和農業監測等)以及地區(北美、歐洲、亞太、中東等)進行細分。市場預測以美元計價。
全球雷射誘導擊穿光譜(LIBS)市場趨勢與洞察
整個工業價值鏈對即時、現場元素分析的需求日益成長。
如今,即時獲取成分資訊對於製程最佳化、品質保證和資源估算至關重要。美國太空總署「火星2020」探測車搭載的65克雷射誘導擊穿光譜儀(LIBS)有效載荷,相比傳統設計減輕了87%,即使在惡劣環境下也能進行穩健的分析。鋼鐵製造商正在工廠車間部署類似的攜帶式設備,以減少過去需要重熔的不合格合金批次。礦業公司透過使用地下LIBS探針取代依賴異地運輸岩芯樣本的實驗室分析流程,將週期縮短了數週。廢料場也利用這種便攜性在幾秒鐘內對複雜合金進行分類。隨著金屬價格波動導致原物料分錯成本增加,這種轉變正在提高利潤率。隨著價值鏈的薄型化,糾正措施的寬限期正在縮短,從而在即時分析市場中催生了對LIBS的結構性需求。
加強對環境、食品和消費品中有害物質的法律規範。
2024年,美國環保署(EPA)將全氟辛酸(PFOA)和全氟辛烷磺酸(PFOS)列為有害物質,進一步加強了現場監測義務。歐盟指令要求到2030年從可回收廢棄物流中回收25%的關鍵原料。這些法規增加了樣品量並縮短了報告期限,使得可現場部署的雷射誘導擊穿光譜(LIBS)工具更具優勢,因為它們無需實驗室處理即可篩檢土壤、塑膠或食品粉末。研究人員在幾分鐘內成功量化了可可粉中濃度範圍為70 ppm至5000 ppm的鎘,凸顯了LIBS如何滿足「從農場到餐桌」的可追溯性需求。合規性檢查的加速降低了交貨暫停和召回的風險,進一步加速了LIBS的應用。
XRF和ICP方法在核心檢測實驗室中的既定優勢
X光螢光光譜法(XRF)和電感耦合等離子體質譜法(ICP-MS)已建立起穩固的基礎設施,並經過數十年的方法檢驗,這使得實驗室難以對其工作流程進行根本性的革新。對比研究表明,ICP-MS在微量金屬(如鍶和鉻)的檢測極限方面仍然具有更低的檢測極限。此外,監管審核人員也習慣於既定的檢測流程,造成了合規惰性。相較之下,雷射誘導擊穿光譜法(LIBS)供應商尋求建立共生關係,而非直接替代,並將儀器定位為「用於在ICP分析確認之前對樣品進行初步篩選的一線工具」。隨著實驗室逐漸認知到LIBS能夠縮短處理時間並降低耗材成本,這些工作流程的結合正逐步推動LIBS的更廣泛應用。
細分市場分析
隨著用戶對行動性和即時決策的日益重視,預計到2025年,手持式/可攜式分析儀將佔總銷售額的48.09%。如此龐大的市佔率凸顯了便攜性在現代雷射誘導擊穿光譜(LIBS)市場第一線作業中的重要性。賽默飛世爾科技的「Niton Apollo」是一款領先的產品,它採用2公斤重的IP54防護等級外殼,並支援Wi-Fi連接,可進行碳當量分析。非接觸式和遠端系統預計將以7.55%的複合年成長率(CAGR)實現最高成長,因為從核能退役到深海採礦等各行業都在採用非接觸式檢測技術,以在保障工人安全和分析範圍之間取得平衡。
在需要更高光譜解析度的實驗室中,桌上型儀器仍被廣泛應用;而OEM模組則使機器製造商能夠將雷射誘導擊穿光譜(LIBS)技術整合到機器人和生產單元中。 LIBS產業向LIBS-拉曼整合設備的轉型預示著「後儀器時代」的到來,在這個時代,多模態感測器將被整合到生產線中。一種雙脈衝水下變體已成功在6000公尺深處進行礦物分析,從而避免了岩芯樣本提取帶來的延誤。無論是安裝在火星探勘或回收機器人上,其多功能性都在鞏固LIBS市場的擴張。
區域分析
北美地區擁有聯邦政府的資金支持、蓬勃發展的航太和國防生態系統以及強大的採礦業,預計到2025年將佔全球銷售額的40.37%。美國能源部的貸款擔保計畫正將資金用於關鍵礦物的加工,並激勵國內獎勵採用雷射誘導擊穿光譜(LIBS)技術進行雜質的即時檢測。美國太空總署(NASA)的「超級相機」(Supercam)計畫的成功提升了這項技術的聲望,加拿大富鎳的薩德伯里盆地(Sudbury Basin)的礦山也擴大部署LIBS探針來指導選擇性開採。墨西哥的汽車供應鏈也正在效仿,部署攜帶式設備來確保合金的一致性。
亞太地區預計將成為成長最快的地區,到2030年複合年成長率將達到6.82%,這主要得益於中國稀土元素壟斷地位以及電池超級工廠對快速元素平衡檢測的需求。預計到2050年,北京的廢鐵處理量將成長兩倍,而利用雷射誘導擊穿光譜(LIBS)進行分選正日益受到關注,被視為實現永續煉鋼的關鍵。在日本和韓國,這項技術已被用於半導體前驅體的純度控制;而在印度,隨著採礦業的快速擴張,手持式設備正被引入用於品位控制。在澳大利亞,攜帶式LIBS正被用於新興鋰輝石礦計畫的現場,以加速鋰鹵水的表徵。
在歐洲,這項技術正以平衡的方式應用,這得益於嚴格的環境法規,這些法規要求對廢棄電子電氣設備(WEEE)和廢料流進行快速的現場檢驗。德國正在將雷射誘導擊穿光譜(LIBS)技術整合到自動化生產線中,挪威則正在進行海上LIBS技術在海底礦產探勘的試點應用。歐盟正透過津貼支持LIBS、人工智慧和機器人整合平台的商業化,目標是使關鍵原料的回收率達到90%以上。隨著探勘和環境監測預算的增加,中東、非洲和南美洲的次市場規模也逐漸擴大,這使得LIBS市場真正走向全球。
其他好處:
- Excel格式的市場預測(ME)表
- 3個月的分析師支持
目錄
第1章:引言
- 市場分析與定義的前提條件
- 分析範圍
第2章 分析方法
第3章執行摘要
第4章 市場狀況
- 市場概覽
- 市場促進因素
- 整個工業價值鏈對即時、現場元素分析的需求日益成長。
- 加強對環境、食品和消費品中有害物質的法律規範。
- 固體雷射和光譜儀的小型化和成本降低
- 增加關鍵礦產探勘和電池供應鏈的投資。
- 促進金屬回收和廢料自動分類的循環經濟政策。
- 政府資助的航太和國防計畫支持雷射誘導擊穿光譜技術的有效性。
- 市場限制因素
- X光螢光分析(XRF)和ICP方法在岩心檢測實驗室中具有已確立的優勢。
- 基體效應和校準複雜性導致精確度變化。
- 職場的雷射安全法規導致認證成本不斷上漲。
- 缺乏能夠進行高級光譜數據分析的熟練人員
- 供應鏈分析
- 監理情勢
- 技術展望
- 波特五力分析
第5章:預測市場規模與成長率
- 依產品類型
- 桌上型系統
- 手持式/可攜式分析儀
- 遠程/遠距離 LIBS
- 整合式雷射誘導擊穿光譜-拉曼系統
- OEM/模組化零件
- 按最終用戶行業分類
- 金屬和採礦
- 工業製造和廢料回收
- 環境和農業監測
- 研究與學術
- 製藥
- 其他領域(法醫學、國防等)
- 地區
- 北美洲
- 美國
- 加拿大
- 墨西哥
- 歐洲
- 德國
- 英國
- 法國
- 義大利
- 西班牙
- 其他歐洲國家
- 亞太地區
- 中國
- 日本
- 印度
- 韓國
- 澳洲
- 其他亞太國家
- 中東和非洲
- GCC
- 南非
- 其他中東和非洲國家
- 南美洲
- 巴西
- 阿根廷
- 其他南美國家
- 北美洲
第6章 競爭情勢
- 市場集中度
- 市佔率分析
- 公司簡介
- Avantes BV
- AMETEK, Inc.(SPECTRO Analytical Instruments GmbH)
- Applied Photonics Ltd
- Applied Spectra
- B&W Tek(Metrohm)
- Bruker
- Halma Plc(Ocean Optics)
- Hitachi High-Tech Corporation(Hitachi, Ltd)
- Horiba, Ltd
- Keyence Corporation
- Lightigo sro
- LTB Lasertechnik Berlin GmbH
- Optosky
- Rigaku Holdings Corporation
- SciAps, Inc.
- Secopta(IMS Messsysteme GmbH)
- Thermo Fisher Scientific Inc.
- TSI Incorporated
- Vela Instruments LLC
- Wuxi Jinyibo Instrument Technology Co., Ltd
第7章 市場機會與未來展望
According to Mordor Intelligence, the laser-Induced breakdown spectroscopy market size is expected to increase from USD 218.33 million in 2025 to USD 229.08 million in 2026 and reach USD 307.54 million by 2031, growing at a CAGR of 6.07% over 2026-2031.
This report is Segmented by Product Type (Benchtop Systems, Handheld/Portable Analyzers, Stand-off/Remote LIBS, Integrated LIBS-Raman Systems, and More), End-User Industry (Metals & Mining, Industrial Manufacturing & Scrap-Recycling, Environmental & Agriculture Monitoring, and More), and Geography (North America, Europe, Asia Pacific, Middle East, and More). The Market Forecasts are Provided in Terms of Value (USD).
Global Laser-Induced Breakdown Spectroscopy Market Trends and Insights
Growing Need for Real-Time, In-Situ Elemental Testing Across Industrial Value Chains
Instantaneous compositional feedback is now critical for process optimization, quality assurance, and resource estimation. A 65 g LIBS payload on NASA's Mars 2020 rover shows that robust analysis can occur in extreme environments after an 87% weight reduction versus earlier designs. Steelmakers deploy similar handheld units on shop floors to curb off-spec alloy batches that once triggered re-melts. Mining companies gain weeks of cycle-time savings when downhole LIBS probes replace laboratory assay chains that relied on shipping core samples off-site. Scrap yards use the same portability to classify complex alloys in seconds, a shift that boosts margin as metal-price volatility magnifies the expense of mis-sorted feedstock. As value chains run leaner, the window for corrective action shrinks, creating a structural pull on the LIBS market for real-time analytics.
Intensifying Regulatory Oversight on Hazardous Elements in Environment, Food, and Consumer Goods
In 2024, the U.S. Environmental Protection Agency designated PFOA and PFOS as hazardous substances, triggering deeper site-monitoring mandates. European directives demand recovery of 25% of key raw materials from recycled waste streams by 2030. These edicts raise sample volumes and shorten reporting timetables, favoring field-deployable LIBS tools that can screen soils, plastics, or food powders without laboratory backlogs. Researchers demonstrated cadmium quantification from 70 ppm to 5,000 ppm in cocoa powder within minutes, underscoring how LIBS aligns with farm-to-fork traceability pressures. Faster compliance checks lower the risk of shipment holds and recalls, reinforcing adoption.
Established Dominance of XRF and ICP Methods in Core Laboratories
X-ray fluorescence and ICP-MS amassed decades of method validation and entrenched capital bases, so labs hesitate to overhaul workflows. Comparative trials reveal ICP-MS still holds lower detection limits for trace metals such as strontium or chromium. Regulatory auditors are comfortable with established protocols, generating compliance inertia. LIBS suppliers respond by positioning instruments as frontline screeners that triage samples before confirmatory ICP runs, thereby creating coexistence rather than direct substitution. Over time, combined workflows shorten turnaround time and reduce consumables, nudging labs toward broader LIBS adoption.
Other drivers and restraints analyzed in the detailed report include:
- Miniaturization and Cost Decline of Solid-State Lasers and Spectrometers
- Rising Investments in Critical Mineral Exploration and Battery Supply Chains
- Accuracy Variability Due to Matrix Effects and Calibration Complexity
For complete list of drivers and restraints, kindly check the Table Of Contents.
Segment Analysis
Handheld / Portable Analyzers controlled 48.09% of 2025 revenue as users prioritized mobility and instant decision-making, a dominance that underscores how portability shapes the modern LIBS market size for front-line tasks. Thermo Fisher Scientific's Niton Apollo exemplifies the category by offering Wi-Fi-enabled carbon equivalency analysis inside a 2 kg, IP54-rated shell. Stand-off and remote systems are projected to deliver the highest 7.55% CAGR, as industries ranging from nuclear decommissioning to deep-sea mining adopt non-contact inspection to balance worker safety with analytical reach.
Benchtop instruments continue to serve labs that need greater spectral resolution, while OEM modules let machine builders weave LIBS into robotics and manufacturing cells. The LIBS industry's shift toward integrated LIBS-Raman devices hints at a post-instrument era where multi-modal sensors are embedded within production lines. Double-pulse underwater variants have analyzed minerals at 6,000 m depth, eliminating core-sample retrieval delays. Whether strapped to Mars rovers or recycling robots, versatility cements the LIBS market's expansion path.
Complete Report Scope:
- By Product Type
- Benchtop Systems
- Handheld / Portable Analyzers
- Stand-off / Remote LIBS
- Integrated LIBS-Raman Systems
- OEM / Module Components
- By End-User Industry
- Metals & Mining
- Industrial Manufacturing & Scrap-Recycling
- Environmental & Agriculture Monitoring
- Research & Academia
- Pharmaceuticals
- Others (Forensics and Defense, among others)
- Geography
- North America
- United States
- Canada
- Mexico
- Europe
- Germany
- United Kingdom
- France
- Italy
- Spain
- Rest of Europe
- Asia-Pacific
- China
- Japan
- India
- South Korea
- Australia
- Rest of Asia-Pacific
- Middle East and Africa
- GCC
- South Africa
- Rest of Middle East and Africa
- South America
- Brazil
- Argentina
- Rest of South America
- North America
Geography Analysis
North America commanded 40.37% of 2025 revenue on the back of federal funding, thriving aerospace-defense ecosystems, and a resilient mining sector. The Department of Energy's loan-guarantee program funnels capital toward critical-mineral processing, giving domestic suppliers an incentive to adopt LIBS for real-time impurity detection. NASA's SuperCam success maintains technology prestige, and Canada's nickel-rich Sudbury Basin mines increasingly deploy LIBS probes to guide selective extraction. Mexico's automotive supply chain follows suit, adding portable units to assure alloy conformity.
Asia-Pacific represents the fastest 6.82% CAGR trajectory through 2030, led by China's rare-earth monopoly and battery gigafactories that need rapid elemental balance checks. Beijing's scrap-steel tonnage is forecast to triple by 2050, spotlighting LIBS-enabled sorting as a linchpin in sustainable steelmaking. Japan and South Korea apply the technology to semiconductor precursor purity, while India's mining surge adapts handheld units for grade control. Australia leverages field-portable LIBS to speed lithium brine characterization across its emerging spodumene projects.
Europe shows balanced uptake driven by tight environmental statutes demanding rapid in-situ verification of WEEE and scrap streams. Germany integrates LIBS into automated production lines, and Norway pilots offshore LIBS for subsea mineral scouting. EU grants targeting >90% critical-raw-material recovery fuel commercialization of LIBS-AI-robotics platforms. Secondary markets in the Middle East, Africa, and South America gradually scale as exploration and environmental monitoring budgets expand, rounding out a truly global LIBS market.
- Avantes BV
- AMETEK, Inc. (SPECTRO Analytical Instruments GmbH)
- Applied Photonics Ltd
- Applied Spectra
- B&W Tek (Metrohm)
- Bruker
- Halma Plc (Ocean Optics)
- Hitachi High-Tech Corporation (Hitachi, Ltd)
- HORIBA
- Keyence Corporation
- Lightigo s.r.o.
- LTB Lasertechnik Berlin GmbH
- Optosky
- Rigaku Holdings Corporation
- SciAps, Inc.
- Secopta (IMS Messsysteme GmbH)
- Thermo Fisher Scientific
- TSI Incorporated
- Vela Instruments LLC
- Wuxi Jinyibo Instrument Technology Co., Ltd
Additional Benefits:
- The market estimate (ME) sheet in Excel format
- 3 months of analyst support
TABLE OF CONTENTS
1 Introduction
- 1.1 Study Assumptions & Market Definition
- 1.2 Scope of the Study
2 Research Methodology
3 Executive Summary
4 Market Landscape
- 4.1 Market Overview
- 4.2 Market Drivers
- 4.2.1 Growing Need For Real-Time, In-Situ Elemental Testing Across Industrial Value Chains
- 4.2.2 Intensifying Regulatory Oversight On Hazardous Elements In Environment, Food, And Consumer Goods
- 4.2.3 Miniaturization and Cost Decline of Solid-State Lasers and Spectrometers
- 4.2.4 Rising Investments in Critical Mineral Exploration and Battery Supply Chains
- 4.2.5 Circular Economy Policies Fueling Metal Recycling and Scrap Sorting Automation
- 4.2.6 Government-Funded Space and Defense Programs Validating LIBS Technology
- 4.3 Market Restraints
- 4.3.1 Established Dominance of X-ray Fluorescence and ICP Methods in Core Laboratories
- 4.3.2 Accuracy Variability Due to Matrix Effects and Calibration Complexity
- 4.3.3 Workplace Laser-Safety Regulations Increasing Certification Costs
- 4.3.4 Limited Availability of Skilled Personnel for Advanced Spectroscopic Data Interpretation
- 4.4 Supply-Chain Analysis
- 4.5 Regulatory Landscape
- 4.6 Technological Outlook
- 4.7 Porter's Five Forces
- 4.7.1 Threat of New Entrants
- 4.7.2 Threat of Substitutes
- 4.7.3 Bargaining Power of Buyers
- 4.7.4 Bargaining Power of Suppliers
- 4.7.5 Competitive Rivalry
5 Market Size & Growth Forecasts
- 5.1 By Product Type
- 5.1.1 Benchtop Systems
- 5.1.2 Handheld / Portable Analyzers
- 5.1.3 Stand-off / Remote LIBS
- 5.1.4 Integrated LIBS-Raman Systems
- 5.1.5 OEM / Module Components
- 5.2 By End-User Industry
- 5.2.1 Metals & Mining
- 5.2.2 Industrial Manufacturing & Scrap-Recycling
- 5.2.3 Environmental & Agriculture Monitoring
- 5.2.4 Research & Academia
- 5.2.5 Pharmaceuticals
- 5.2.6 Others (Forensics and Defense, among others)
- 5.3 Geography
- 5.3.1 North America
- 5.3.1.1 United States
- 5.3.1.2 Canada
- 5.3.1.3 Mexico
- 5.3.2 Europe
- 5.3.2.1 Germany
- 5.3.2.2 United Kingdom
- 5.3.2.3 France
- 5.3.2.4 Italy
- 5.3.2.5 Spain
- 5.3.2.6 Rest of Europe
- 5.3.3 Asia-Pacific
- 5.3.3.1 China
- 5.3.3.2 Japan
- 5.3.3.3 India
- 5.3.3.4 South Korea
- 5.3.3.5 Australia
- 5.3.3.6 Rest of Asia-Pacific
- 5.3.4 Middle East and Africa
- 5.3.4.1 GCC
- 5.3.4.2 South Africa
- 5.3.4.3 Rest of Middle East and Africa
- 5.3.5 South America
- 5.3.5.1 Brazil
- 5.3.5.2 Argentina
- 5.3.5.3 Rest of South America
- 5.3.1 North America
6 Competitive Landscape
- 6.1 Market Concentration
- 6.2 Market Share Analysis
- 6.3 Company Profiles {(includes Global level Overview, Market level overview, Core Segments, Financials as available, Strategic Information, Market Rank/Share for key companies, Products & Services, and Recent Developments)}
- 6.3.1 Avantes BV
- 6.3.2 AMETEK, Inc. (SPECTRO Analytical Instruments GmbH)
- 6.3.3 Applied Photonics Ltd
- 6.3.4 Applied Spectra
- 6.3.5 B&W Tek (Metrohm)
- 6.3.6 Bruker
- 6.3.7 Halma Plc (Ocean Optics)
- 6.3.8 Hitachi High-Tech Corporation (Hitachi, Ltd)
- 6.3.9 Horiba, Ltd
- 6.3.10 Keyence Corporation
- 6.3.11 Lightigo s.r.o.
- 6.3.12 LTB Lasertechnik Berlin GmbH
- 6.3.13 Optosky
- 6.3.14 Rigaku Holdings Corporation
- 6.3.15 SciAps, Inc.
- 6.3.16 Secopta (IMS Messsysteme GmbH)
- 6.3.17 Thermo Fisher Scientific Inc.
- 6.3.18 TSI Incorporated
- 6.3.19 Vela Instruments LLC
- 6.3.20 Wuxi Jinyibo Instrument Technology Co., Ltd
7 Market Opportunities & Future Outlook
- 7.1 White-space & unmet-need assessment

 紫外光譜:市場佔有率分析、產業趨勢與統計、成長預測(2026-2031)
 聯用光譜市場規模、佔有率和成長分析:按光譜類型、產品類型、應用、最終用戶和地區分類 - 產業預測,2026-2033 年
 光譜學市場:按組件、技術、儀器類型、測量方法、操作模式、應用和最終用戶分類-2026-2032年全球市場預測線上紫外-可見光光譜市場:按組件、技術平台、分析儀器架構、應用和最終用戶分類-2026-2032年全球市場預測
 螢光光譜市場規模、佔有率和成長分析:按類型、應用和地區分類-2026-2033年產業預測雷射誘導破壞光譜儀市場:按產品類型、組件、雷射類型、脈衝持續時間、應用、最終用戶分類,全球預測,2026-2032年表面光電壓光譜設備市場(按組件、產品類型、技術、波長範圍、工作模式、應用、最終用途和銷售管道),全球預測,2026-2032年
 在線連續紫外-可見光光譜全球市場報告(2026年)
 全球雷射誘導破壞光譜儀市場規模、佔有率、趨勢和成長分析報告(2026-2034年)
 全球螢光光譜市場