


 |
市場調查報告書
商品編碼
2117343
循環聚合物:市場佔有率分析、產業趨勢與統計、成長預測(2026-2031)Circular Polymers - Market Share Analysis, Industry Trends & Statistics, Growth Forecasts (2026 - 2031) |
||||||

※ 本網頁內容可能與最新版本有所差異。詳細情況請與我們聯繫。
根據 Mordor Intelligence 預測,再生聚合物市場規模預計將從 2025 年的 2,009 萬噸成長到 2026 年的 2,158 萬噸,並將從 2026 年到 2031 年以 7.42% 的複合年成長率成長,到 2031 年達到 3,086 萬噸。
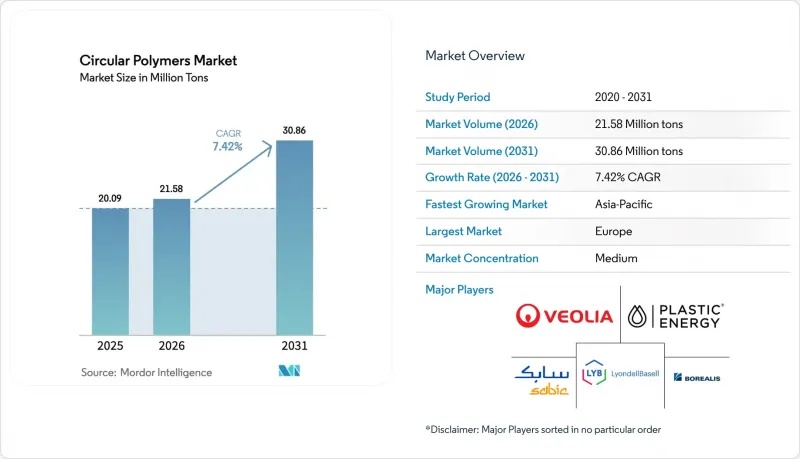
本報告按聚合物(聚對苯二甲酸乙二醇酯 (PET)、聚乙烯及其他)、回收技術(機械回收、化學回收及其他)、終端用戶產業(包裝、建築及其他)和地區(亞太、北美、歐洲、南美、中東和非洲)對產業進行分類。市場預測以噸為單位。
全球循環聚合物市場趨勢與洞察
擴大再生聚合物在包裝應用的使用
品牌所有者為實現包裝中50%的再生材料含量所做的努力正在推動市場需求成長,而歐盟第2023/2683號決議則規定,到2025年, 寶特瓶再生塑膠的含量必須達到25%,到2030年,所有飲料瓶中再生塑膠的含量必須達到30%。像Berry Global這樣的公司報告稱,根據「Impact 2025」藍圖,其廢舊樹脂消耗量增加了43%。數位水印技術和人工智慧分類機正在提高包裝材料的純度,幫助加工商達到食品級安全標準。單一材料軟性包裝使得以往成本較高的機械加工方式更具可行性。這些進步提高了循環聚合物市場的供應穩定性,並促進了廢棄物管理者和樹脂買家之間簽訂長期合約。
人們對循環經濟實踐的認知不斷提高,相關法規也日益完善。
生產者延伸責任制(EPR)和強制性再生材料含量要求正日益將循環經濟理念融入採購決策。歐盟法規 (EU) 2025/351 提高了食品接觸用再生塑膠的純度標準,並引入了可追溯性協議。中國國家食品安全風險評估中心正積極推動與美國和歐盟標準的監管協調,為2025年正式推出食品接觸用塑膠法規鋪路。在美國,HR 9676 法案提案了一項全國性的回收標準,目標是到2030年實現50%的塑膠回收再利用。這種監管協調將為下一代再生資產的資本配置提供更明確的獎勵。
原料污染程度的差異
分析研究在從多個國家回收的再生顆粒中檢測到191種農藥和107種藥物,凸顯了持續存在的污染風險,其含量可能超過食品暴露基準值。雖然單獨收集高密度聚乙烯(HDPE)牛奶瓶可以減少交叉污染,但在機械再加工過程中仍存在七種污染途徑。人工智慧分類機和數位浮水印技術可以提高均質性,但會增加小規模回收商的資本支出(CAPEX)。這些挑戰導致尋求食品級認證的加工商認證成本增加,減緩了循環聚合物市場的短期成長。
細分市場分析
到2025年,PET將佔據再生聚合物市場41.62%的佔有率,這得益於其成熟的「瓶到瓶」回收體係以及全球品牌的廣泛採用。在印度, 寶特瓶的年處理量為50萬噸,回收率將達95%。 PET還具有清晰的食品級認證途徑,隨著飲料生產商增加再生材料的使用,預計其市場佔有率將進一步擴大。 2024年下半年,機械加工的PET薄片價格將維持在原生樹脂價格的4%以內,降低了成本門檻。
尼龍-6是成長最快的聚合物,預計到2031年複合年成長率將達到8.37%。催化解聚技術無需使用溶劑,即可在數秒內生產高純度己內醯胺,單體回收率超過90%。經證實,再生尼龍具有與新尼龍相當的機械性能,因此在汽車輕量化和高性能纖維領域備受青睞。德國和日本的連續循環中先導工廠計劃於2026年開始商業化生產,將進一步拓展循環聚合物市場。
在聚烯領域,機械性能的提升已使再生中聚聚丙烯(mPP)的成本降低了30%,但確保其符合食品級標準仍然是一項挑戰。溶解過程可去除聚丙烯中的顏料和氣味成分,將二氧化碳排放量降低至每公斤再生聚丙烯0.32公斤,使其能夠應用於高價值包裝領域。聚氯乙烯(PVC)的回收需要脫氯處理,這增加了製程的複雜性。 ABS和聚碳酸酯等特種樹脂的成長速度雖然較慢,但在消費性電子產品回收專案中正日益受到關注。
區域分析
預計到2025年,歐洲將佔據循環聚合物市場31.22%的佔有率。這得歸功於嚴格的循環經濟指令和完善的回收網路。歐盟的《包裝和包裝廢棄物法規》分階段強制規定了再生材料含量,而《通用產品安全法規》則收緊了產品標籤和安全標準。高品質再生樹脂的供需失衡導致其價格比傳統等級高出每噸250美元,從而刺激了歐盟內部的再生聚合物貿易。利安德巴塞爾投資4000萬歐元建設的化學回收工廠以及北歐化工在比利時建設的Borcycle M混煉生產線等投資項目正在加強當地的供應基礎。由於循環利用方面仍存在差距,歐盟正在尋求與亞洲供應商建立進口合作夥伴關係。
預計到2031年,亞太地區的複合年成長率將達到8.46%,是所有地區中最高的。儘管中國的寶特瓶回收率已達96.48%,但估計6,300萬噸塑膠廢棄物總量中僅有30%被回收利用,仍有很大的成長空間。在印度,到2025-2026年,再生材料含量必須提高到30%,到2028-2029年達到60%,這正在推動資本流入。由Indorama Ventures、Dhunseri和Varun Beverages共同營運的平台每年將新增10萬噸rPET產能,而Ganesha Ecopet的目標是到2026年實現年產4.2萬噸。
在北美,成熟的機械回收生產線和不斷擴大的化學回收試點計畫為塑膠回收提供了有利條件。美國眾議院第9676號法案旨在2030年實現50%的塑膠回收再利用,並尋求建立統一的國家標準,以簡化原料流通。墨西哥和加拿大已採用相容的標籤系統,促進了再生塑膠薄片和顆粒的區域貿易。
南美洲、中東和非洲正成為新的成長中心。在巴西,在國家衛生監督局(ANVISA)的食品安全監管下, 寶特瓶的回收率到2024年已提升至56.4%。沙烏地阿拉伯的「2030願景」要求沙烏地阿拉伯投資回收公司實現95%的廢棄物回收率,預計將為沙烏地阿拉伯國內生產總值貢獻1,200億沙烏地裡亞爾。波灣合作理事會(GCC)各國的項目包括興建溶劑回收工廠,並已建立完善的系統,為亞洲加工商供貨。
其他好處
- Excel格式的市場預測(ME)表
- 3個月的分析師支持
目錄
第1章:引言
- 研究假設和市場定義
- 調查範圍
第2章:調查方法
第3章執行摘要
第4章 市場狀況
- 市場概覽
- 市場促進因素
- 擴大再生聚合物在包裝應用的使用
- 人們對循環經濟實踐的認知不斷提高,相關法規也日益完善。
- 對回收基礎設施進行大規模投資
- 汽車產業需求不斷成長
- 建築業對隔熱材料、電線和地毯的需求增加
- 市場限制因素
- 原料污染程度的差異
- 原油價格低迷帶來的成本劣勢
- 高額初始資本支出(CAPEX)
- 價值鏈分析
- 波特五力模型
第5章 市場規模與成長預測
- 透過聚合物
- 聚對苯二甲酸乙二醇酯(PET)
- 聚乙烯
- 聚丙烯
- 聚氯乙烯(PVC)
- 尼龍-6
- 尼龍-6,6
- 其他聚合物(丙烯腈等)
- 透過回收技術
- 機械回收
- 化學回收
- 溶解/溶劑體系
- 熱解和氣化(原料)
- 能源回收(焚燒餘熱回收)
- 按最終用戶行業分類
- 包裝
- 建造
- 車
- 電氣和電子設備
- 農業
- 消費品
- 石油化學產品
- 其他終端用戶產業(紡織/服裝、醫療保健等)
- 按地區
- 亞太地區
- 中國
- 印度
- 日本
- 韓國
- 馬來西亞
- 泰國
- 印尼
- 越南
- 其他亞太國家
- 北美洲
- 美國
- 加拿大
- 墨西哥
- 歐洲
- 德國
- 英國
- 法國
- 義大利
- 西班牙
- 北歐國家
- 土耳其
- 俄羅斯
- 其他歐洲國家
- 南美洲
- 巴西
- 阿根廷
- 哥倫比亞
- 其他南美國家
- 中東和非洲
- 沙烏地阿拉伯
- 阿拉伯聯合大公國
- 卡達
- 南非
- 奈及利亞
- 埃及
- 其他中東和非洲國家
- 亞太地區
第6章 競爭情勢
- 市場集中度
- 策略趨勢
- 市佔率和排名分析
- 公司簡介
- Agilyx
- Biffa
- Borealis GmbH
- Braskem
- Chevron Phillips Chemical Company LLC.
- Eastman Chemical Company
- Enerkem
- Exxon Mobil Corporation
- Jindal Poly Films Limited(JPFL)
- KW Plastics
- Loop Industries
- LyondellBasell Industries Holdings BV
- Plastic Energy
- SABIC
- TotalEnergies
- Veolia
- Visy
第7章 市場機會與未來展望
According to Mordor Intelligence, the circular polymers market size is expected to grow from 20.09 million tons in 2025 to 21.58 million tons in 2026 and is forecast to reach 30.86 million tons by 2031 at 7.42% CAGR over 2026-2031.
This report Segments the Industry by Polymer (Polyethylene Terephthalate (PET), Polyethylene, and More), Recycling Technology (Mechanical Recycling, Chemical Recycling, and More), End-User Industry (Packaging, Construction, and More), and Geography (Asia-Pacific, North America, Europe, South America, and Middle East and Africa). The Market Forecasts are Provided in Terms of Volume (Tons).
Global Circular Polymers Market Trends and Insights
Increasing Use of Recycled Polymers in Packaging Application
Brand-owner commitments to 50% recycled content in packaging are amplifying demand, while the EU Decision 2023/2683 enforces 25% recycled plastic in PET bottles by 2025 and 30% in all beverage bottles by 2030. Companies such as Berry Global reported a 43% jump in post-consumer resin consumption under its Impact 2025 roadmap. Digital watermarks and AI-enabled sorters are improving bale purity, helping converters meet food-grade safety criteria. Mono-material flexible packs further unlock mechanical routes that were previously uneconomic. These developments enhance volume certainty for the circular polymers market and nurture long-range contracts between waste managers and resin buyers.
The Growing Awareness and Regulations Promoting Circular Economy Practices
Extended producer responsibility schemes and recycled-content mandates are embedding circularity into procurement decisions. The European Regulation (EU) 2025/351 tightens purity limits and introduces traceability protocols for recycled food-contact plastics. China's National Center for Food Safety Risk Assessment is driving regulatory convergence with US and EU standards, paving the way for formal food-contact rules in 2025. In the United States, H.R. 9676 proposes national recycling standards targeting 50% plastics recycling by 2030. Such harmonization provides clearer incentives for capital allocation into next-generation recycling assets.
Feedstock Contamination Variability
Analytical studies found 191 pesticides and 107 pharmaceuticals in recycled pellets from multiple countries, underscoring persistent contamination risks that can breach food-contact limits. Separate collection of HDPE milk bottles mitigates cross-contamination, yet seven contamination pathways remain during mechanical reprocessing. AI-enabled sorters and digital watermarks improve homogeneity but raise CAPEX for small recyclers. These challenges add qualification costs for converters pursuing food-grade approvals, tempering near-term growth in the circular polymers market.
Other drivers and restraints analyzed in the detailed report include:
- Massive Investments in Recycling Infrastructure
- Growing Demand from the Automotive Sector
- Low-Oil-Price Cost Disadvantage
For complete list of drivers and restraints, kindly check the Table Of Contents.
Segment Analysis
PET accounted for 41.62% of the circular polymers market in 2025 owing to established bottle-to-bottle loops and global brand adoption. India reached a 95% PET-bottle recycling rate with 500,000 tons annual capability. PET also benefits from clear food-grade approval pathways, positioning it for incremental gains as beverage producers ramp up recycled content. Mechanical flake pricing remained within 4% of virgin resin during late 2024, narrowing the cost hurdle.
Nylon-6 represents the fastest-growing polymer at an 8.37% CAGR through 2031. Catalyst-driven depolymerization fields high-purity caprolactam in seconds without solvents and achieves over 90% monomer recovery. Automotive lightweighting and high-performance textiles favor nylon recyclates with verified mechanical parity. Continuous-loop pilot plants in Germany and Japan plan commercial output by 2026, adding depth to the circular polymers market.
Polyolefins leverage mechanical upgrades that slash mPP recyclate costs by 30%, but food-grade compliance remains challenging. Dissolution processes evacuate pigments and odorous compounds from polypropylene at 0.32 kg CO2-equivalent emissions per kg recycled PP, opening high-value packaging uses. PVC recycling requires dechlorination, elevating processing complexity. Specialty resins such as ABS and polycarbonate register slower growth yet gain traction in consumer-electronics take-back schemes.
Complete Report Scope:
- By Polymer
- Polyethylene Terephthalate (PET)
- Polyethylene
- Polypropylene
- Polyvinyl Chloride (PVC)
- Nylon-6
- Nylon-6,6
- Other Polymers (Acrylonitrile, etc.)
- By Recycling Technology
- Mechanical Recycling
- Chemical Recycling
- Dissolution / Solvent-based
- Pyrolysis & Gasification (Feedstock)
- Energy Recovery (Incineration with Heat Capture)
- By End-user Industry
- Packaging
- Construction
- Automotive
- Electrical and Electronics
- Agriculture
- Consumer Products
- Petrochemicals
- Other End-user Industries (Textiles and Apparel, Healthcare, etc.)
- By Geography
- Asia-Pacific
- China
- India
- Japan
- South Korea
- Malaysia
- Thailand
- Indonesia
- Vietnam
- Rest of Asia-Pacific
- North America
- United States
- Canada
- Mexico
- Europe
- Germany
- United Kingdom
- France
- Italy
- Spain
- Nordic Countries
- Turkey
- Russia
- Rest of Europe
- South America
- Brazil
- Argentina
- Colombia
- Rest of South America
- Middle East and Africa
- Saudi Arabia
- United Arab Emirates
- Qatar
- South Africa
- Nigeria
- Egypt
- Rest of Middle East and Africa
- Asia-Pacific
Geography Analysis
Europe held 31.22% of the circular polymers market share in 2025, anchored by stringent circular-economy directives and robust collection networks. The EU Packaging and Packaging Waste Regulation imposes staged recycled-content mandates, while the General Product Safety Regulation tightens product labeling and safety standards. Supply-demand imbalances for high-quality recyclate create premiums of up to USD 250 per ton over conventional grades, intensifying intra-EU trade in secondary polymers. Investments like LyondellBasell's EUR 40 million chemical-recycling plant and Borealis' Borcycle M compounding line in Belgium shore up local supply. Circularity gaps remain, prompting import partnerships with Asia-based suppliers.
Asia-Pacific records a 8.46% CAGR through 2031, the fastest among regions. China achieves a 96.48% PET-bottle recycling rate, yet only 30% of an estimated 63 million tons of overall plastic waste is recycled, leaving scope for rapid growth. India mandates 30% recycled content by 2025-2026, rising to 60% by 2028-2029, catalyzing capital inflow. Indorama Ventures' joint platform with Dhunseri and Varun Beverages adds 100 kilotons annual rPET capacity, and Ganesha Ecopet targets 42,000 tons yearly by 2026.
North America benefits from mature mechanical lines and expanding chemical-recycling pilots. The US H.R. 9676 bill seeks 50% plastics-recycling rates by 2030, establishing unified national standards that could streamline feedstock flows. Mexico and Canada adopt compatible labeling schemes, easing regional trade in recycled flakes and pellets.
South America and the Middle East & Africa form emerging growth pockets. Brazil's PET-bottle recycling rate rose to 56.4% by 2024 under ANVISA's food-safety oversight. Saudi Arabia's Vision 2030 tasks the Saudi Investment Recycling Company with achieving 95% waste recycling, eyeing SAR 120 billion GDP contribution. Project pipelines across the Gulf Cooperation Council include solvent-based recovery plants positioned to serve Asian converters.
- Agilyx
- Biffa
- Borealis GmbH
- Braskem
- Chevron Phillips Chemical Company LLC.
- Eastman Chemical Company
- Enerkem
- Exxon Mobil Corporation
- Jindal Poly Films Limited (JPFL)
- KW Plastics
- Loop Industries
- LyondellBasell Industries Holdings B.V.
- Plastic Energy
- SABIC
- TotalEnergies
- Veolia
- Visy
Additional Benefits:
- The market estimate (ME) sheet in Excel format
- 3 months of analyst support
TABLE OF CONTENTS
1 Introduction
- 1.1 Study Assumptions & Market Definition
- 1.2 Scope of the Study
2 Research Methodology
3 Executive Summary
4 Market Landscape
- 4.1 Market Overview
- 4.2 Market Drivers
- 4.2.1 Increasing Use of Recycled Polymers in Packaging Application
- 4.2.2 The Growing Awareness and Regulations Promoting Circular Economy Practices
- 4.2.3 Massive investments in recycling infrastructure
- 4.2.4 Growing demand from the automotive sector
- 4.2.5 Increasing demand in construction sector for insulation, wires and carpeting
- 4.3 Market Restraints
- 4.3.1 Feed-stock contamination variability
- 4.3.2 Low-oil-price cost disadvantage
- 4.3.3 High initial capital expenditure (CAPEX)
- 4.4 Value Chain Analysis
- 4.5 Porter's Five Forces
- 4.5.1 Bargaining Power of Suppliers
- 4.5.2 Bargaining Power of Buyers
- 4.5.3 Threat of New Entrants
- 4.5.4 Threat of Substitutes
- 4.5.5 Competitive Rivalry
5 Market Size & Growth Forecasts (Volume)
- 5.1 By Polymer
- 5.1.1 Polyethylene Terephthalate (PET)
- 5.1.2 Polyethylene
- 5.1.3 Polypropylene
- 5.1.4 Polyvinyl Chloride (PVC)
- 5.1.5 Nylon-6
- 5.1.6 Nylon-6,6
- 5.1.7 Other Polymers (Acrylonitrile, etc.)
- 5.2 By Recycling Technology
- 5.2.1 Mechanical Recycling
- 5.2.2 Chemical Recycling
- 5.2.3 Dissolution / Solvent-based
- 5.2.4 Pyrolysis & Gasification (Feedstock)
- 5.2.5 Energy Recovery (Incineration with Heat Capture)
- 5.3 By End-user Industry
- 5.3.1 Packaging
- 5.3.2 Construction
- 5.3.3 Automotive
- 5.3.4 Electrical and Electronics
- 5.3.5 Agriculture
- 5.3.6 Consumer Products
- 5.3.7 Petrochemicals
- 5.3.8 Other End-user Industries (Textiles and Apparel, Healthcare, etc.)
- 5.4 By Geography
- 5.4.1 Asia-Pacific
- 5.4.1.1 China
- 5.4.1.2 India
- 5.4.1.3 Japan
- 5.4.1.4 South Korea
- 5.4.1.5 Malaysia
- 5.4.1.6 Thailand
- 5.4.1.7 Indonesia
- 5.4.1.8 Vietnam
- 5.4.1.9 Rest of Asia-Pacific
- 5.4.2 North America
- 5.4.2.1 United States
- 5.4.2.2 Canada
- 5.4.2.3 Mexico
- 5.4.3 Europe
- 5.4.3.1 Germany
- 5.4.3.2 United Kingdom
- 5.4.3.3 France
- 5.4.3.4 Italy
- 5.4.3.5 Spain
- 5.4.3.6 Nordic Countries
- 5.4.3.7 Turkey
- 5.4.3.8 Russia
- 5.4.3.9 Rest of Europe
- 5.4.4 South America
- 5.4.4.1 Brazil
- 5.4.4.2 Argentina
- 5.4.4.3 Colombia
- 5.4.4.4 Rest of South America
- 5.4.5 Middle East and Africa
- 5.4.5.1 Saudi Arabia
- 5.4.5.2 United Arab Emirates
- 5.4.5.3 Qatar
- 5.4.5.4 South Africa
- 5.4.5.5 Nigeria
- 5.4.5.6 Egypt
- 5.4.5.7 Rest of Middle East and Africa
- 5.4.1 Asia-Pacific
6 Competitive Landscape
- 6.1 Market Concentration
- 6.2 Strategic Moves
- 6.3 Market Share (%)/Ranking Analysis
- 6.4 Company Profiles (includes Global level Overview, Market level overview, Core Segments, Financials as available, Strategic Information, Market Rank/Share, Products & Services, Recent Developments)
- 6.4.1 Agilyx
- 6.4.2 Biffa
- 6.4.3 Borealis GmbH
- 6.4.4 Braskem
- 6.4.5 Chevron Phillips Chemical Company LLC.
- 6.4.6 Eastman Chemical Company
- 6.4.7 Enerkem
- 6.4.8 Exxon Mobil Corporation
- 6.4.9 Jindal Poly Films Limited (JPFL)
- 6.4.10 KW Plastics
- 6.4.11 Loop Industries
- 6.4.12 LyondellBasell Industries Holdings B.V.
- 6.4.13 Plastic Energy
- 6.4.14 SABIC
- 6.4.15 TotalEnergies
- 6.4.16 Veolia
- 6.4.17 Visy
7 Market Opportunities & Future Outlook
- 7.1 White-space & unmet-need assessment

 2026-2030年全球再生聚合物市場
 再生塑膠和循環聚合物市場:預測至2034年-按聚合物類型、回收技術、循環經濟模式、最終用戶和地區分類的全球分析
 圓形聚合物薄膜市場規模、佔有率和趨勢分析報告:按材料類型、厚度、最終用途、地區和細分市場預測(2026-2033 年)
 循環聚合物市場規模、佔有率和成長分析:按聚合物類型、製造流程、應用、最終用途和地區分類-2026-2033年產業預測
 循環聚合物市場機會、成長要素、產業趨勢分析及2026-2035年預測
 2026年全球循環聚合物市場報告環狀聚合物原料市場預測至2032年:依聚合物類型、原料類型、產地、最終用戶及地區分類2032 年環狀聚合物市場預測:按聚合物類型、形態、環狀度、製造流程、應用、最終用戶和地區進行的全球分析
 全球循環聚合物市場