


 |
市場調查報告書
商品編碼
2116908
歐洲海上能源:市場佔有率分析、產業趨勢與統計及成長預測(2026-2031 年)Europe Offshore Energy - Market Share Analysis, Industry Trends & Statistics, Growth Forecasts (2026 - 2031) |
||||||

※ 本網頁內容可能與最新版本有所差異。詳細情況請與我們聯繫。
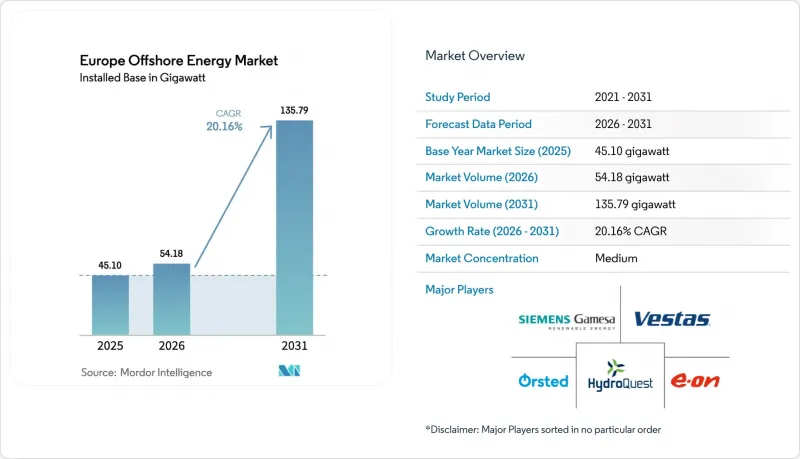
據 Mordor Intelligence 稱,歐洲海上能源市場預計到 2026 年將達到 54.18 吉瓦,高於 2025 年的 45.10 吉瓦,預計到 2031 年將達到 135.79 吉瓦。
預計從 2026 年到 2031 年,其複合年成長率將達到 20.16%。
本報告按技術(風力發電、潮汐能和波浪能、海洋溫差能轉換及其他技術)、水深(0-30米、30-60米及其他)、額定功率(5兆瓦以下、5-10兆瓦、10-15兆瓦和15兆瓦以上)和歐洲地區(英國、德國、荷蘭、荷蘭、挪威、法國、瑞典和歐洲國家分類。
歐洲海上能源市場的趨勢與洞察
歐盟綠色新政的容量目標和各國離岸風力發電競標
具有法律約束力的《綠色新政法案》設定了離岸風力發電目標:到2030年達到86-89吉瓦,到2050年達到356-366吉瓦。這促使歐洲各地陸續宣布了一系列競標計劃,為開發商提供了海底租賃、差價合約(CfD)行使價格和併網的長期前景。法國計劃在2035年競標10吉瓦的裝機容量,而丹麥最新一輪的競標預計將採購足夠的電力以滿足其電力需求。位於英國水域的Hornsea 3項目已獲得與通膨掛鉤的37.35英鎊/兆瓦時的差價合約,這表明政策確定性如何降低資金籌措成本和競標價格。結合REPowerEU的“Accele-RES”數位授權平台和26個國家簽署的“歐洲風能憲章”,行政瓶頸正在緩解。作為證據,2024 年,歐洲各地舉行了 20 多項競爭性競標,總合分配了超過 55 吉瓦的容量。
15兆瓦以上風力渦輪機成本的快速下降使得深海計畫成為可能。
維斯塔斯公司在德國Nordlicht 1項目中獲批的15兆瓦級平台商業訂單表明,大型風力發電機已從原型階段過渡到資金籌措的產品等級。在北海穩定的風況下,這些風力發電機將使容量係數提升至近70%,與8兆瓦級佈局相比,基礎數量最多可減少40%,並且即使考慮到近期鋼材價格的波動,每兆瓦的安裝成本也將降低。未來計畫中已包括來自歐洲和亞洲原始設備製造商的20兆瓦原型機,這表明這一趨勢正在形成。目前面臨的挑戰在於安裝物流。由於能夠處理超過1200噸機艙的升降式起重船數量極少,造船廠需要在未來三年內加快新船建造週期,以避免工期延誤。
下一代風力渦輪機重型裝運船隻供不應求
全球僅有15至20艘能夠裝載15兆瓦以上渦輪機的重型裝運船隻,且2022年至2024年間日租金飆升了75%。這種情況令人想起10年前LNG裝運船隻市場供不應求的局面。現有租賃開發商(如Austoed、RWE和Vattenfall)已鎖定多年租期,導致新參與企業要么爭相追趕,要么被迫延期。資金籌措一艘新船可能需要4億美元,耗時長達三年。為填補船隊缺口,總共需要148億美元的資本投資。同時,工期延誤可能會影響競標的獲利能力,尤其是在西班牙等新興市場,因為西班牙浮體式試點計畫的成功取決於船舶的可用性。
細分市場分析
到2025年,風電將佔歐洲海上能源市場規模的82.60%,預計2031年將繼續以21.34%的複合年成長率成長。這項增速遠超潮汐能和波浪能試點項目,後者目前仍處於商業化前期。儘管近期原料價格有所上漲,但風電基礎設施受益於20年的經驗累積、可靠的營運記錄以及完全攤銷的供應鏈,從而降低了單位成本。更廣泛的政策環境也支持了這項優勢。北海沿岸國家將海底使用權的授予與專用電網的建設掛鉤,開發商透過以低於40歐元/兆瓦時的價格簽訂差價合約(CfD)來降低市場風險。儘管在大西洋門戶地區,潮汐能和波浪能技術在技術上前景廣闊,但它們仍然面臨著高昂的平準化發電成本和原始設備製造商(OEM)之間有限的競爭。儘管像Magallanes Renovables公司的浮體式潮汐發電平台這樣的示範專案已實現了45%的裝置容量利用率,但它們缺乏多供應商採購系統來降低採購風險。海洋溫差發電(OTEC)計畫仍限於水溫較高的赤道海域,歐洲海域因此不在經濟可行的範圍內。因此,歐洲海上能源市場的大部分資金仍投資於風電的擴張,預計風電將保持其主導地位至2031年。
技術採納率也揭示了風電產業向浮體式細分領域加速轉型的趨勢。西班牙、法國和葡萄牙正在調整其產業藍圖,以浮體式原型為基礎,將大規模生產的船體製造技術與模組化上部組裝組裝相結合,目標是在2020年代中期將價格降至100歐元/兆瓦時以下。這些成本曲線依賴標準化的錨固系統和輕質複合材料葉片,從而減輕了港口吃水限制。然而,波浪能和潮汐能的支持者正從併網調整能力的角度吸引政策制定者的注意。一些國家的政府正在將技術中立的創新基金納入競標機制,提供最低迴報保證,這可能會在2030年後將小眾可再生能源的市場佔有率推高至5%。在此之前,在成熟的運維合約結構和保障貸款人免受天氣相關運作的保險產品的支持下,風電很可能仍將是默認的投資選擇。
其他好處:
- Excel格式的市場預測(ME)表
- 3個月的分析師支持
目錄
第1章:引言
- 研究假設和市場定義
- 調查範圍
第2章:調查方法
第3章執行摘要
第4章 市場狀況
- 市場概覽
- 海上能源裝置容量(GW)的分析與預測
- 市場促進因素
- 歐盟綠色新政下的發電容量目標和各國離岸風力發電競標
- 15兆瓦以上風力渦輪機成本的快速下降使得深海計畫成為可能。
- 關於石油和天然氣平台電氣化和脫碳的法規
- 離岸風力發電併網中對綠氫能(電轉X)的需求
- 海上電網連接和OFTO/HVDC競標項目管道
- 浮體式海上風電的商業化將為大西洋和地中海地區開闢新的開發用地。
- 市場限制因素
- 用於下一代渦輪機的重型裝運船隻供應有限。
- 反對冗長的許可證獲取程序及其對沿海景觀的影響。
- 鋼鐵和稀土元素零件供應鏈通膨
- 海上電網堵塞,陸上電力接收點不足。
- 供應鏈分析
- 監理情勢
- 技術展望
- 波特五力分析
第5章 市場規模與成長預測
- 透過技術
- 風力
- 潮汐能和波浪能
- 海洋溫差發電(OTEC)
- 其他技術
- 按水深
- 0-30公尺(淺水)
- 30-60公尺(過渡區)
- 60公尺或更深(深海)
- 按安裝類型(僅進行定性分析)
- 固定基礎
- 浮體式平台(半潛式平台、超級浮標、張力腳平臺)
- 依成分(僅限定性分析)
- 渦輪
- 下部結構和基礎
- 電力基礎設施
- 海底電纜
- 錨碇和錨固系統
- 控制和監控
- 額定輸出功率(渦輪機輸出功率)
- 5兆瓦或以下
- 5~10 MW
- 10~15 MW
- 超過15兆瓦
- 按地區
- 英國
- 德國
- 荷蘭
- 丹麥
- 挪威
- 法國
- 比利時
- 瑞典
- 愛爾蘭
- 其他歐洲國家
第6章 競爭情勢
- 市場集中度
- 策略趨勢(併購、聯盟、購電協議)
- 市場佔有率分析(主要公司的市場排名和佔有率)
- 公司簡介
- Siemens Gamesa Renewable Energy SA
- Vestas Wind Systems AS
- GE Vernova(GE Renewable Energy)
- Nordex SE
- HydroQuest
- MHI Vestas Offshore Wind
- Hitachi Energy
- Orsted AS
- SSE Renewables
- Equinor ASA
- Iberdrola SA
- RWE Renewables GmbH
- EDF Renewables
- E.ON SE
- Copenhagen Infrastructure Partners
- Ocean Winds(EDP x Engie)
- TotalEnergies Renewables
- Shell New Energies
- Statkraft AS
- Northland Power Inc.
第7章 市場機會與未來展望
According to Mordor Intelligence, europe offshore energy market size in 2026 is estimated at 54.18 gigawatt, growing from 2025 value of 45.10 gigawatt with 2031 projections showing 135.79 gigawatt, growing at 20.16% CAGR over 2026-2031.
This report is Segmented by Technology (Wind Energy, Tidal and Wave Energy, Ocean Thermal Energy Conversion, and Other Technologies), Water Depth (0 To 30 M, 30 To 60 M, and Others), Capacity Rating (Up To 5 MW, 5 To 10 MW, 10 To 15 MW, and Above 15 MW), and Geography (United Kingdom, Germany, Netherlands, Denmark, Norway, France, Belgium, Sweden, Ireland, and Rest of Europe).
Europe Offshore Energy Market Trends and Insights
EU Green Deal-Driven Capacity Targets & National Offshore Auctions
Binding Green Deal legislation has set an 86-89 GW offshore target for 2030 and 356-366 GW for 2050, triggering a pan-European cascade of national auction calendars that give developers long-range visibility into seabed leases, CfD strike prices, and grid connections. France plans 10 GW of tenders by 2035, while Denmark's latest round could power the nation's electricity demand. Hornsea 3 in UK waters secured a GBP 37.35/MWh inflation-indexed CfD, demonstrating how policy certainty compresses financing costs and lowers bid pricing. Coupled with the REPowerEU "Accele-RES" digital permitting platform and the European Wind Charter signed by 26 countries, administrative bottlenecks are easing, evidenced by more than 20 competitive auctions across Europe in 2024 that collectively allocated over 55 GW of capacity.
Rapid Cost Declines in Above 15 MW Turbines Enabling Deep-Water Projects
Commercial orders for 15 MW platforms, such as Vestas' nod for Germany's Nordlicht 1, illustrate that turbine scaling has crossed from prototype to bankable product class. These machines push capacity factors toward 70% in steady North Sea wind regimes and reduce foundation counts by up to 40% compared with 8 MW layouts, cutting installed cost per megawatt even after factoring recent steel volatility. Forward pipelines already feature 20 MW prototypes from European and Asian OEMs, indicating an entrenched trend. The remaining friction point lies with installation logistics: only a handful of jack-ups can manage nacelles weighing more than 1,200 tons, so shipbuilders must accelerate newbuild cycles over the next three years to prevent execution lags.
Limited Heavy-Lift Vessel Availability for Next-Gen Turbines
Only 15-20 heavy-lift units worldwide can erect above 15 MW turbines, and day rates jumped 75% between 2022 and 2024, echoing the tight LNG carrier market a decade ago. Developers with legacy charters-Orsted, RWE, Vattenfall-have locked in multiyear slots, leaving newer entrants to scramble or delay. Financing a newbuild costs USD 400 million and can take three years; cumulative capex of USD 14.8 billion is needed to bridge the fleet gap. Until then, schedule slips risk eroding auction bid economics, especially in emerging markets like Spain, where floating pilots hinge on vessel availability.
Other drivers and restraints analyzed in the detailed report include:
- Green Hydrogen (Power-to-X) Demand for Offshore Wind Integration
- Commercialisation of Floating Wind Unlocking Atlantic & Med Sites
- Supply-Chain Inflation in Steel & Rare-Earth Components
For complete list of drivers and restraints, kindly check the Table Of Contents.
Segment Analysis
Wind energy accounted for 82.60% of the European offshore energy market size in 2025 and is pacing a 21.34% CAGR through 2031, far outstripping tidal and wave pilots that remain pre-commercial. Despite recent input inflation, its installed base benefits from two decades of learning curves, bankable performance histories, and fully amortised supply chains that drive down per-unit costs. The wider policy ecosystem anchors its lead: North Sea states align seabed grants with dedicated grid build-outs, while developers secure CfDs at sub-40 EUR/MWh prices that keep merchant exposure low. Though technically promising in Atlantic gateways, tidal and wave technology still confront higher levelized costs and limited OEM competition; demonstration units such as Magallanes Renovables' floating tidal platform post 45% capacity factors but lack the multi-sourcing that de-risks procurement. Ocean Thermal Energy Conversion projects remain confined to warmer equatorial waters, leaving European waters outside their economically viable envelope. Consequently, the European offshore energy market continues to channel the vast majority of capital toward wind build-outs, cementing its prominence through 2031.
The spread of technology also reveals an accelerating pivot to floating sub-segments within wind. Spain, France, and Portugal are aligning industrial roadmaps with floating prototypes that marry serial hull fabrication techniques to modular topside assemblies, aiming at sub-100 EUR/MWh price points by mid-decade. These cost curves rely on standardised anchor systems and lightweight composite blades that mitigate port draft constraints. Wave and tidal advocates nonetheless draw policy attention for grid-balancing attributes: multiple governments now include technology-neutral innovation pots in auction designs, offering floor revenues that could lift niche renewables to 5% market share after 2030. Until then, wind remains the default investment choice, supported by mature O&M contracting structures and insurance products that protect lenders from weather-related downtime.
Complete Report Scope:
- By Technology
- Wind Energy
- Tidal and Wave Energy
- Ocean Thermal Energy Conversion (OTEC)
- Other Technologies
- By Water Depth
- 0 to 30 m (Shallow)
- 30 to 60 m (Transitional)
- Above 60 m (Deep-water)
- By Installation Type (Qualitative analysis only)
- Fixed Foundation (includes Monopile, Jacket, Gravity-based)
- Floating Platform (Semi-submersible, Spar-Buoy, Tension-Leg Platform)
- By Component (Qualitative analysis only)
- Turbine
- Substructure and Foundation
- Electrical Infrastructure
- Sub-sea Cables
- Mooring and Anchoring Systems
- Control and Monitoring
- By Capacity Rating (Turbine Output)
- Up to 5 MW
- 5 to 10 MW
- 10 to 15 MW
- Above 15 MW
- By Geography
- United Kingdom
- Germany
- Netherlands
- Denmark
- Norway
- France
- Belgium
- Sweden
- Ireland
- Rest of Europe
List of Companies Covered in this Report:
- Siemens Gamesa Renewable Energy SA
- Vestas Wind Systems AS
- GE Vernova (GE Renewable Energy)
- Nordex SE
- HydroQuest
- MHI Vestas Offshore Wind
- Hitachi Energy
- Orsted AS
- SSE Renewables
- Equinor ASA
- Iberdrola SA
- RWE Renewables GmbH
- EDF Renewables
- E.ON SE
- Copenhagen Infrastructure Partners
- Ocean Winds (EDP x Engie)
- TotalEnergies Renewables
- Shell New Energies
- Statkraft AS
- Northland Power Inc.
Additional Benefits:
- The market estimate (ME) sheet in Excel format
- 3 months of analyst support
TABLE OF CONTENTS
1 Introduction
- 1.1 Study Assumptions & Market Definition
- 1.2 Scope of the Study
2 Research Methodology
3 Executive Summary
4 Market Landscape
- 4.1 Market Overview
- 4.2 Offshore Energy Installed Capacity Analysis & Forecast (GW)
- 4.3 Market Drivers
- 4.3.1 EU Green Deal-Driven Capacity Targets & National Offshore Auctions
- 4.3.2 Rapid Cost Declines in Above 15 MW Turbines Enabling Deep-Water Projects
- 4.3.3 Oil & Gas Platform Electrification & Decarbonisation Mandates
- 4.3.4 Green Hydrogen (Power-to-X) Demand for Offshore Wind Integration
- 4.3.5 Offshore Grid Interconnection & OFTO/HVDC Tender Pipeline
- 4.3.6 Commercialisation of Floating Wind Unlocking Atlantic & Med Sites
- 4.4 Market Restraints
- 4.4.1 Limited Heavy-Lift Vessel Availability for Next-Gen Turbines
- 4.4.2 Lengthy Permitting & Coastal Visual-Impact Opposition
- 4.4.3 Supply-Chain Inflation in Steel & Rare-Earth Components
- 4.4.4 Offshore Grid Congestion & Limited On-shore Landing Points
- 4.5 Supply-Chain Analysis
- 4.6 Regulatory Landscape
- 4.7 Technological Outlook
- 4.8 Porter's Five Forces Analysis
- 4.8.1 Bargaining Power of Suppliers
- 4.8.2 Bargaining Power of Buyers
- 4.8.3 Threat of New Entrants
- 4.8.4 Threat of Substitutes
- 4.8.5 Intensity of Competitive Rivalry
5 Market Size & Growth Forecasts
- 5.1 By Technology
- 5.1.1 Wind Energy
- 5.1.2 Tidal and Wave Energy
- 5.1.3 Ocean Thermal Energy Conversion (OTEC)
- 5.1.4 Other Technologies
- 5.2 By Water Depth
- 5.2.1 0 to 30 m (Shallow)
- 5.2.2 30 to 60 m (Transitional)
- 5.2.3 Above 60 m (Deep-water)
- 5.3 By Installation Type (Qualitative analysis only)
- 5.3.1 Fixed Foundation (includes Monopile, Jacket, Gravity-based)
- 5.3.2 Floating Platform (Semi-submersible, Spar-Buoy, Tension-Leg Platform)
- 5.4 By Component (Qualitative analysis only)
- 5.4.1 Turbine
- 5.4.2 Substructure and Foundation
- 5.4.3 Electrical Infrastructure
- 5.4.4 Sub-sea Cables
- 5.4.5 Mooring and Anchoring Systems
- 5.4.6 Control and Monitoring
- 5.5 By Capacity Rating (Turbine Output)
- 5.5.1 Up to 5 MW
- 5.5.2 5 to 10 MW
- 5.5.3 10 to 15 MW
- 5.5.4 Above 15 MW
- 5.6 By Geography
- 5.6.1 United Kingdom
- 5.6.2 Germany
- 5.6.3 Netherlands
- 5.6.4 Denmark
- 5.6.5 Norway
- 5.6.6 France
- 5.6.7 Belgium
- 5.6.8 Sweden
- 5.6.9 Ireland
- 5.6.10 Rest of Europe
6 Competitive Landscape
- 6.1 Market Concentration
- 6.2 Strategic Moves (M&A, Partnerships, PPAs)
- 6.3 Market Share Analysis (Market Rank/Share for key companies)
- 6.4 Company Profiles (includes Global level Overview, Market level overview, Core Segments, Financials as available, Strategic Information, Products & Services, and Recent Developments)
- 6.4.1 Siemens Gamesa Renewable Energy SA
- 6.4.2 Vestas Wind Systems AS
- 6.4.3 GE Vernova (GE Renewable Energy)
- 6.4.4 Nordex SE
- 6.4.5 HydroQuest
- 6.4.6 MHI Vestas Offshore Wind
- 6.4.7 Hitachi Energy
- 6.4.8 Orsted AS
- 6.4.9 SSE Renewables
- 6.4.10 Equinor ASA
- 6.4.11 Iberdrola SA
- 6.4.12 RWE Renewables GmbH
- 6.4.13 EDF Renewables
- 6.4.14 E.ON SE
- 6.4.15 Copenhagen Infrastructure Partners
- 6.4.16 Ocean Winds (EDP x Engie)
- 6.4.17 TotalEnergies Renewables
- 6.4.18 Shell New Energies
- 6.4.19 Statkraft AS
- 6.4.20 Northland Power Inc.
7 Market Opportunities & Future Outlook
- 7.1 White-Space & Unmet-Need Assessment

 海上油氣通訊:市場佔有率分析、產業趨勢與統計、成長預測(2026-2031)
 全球海上油氣焊接市場規模、佔有率、趨勢和成長分析報告(2026-2034年)
 海上油氣鑽井鑽機市場-全球產業規模、佔有率、趨勢、機會、預測:按類型、深度、地區和競爭格局分類,2021-2031年
 2026-2030年全球海上油氣通訊市場
 海上能源市場規模、佔有率和成長分析(按能源來源、應用、儲能系統、最終用戶、公司規模和地區分類)-2026-2033年產業預測
 船舶油氣塗料市場規模、佔有率及成長分析(依應用、樹脂類型、固化機制、功能、表面處理及地區分類)-2026-2033年產業預測
 海上石油通訊市場規模、佔有率和成長分析(按解決方案、網路技術和地區分類)—產業預測(2026-2033 年)
 海上模組:全球市場佔有率和排名、總銷售額和需求預測(2025-2031 年)
 全球海上石油和天然氣焊接市場
 2024-2028年全球海上石油油氣地震探勘與採集設備市場