


 |
市場調查報告書
商品編碼
2116786
汽車影像:市場佔有率分析、產業趨勢與統計、成長預測(2026-2031)Automotive Imaging - Market Share Analysis, Industry Trends & Statistics, Growth Forecasts (2026 - 2031) |
||||||

※ 本網頁內容可能與最新版本有所差異。詳細情況請與我們聯繫。
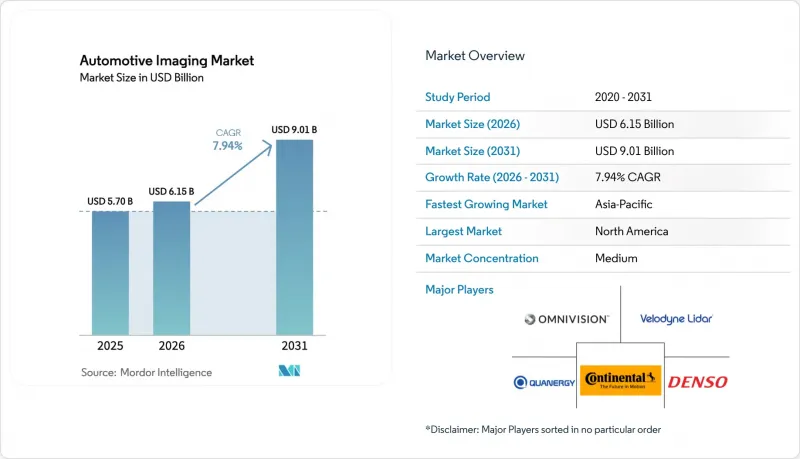
預計汽車成像市場將從 2025 年的 57 億美元成長到 2026 年的 61.5 億美元,然後在 2031 年達到 90.1 億美元,2026 年至 2031 年的複合年成長率為 7.94%。
本報告按產品類型(CMOS影像感測器、相機模組等)、車輛類型(乘用車、輕型商用車等)、自動化等級(SAE L0-L1、SAE L2等)、應用(後視、360度環景等)、成像技術(2D CMOS、3D ToF/結構光等)和地區進行細分。市場預測以美元(USD)計價。
全球汽車影像市場趨勢與洞察
NCAP加強了其強制性多攝影機安裝要求。
隨著NCAP法規的不斷完善,為了獲得更高的安全評級,需要更廣泛的攝影機覆蓋。美國國家公路交通安全管理局(NHTSA)已決定強制所有輕型車輛在2029年9月前安裝自動緊急煞車系統(AEB),這將迫使汽車製造商增加用於行人偵測的前、側、後成像單元。歐洲NCAP的2026年標準加強了對弱勢道路使用者的評估,並建議採用能夠在各種光照條件下工作的高動態範圍(HDR)感測器。中國NCAP的2024年標準引進了類似的攝影機多攝影機標準,並更加強調夜視功能,進一步提升了對熱成像技術的需求。這些標準的結合正在將多攝影機陣列從單純的高階選項轉變為一項基本的安全基礎設施。隨著OEM廠商在未來車型的所有級別中逐步採用4-6個攝影機的標準配置,提供AEC-Q認證的800萬像素感測器的供應商預計將從中受益匪淺。
將堆疊式 SPAD ToF 感測器的成本降低到 50 美元以下。
SONY的IMX479堆疊式SPAD深度感測器就是一個典型的例子,它展現了規模化生產如何將固態雷射雷達的成本降至50美元以下,使得即使是中檔車型也能具備深度感知能力。 SPAD陣列在300公尺測量距離下的光子偵測效率現已達到37%,且無需機械掃描即可滿足ISO 26262冗餘標準。汽車製造商正利用這項成本轉折點部署混合攝影機-雷射雷達系統,以降低特殊情況下的故障風險並提升自動緊急煞車性能。產業分析師預測,基於SPAD的飛行時間(ToF)技術在全球新車專案中的應用比例將從2024年的少於5%成長到2027年的40%以上,證實了成本轉折點是汽車成像市場的主要成長要素。
引擎室在 120 度C溫度控管的持續性問題。
安裝在散熱器和排氣歧管附近的攝影機會暴露在-40 度C至+125 度C的溫度波動範圍內,導致錯位和元件加速劣化。三星馬達正在開發採用鏡頭加熱和防水塗層的耐候模組,但這些措施會增加元件成本。意法半導體的VG6640感測器將動作溫度擴展至+125 度C ,但長時間暴露在高溫下仍會降低其訊號雜訊比。因此,熱應力限制了前置攝影機的靈活安裝位置,限制了其在某些細分市場的應用,並減緩了汽車成像市場的成長。
細分市場分析
預計到2025年,CMOS影像感測器將佔汽車成像市場38.10%的銷售額,成為汽車成像市場的主要驅動力。這是因為幾乎每輛車都將至少使用一個基於CMOS的攝影機。憑藉其堆疊式感測器藍圖和穩定的晶圓供應契約,SONY的目標是到2026會計年度將其汽車市場佔有率提升至43% 。影格速率和HDR等級的提升將使單一800萬像素模組能夠取代多個VGA單元,從而在減輕組件重量的同時提升內容價值。此外,該領域還受益於成本最佳化的晶圓堆疊技術以及整合的AI ISP模組,從而縮短了一級模組的開發週期。
相較之下,儘管固態雷射雷達在2025年的收入規模仍然不大,但預計將成為汽車成像市場所有產品類型中成長最快的,到2031年複合年成長率將達到28.15%。像Luminar這樣的供應商透過單代產品實現了性能提升四倍、成本降低50%,並縮小了外殼尺寸以適應擋風玻璃的遮光區域。原始設備製造商(OEM)正在將LiDAR與現有攝影機系統整合,以提高NCAP碰撞測試評級並實現先進的免持功能,從而加速其在普通市場的普及。 CMOS出貨量的成長和LiDAR的快速發展正在推動視覺處理器、飛行時間(ToF)感測器和相機模組組件等相關領域向上游價值鏈發展。
到2025年,乘用車將佔汽車成像市場需求的62.40%。這主要是由於全球自動緊急煞車(AEB)法規強制要求安裝後視和前視攝影機。目前,典型的C級轎車配備8個成像器,而計畫在2027年進行的中期改款預計將增加到12個。隨著360度環景顯示攝影機的普及,感測器平均安裝數量將進一步增加,晶圓代工廠合作夥伴也保持較高的晶圓運轉率。
儘管無人駕駛計程車和穿梭巴士的數量目前小規模,但它們的複合年成長率高達37.25%,超過了其他任何車輛類別。車隊營運商需要配備冗餘的攝影機、LiDAR和雷達系統,包含超過50個感測器,以滿足無人駕駛運行的備用方案要求。這些參考設計展示了百萬像素熱成像感測器、4D雷達和多攝影機同步網路的有效性,這些技術未來將被應用於高階乘用車。這些技術的連鎖效應正在推動跨領域的擴充性,鞏固了汽車成像市場作為自動駕駛概念驗證受益者的市場地位。
區域分析
亞太地區預計將引領市場,到2025年將佔據全球41.60%的銷售額,並以11.1%的複合年成長率成長,這主要得益於中國雄心勃勃的電氣化目標和雷射雷達(LiDAR)的大規模應用。光是合賽一家就佔了全球LiDAR出貨量的37%,其應用範圍涵蓋無人駕駛計程車到豪華電動車。日本供應商也正在快速崛起,國內OEM廠商不斷增加其產品中整合的攝影機數量,SONY的目標是到2026年佔據全球汽車CMOS市場43%的佔有率。在韓國方面,三星馬達提供的耐候型模組有效應對了該地區獨特的炎熱氣候所帶來的挑戰。預計這些趨勢將推動全部區域對感測器晶圓、模組和人工智慧處理器的需求持續成長。
北美仍然是第二大市場,這要歸功於其早期開展的自動駕駛試驗計畫以及美國國家公路交通安全管理局 (NHTSA) 制定的明確的自動緊急煞車 (AEB) 時間表。高效能運算資源的普及和強大的軟體生態系統正在加速以攝影機為中心的高級駕駛輔助系統 (ADAS) 在乘用車和無人駕駛計程車車隊中的應用。區域供應商已確保800萬像素感測器的長期供應,從而最大限度地降低了潛在供應中斷的影響。
在歐洲,受歐洲新車安全評鑑協會(Euro NCAP)2026年評估模型的推動,市場需求依然強勁。此模型強調對行人和騎乘者的保護。德國豪華汽車品牌正採用多模態融合技術來鞏固其市場地位,加速了4D雷達和熱成像器的普及。中東和非洲地區仍在發展中,但預計未來也將遵循歐洲的法規。同時,在南美洲,隨著當地安全機構收緊碰撞避免標準,市場需求正快速成長。在所有地區,受監管的安全性能指標都增強了汽車成像市場抵禦宏觀經濟週期波動的能力。
其他好處:
- Excel格式的市場預測(ME)表
- 3個月的分析師支持
目錄
第1章:引言
- 研究假設和市場定義
- 調查範圍
第2章:調查方法
第3章執行摘要
第4章 市場狀況
- 市場概覽
- 市場促進因素
- NCAP加強了對強制安裝多攝影機設備的力度。
- 將堆疊式 SPAD ToF 感測器的成本降低到 50 美元以下。
- ADAS領域正迅速轉向800萬像素HDR影像感測器。
- 機器人計程車試點計畫正在推動採用配備 12 個或更多攝影機的架構。
- 關於OTA更新的網路安全措施的規定(UNECE R156)
- 整合人工智慧的網路服務供應商,可降低30%的延遲
- 市場限制因素
- 引擎室在 120°C 高溫下持續溫度控管的問題。
- L4相關法規的模糊性正在減緩大規模LiDAR部署的進程。
- 用於BSI像素的<2µm矽材料短缺
- 與雷達和攝影機融合智慧財產權相關的訴訟風險
- 價值供應鏈分析
- 監理情勢
- 技術展望
- 波特五力分析
第5章 市場規模與成長預測
- 依產品類型
- CMOS影像感測器
- 相機模組
- 視覺處理器/ISP
- LiDAR單元
- 雷達感測器
- 按車輛類型
- 搭乘用車
- 輕型商用車
- 大型商用車輛
- 無人計程車及接駁車
- 按自動化級別
- SAE L0~L1
- SAE L2
- SAE L2+
- SAE L3
- SAE L4+
- 透過使用
- 後視圖
- 360-Surround
- 前向ADAS
- 夜視功能和側視鏡更換
- 車內駕駛/乘客監控
- 儀錶板/事件數據
- 透過成像技術
- 2D CMOS
- 3D飛行時間/結構光
- 機械LiDAR
- 固態雷射雷達
- 四維成像雷達
- 按地區
- 北美洲
- 美國
- 加拿大
- 墨西哥
- 歐洲
- 英國
- 德國
- 法國
- 義大利
- 其他歐洲國家
- 亞太地區
- 中國
- 日本
- 印度
- 韓國
- 其他亞太國家
- 中東
- 以色列
- 沙烏地阿拉伯
- 阿拉伯聯合大公國
- 土耳其
- 其他中東國家
- 非洲
- 南非
- 埃及
- 其他非洲國家
- 南美洲
- 巴西
- 阿根廷
- 其他南美國家
- 北美洲
第6章 競爭情勢
- 市場集中度
- 策略趨勢
- 市佔率分析
- 公司簡介
- Sony Group Corporation
- ON Semiconductor Corporation
- OmniVision Technologies, Inc.
- Samsung Electronics Co., Ltd.
- Panasonic Holdings Corporation
- STMicroelectronics NV
- Robert Bosch GmbH
- Continental AG
- Aptiv plc
- ZF Friedrichshafen AG
- Valeo SE
- Magna International Inc.
- DENSO Corporation
- Veoneer Holdings Ltd.
- LG Electronics Inc.
- Luminar Technologies, Inc.
- Innoviz Technologies Ltd.
- Hesai Group
- RoboSense(Beijing)Technology Co., Ltd.
- PIXELPLUS Co., Ltd.
第7章 市場機會與未來展望
According to Mordor Intelligence, the automotive imaging market size is expected to grow from USD 5.7 billion in 2025 to USD 6.15 billion in 2026 and is forecast to reach USD 9.01 billion by 2031 at 7.94% CAGR over 2026-2031.
This report is Segmented by Product Type (CMOS Image Sensors and Camera Modules and More), Vehicle Type (Passenger Cars, Light Commercial Vehicles and More), Level of Automation (SAE L0-L1, SAE L2, and More), Application (Rear View, 360-Surround and More), Imaging Technology (2-D CMOS, 3-D ToF / Structured Light and More) and Geography. The Market Forecasts are Provided in Terms of Value (USD).
Global Automotive Imaging Market Trends and Insights
Heightened NCAP-driven Multi-camera Mandates
Evolving NCAP rules require broader camera coverage for higher safety ratings. The US National Highway Traffic Safety Administration ruled that all light vehicles must feature AEB by September 2029, pushing automakers to add forward, side and rear imaging units for pedestrian detection. Euro NCAP's 2026 protocol introduces enhanced vulnerable-road-user assessments, encouraging high-dynamic-range sensors able to operate in varied lighting. China NCAP 2024 implements similar multi-camera benchmarks with added emphasis on night-vision capability, further lifting demand for thermal imaging. Together, these standards turn multi-camera arrays into foundational safety infrastructure rather than premium options. Suppliers that deliver AEC-Q-qualified 8-Mpixel sensors stand to benefit as OEMs converge on four- to six-camera baselines for all trims of future model years.
Cost-down of Stacked SPAD ToF Sensors Below USD 50
Sony's IMX479 stacked SPAD depth sensor exemplifies how manufacturing scale drives solid-state LiDAR costs below USD 50, unlocking depth perception for mid-tier vehicles. SPAD arrays now achieve 37% photon-detection efficiency at 300 m range, meeting ISO 26262 redundancy guidelines without mechanical scanning. Automakers leverage the economic crossover to deploy hybrid camera-LiDAR bundles that mitigate corner-case failures and improve automatic emergency braking performance. Industry trackers anticipate SPAD-based ToF penetration to exceed 40% of global new-vehicle programs by 2027, compared with under 5% in 2024, confirming the cost inflection as a key growth catalyst for the automotive imaging market.
Persistent Thermal Management Issues in 120 °C Engine Bays
Cameras mounted near radiators or exhaust manifolds face temperature cycling from -40 °C to +125 °C, compromising alignment and accelerating component aging. Samsung Electro-Mechanics is readying weather-proof modules with lens heating and hydrophobic coatings, but these counter-measures inflate bill-of-materials cost. STMicroelectronics' VG6640 sensor extends operation to +125 °C, yet sustained exposure still erodes signal-to-noise margins. Thermal stress therefore hinders free placement of forward-facing cameras and limits uptake in certain vehicle segments, tempering growth for the automotive imaging market.
Other drivers and restraints analyzed in the detailed report include:
- Rapid Shift to 8-Mpixel HDR Image Sensors in ADAS
- Robotaxi Pilots Triggering >12-camera Architectures
- L4 Regulatory Ambiguity Delaying High-Volume LiDAR Take-rate
For complete list of drivers and restraints, kindly check the Table Of Contents.
Segment Analysis
CMOS image sensors accounted for 38.10% of 2025 revenue and set the cadence for the automotive imaging market size because nearly every vehicle grade depends on at least one CMOS-based camera. Sony aims to lift its automotive share to 43% by fiscal 2026 on the strength of stacked-sensor roadmaps and stable wafer supply contracts. Increasing frame rates and HDR levels allow a single 8-Mpixel module to replace multiple VGA units, cutting harness weight while raising content value. The segment also benefits from cost-optimized wafer stacking that integrates AI ISP blocks, shortening development cycles for Tier 1 modules.
Solid-state LiDAR, in contrast, contributed a modest revenue base in 2025 but demonstrates a 28.15% CAGR through 2031, the fastest across product categories in the automotive imaging market. Vendors such as Luminar deliver 4-fold performance gains and 50% cost reductions in one product turn, shrinking housing dimensions to fit behind windshield blackouts. Mass-market adoption accelerates when OEMs pair LiDAR with existing camera suites for higher NCAP ratings, unlocking advanced hands-free features. The combination of volume CMOS shipments and high-growth LiDAR pulls supporting segments-vision processors, ToF sensors and camera-module assemblies-up the value chain.
Passenger cars generated 62.40% of automotive imaging market demand in 2025, anchored by global AEB mandates that compel inclusion of rear-view and forward-facing cameras. Typical C-segment sedans now ship with eight imagers; mid-cycle refreshes slated for 2027 already blueprint for twelve. Rising trim penetration for 360-degree surround-view cameras further elevates average sensor counts, sustaining high wafer utilization at foundry partners.
Robotaxis and shuttles, albeit smaller in unit terms, carry a 37.25% CAGR that outpaces every other vehicle category. Fleet operators insist on redundant camera-LiDAR-radar stacks exceeding 50 sensors to meet no-driver fallback requirements. These reference designs validate megapixel-grade thermal imagers, 4-D radar and multi-camera synchronization networks that later flow into premium passenger vehicles. The technology spillover feeds cross-segment scalability, cementing the automotive imaging market as a beneficiary of autonomous mobility trials.
Complete Report Scope:
- By Product Type
- CMOS Image Sensors
- Camera Modules
- Vision Processors / ISP
- LiDAR Units
- Radar Sensors
- By Vehicle Type
- Passenger Cars
- Light Commercial Vehicles
- Heavy Commercial Vehicles
- Robotaxis and Shuttles
- By Level of Automation
- SAE L0-L1
- SAE L2
- SAE L2+
- SAE L3
- SAE L4+
- By Application
- Rear View
- 360-Surround
- Forward ADAS
- Night-Vision & Side-Mirror Replacement
- In-Cabin Driver/Occupant Monitoring
- Dashboard / Event Data
- By Imaging Technology
- 2-D CMOS
- 3-D ToF / Structured Light
- Mechanical LiDAR
- Solid-State LiDAR
- 4-D Imaging Radar
- By Geography
- North America
- United States
- Canada
- Mexico
- Europe
- United Kingdom
- Germany
- France
- Italy
- Rest of Europe
- Asia-Pacific
- China
- Japan
- India
- South Korea
- Rest of Asia-Pacific
- Middle East
- Israel
- Saudi Arabia
- United Arab Emirates
- Turkey
- Rest of Middle East
- Africa
- South Africa
- Egypt
- Rest of Africa
- South America
- Brazil
- Argentina
- Rest of South America
- North America
Geography Analysis
Asia-Pacific led with 41.60% of 2025 revenue and an 11.1% CAGR outlook, anchored by China's aggressive electrification targets and LiDAR scale. Hesai alone captured 37% global LiDAR shipments, extending from robotaxis into premium EVs. Japanese suppliers add momentum; Sony seeks 43% of global automotive CMOS share by 2026 as domestic OEMs expand camera counts. South Korea contributes through Samsung Electro-Mechanics' weather-proof modules, mitigating regional hot-climate challenges. These developments ensure a continuous pull for sensor wafers, modules and AI processors throughout the region.
North America remains the second-largest market due to early autonomous pilot programs and firm NHTSA timelines for AEB deployment. High-power compute availability and a robust software ecosystem accelerate the adoption of camera-centric ADAS across both passenger cars and robotaxi fleets. Regional suppliers secure long-term allocation of 8-Mpixel sensors, minimizing exposure to potential supply disruptions.
Europe sustains strong demand, propelled by Euro NCAP's 2026 scoring model that weights pedestrian and cyclist protection heavily. German premium brands incorporate multi-modal sensor fusion to defend market positioning, fostering uptake of 4-D radar and thermal imagers. Middle East and Africa, although nascent, mimic European regulation over time, while South America catches up as local safety agencies tighten crash-avoidance criteria. Across all territories, regulated safety performance underpins the automotive imaging market's resilience to macroeconomic cycles.
- Sony Group Corporation
- ON Semiconductor Corporation
- OmniVision Technologies, Inc.
- Samsung Electronics Co., Ltd.
- Panasonic Holdings Corporation
- STMicroelectronics N.V.
- Robert Bosch GmbH
- Continental AG
- Aptiv plc
- ZF Friedrichshafen AG
- Valeo SE
- Magna International Inc.
- DENSO Corporation
- Veoneer Holdings Ltd.
- LG Electronics Inc.
- Luminar Technologies, Inc.
- Innoviz Technologies Ltd.
- Hesai Group
- RoboSense (Beijing) Technology Co., Ltd.
- PIXELPLUS Co., Ltd.
Additional Benefits:
- The market estimate (ME) sheet in Excel format
- 3 months of analyst support
TABLE OF CONTENTS
1 INTRODUCTION
- 1.1 Study Assumptions & Market Definition
- 1.2 Scope of the Study
2 RESEARCH METHODOLOGY
3 EXECUTIVE SUMMARY
4 MARKET LANDSCAPE
- 4.1 Market Overview
- 4.2 Market Drivers
- 4.2.1 Heightened NCAP-driven multi-camera mandates
- 4.2.2 Cost-down of stacked SPAD ToF sensors below US$50
- 4.2.3 Rapid shift to 8-Mpixel HDR image sensors in ADAS
- 4.2.4 Robotaxi pilots triggering >12-camera architectures
- 4.2.5 Cyber-secure OTA update regulations (UNECE R156)
- 4.2.6 Integrated AI ISP reducing latency by 30%
- 4.3 Market Restraints
- 4.3.1 Persistent thermal management issues in 120 °C engine bays
- 4.3.2 L4 regulatory ambiguity delaying high-volume LiDAR take-rate
- 4.3.3 Silicon supply crunch for BSI pixels <2 µm
- 4.3.4 Radar-camera fusion IP litigation risk
- 4.4 Value / Supply-Chain Analysis
- 4.5 Regulatory Landscape
- 4.6 Technological Outlook
- 4.7 Porter's Five Forces Analysis
- 4.7.1 Threat of New Entrants
- 4.7.2 Bargaining Power of Buyers
- 4.7.3 Bargaining Power of Suppliers
- 4.7.4 Threat of Substitutes
- 4.7.5 Intensity of Competitive Rivalry
5 MARKET SIZE AND GROWTH FORECASTS (VALUE)
- 5.1 By Product Type
- 5.1.1 CMOS Image Sensors
- 5.1.2 Camera Modules
- 5.1.3 Vision Processors / ISP
- 5.1.4 LiDAR Units
- 5.1.5 Radar Sensors
- 5.2 By Vehicle Type
- 5.2.1 Passenger Cars
- 5.2.2 Light Commercial Vehicles
- 5.2.3 Heavy Commercial Vehicles
- 5.2.4 Robotaxis and Shuttles
- 5.3 By Level of Automation
- 5.3.1 SAE L0-L1
- 5.3.2 SAE L2
- 5.3.3 SAE L2+
- 5.3.4 SAE L3
- 5.3.5 SAE L4+
- 5.4 By Application
- 5.4.1 Rear View
- 5.4.2 360-Surround
- 5.4.3 Forward ADAS
- 5.4.4 Night-Vision & Side-Mirror Replacement
- 5.4.5 In-Cabin Driver/Occupant Monitoring
- 5.4.6 Dashboard / Event Data
- 5.5 By Imaging Technology
- 5.5.1 2-D CMOS
- 5.5.2 3-D ToF / Structured Light
- 5.5.3 Mechanical LiDAR
- 5.5.4 Solid-State LiDAR
- 5.5.5 4-D Imaging Radar
- 5.6 By Geography
- 5.6.1 North America
- 5.6.1.1 United States
- 5.6.1.2 Canada
- 5.6.1.3 Mexico
- 5.6.2 Europe
- 5.6.2.1 United Kingdom
- 5.6.2.2 Germany
- 5.6.2.3 France
- 5.6.2.4 Italy
- 5.6.2.5 Rest of Europe
- 5.6.3 Asia-Pacific
- 5.6.3.1 China
- 5.6.3.2 Japan
- 5.6.3.3 India
- 5.6.3.4 South Korea
- 5.6.3.5 Rest of Asia-Pacific
- 5.6.4 Middle East
- 5.6.4.1 Israel
- 5.6.4.2 Saudi Arabia
- 5.6.4.3 United Arab Emirates
- 5.6.4.4 Turkey
- 5.6.4.5 Rest of Middle East
- 5.6.5 Africa
- 5.6.5.1 South Africa
- 5.6.5.2 Egypt
- 5.6.5.3 Rest of Africa
- 5.6.6 South America
- 5.6.6.1 Brazil
- 5.6.6.2 Argentina
- 5.6.6.3 Rest of South America
- 5.6.1 North America
6 COMPETITIVE LANDSCAPE
- 6.1 Market Concentration
- 6.2 Strategic Moves
- 6.3 Market Share Analysis
- 6.4 Company Profiles (includes Global level Overview, Market level overview, Core Segments, Financials as available, Strategic Information, Market Rank/Share for key companies, Products & Services, and Recent Developments)
- 6.4.1 Sony Group Corporation
- 6.4.2 ON Semiconductor Corporation
- 6.4.3 OmniVision Technologies, Inc.
- 6.4.4 Samsung Electronics Co., Ltd.
- 6.4.5 Panasonic Holdings Corporation
- 6.4.6 STMicroelectronics N.V.
- 6.4.7 Robert Bosch GmbH
- 6.4.8 Continental AG
- 6.4.9 Aptiv plc
- 6.4.10 ZF Friedrichshafen AG
- 6.4.11 Valeo SE
- 6.4.12 Magna International Inc.
- 6.4.13 DENSO Corporation
- 6.4.14 Veoneer Holdings Ltd.
- 6.4.15 LG Electronics Inc.
- 6.4.16 Luminar Technologies, Inc.
- 6.4.17 Innoviz Technologies Ltd.
- 6.4.18 Hesai Group
- 6.4.19 RoboSense (Beijing) Technology Co., Ltd.
- 6.4.20 PIXELPLUS Co., Ltd.
7 MARKET OPPORTUNITIES AND FUTURE OUTLOOK
- 7.1 White-Space and Unmet-Need Assessment

 2026年全球汽車4D成像雷達市場報告2026年全球4D成像雷達市場報告
 全球汽車4D成像雷達市場:依頻寬、偵測範圍、應用、車輛類型、國家及地區分類-產業分析、市場規模、佔有率及2025年至2032年未來預測
 4D成像雷達市場-全球產業規模、佔有率、趨勢、機會及預測(按應用、技術、範圍、地區和競爭格局分類,2021-2031年)
 汽車影像市場規模、佔有率和成長分析(按產品類型、車輛類型、自動駕駛等級、應用、成像技術和地區分類)-2026-2033年產業預測
 4D成像雷達市場規模、佔有率和趨勢分析報告:按類型、應用、地區和細分市場預測(2026-2033年)
 汽車4D雷達產業(2025)
 自規則系統成像雷達的專利形勢的分析(2025年)
 汽車影像感測器市場 - 預測 2025-2030
 全球4D成像雷達市場