


 |
市場調查報告書
商品編碼
2116784
廢棄物處理設備:市場佔有率分析、產業趨勢與統計資料、成長預測(2026-2031 年)Waste Disposal Equipment - Market Share Analysis, Industry Trends & Statistics, Growth Forecasts (2026 - 2031) |
||||||

※ 本網頁內容可能與最新版本有所差異。詳細情況請與我們聯繫。
據 Mordor Intelligence 稱,全球廢棄物處理設備市場預計到 2026 年價值 47 億美元,高於 2025 年的 44.6 億美元,預計到 2031 年將達到 60.8 億美元。
預計從 2026 年到 2031 年,年複合成長率將達到 5.30%。
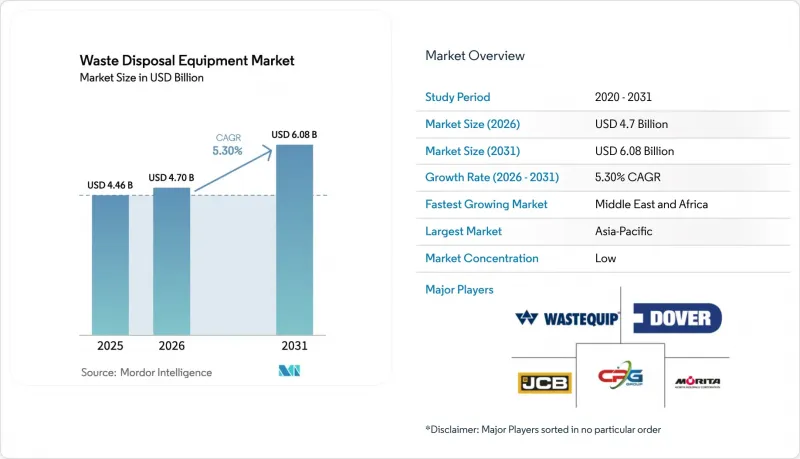
本報告根據設備類型(例如,廢棄物回收設備)、廢棄物類型(例如,危險廢棄物)、最終用戶(例如,工業設施)、運作模式(例如,固定式設備)、自動化程度(例如,手動)和地區(例如,亞洲)進行細分。報告針對以上所有細分市場,均提供了市場規模和預測數據(以美元計)。
全球廢棄物處理設備市場趨勢及洞察
人工智慧光學分類機的應用正在加速。
人工智慧驅動的光學分類機如今已能實現99%的物料辨識準確率,提高了金屬和木材的回收率,同時降低了大規模資源回收設施的營運成本。七年的成本比較顯示,一座自動化工廠的總成本為1,400萬美元,而同等規模的人工分選廠則需要2,360萬美元,這意味著在整個生命週期內成本降低了40.6%。除了這些經濟效益之外,人手不足的緩解和純度標準的提高也加速了這項技術在勞動力成本高昂的歐洲市場的應用,而這一趨勢正在向北美和亞洲的先進地區蔓延。
禁令後促進電子廢棄物回收
受區域內禁止進口電子廢棄物以及國內每年產生290萬噸廢棄設備的推動,亞太地區各國政府正大力提升本地電子垃圾處理能力。根據《全球電子垃圾監測報告》顯示,未經處理的廢棄電子垃圾蘊藏著價值620億美元的可回收資源。對能夠安全回收鋰電池的切碎機機、淨化生產線和機器人拆解設備的投資正在增加,加速了全部區域專業設備的普及應用。
機器人揀選設備的投資回收期很長。
在小規模的工廠中,由於加工量和資本預算有限,引入多機器人系統難以實現,導致損益平衡點可能需要五年以上。雖然資金籌措計畫和「設備即服務」模式正在逐步消除這一障礙,但發展中地區的普及速度仍然緩慢。
細分市場分析
到2025年,廢棄物回收設備將佔全球廢棄物設備市場的35.40%。製造商正在整合近紅外線感測器、機器學習和機器人技術,以提高垃圾純度並降低人事費用。隨著各設施追求更高的資源回收率並實現低價值任務的自動化,人工智慧驅動的系統預計將以11.9%的複合年成長率成長,超越傳統的篩分和磁選生產線。老牌製造商正在對現有分類機進行光學檢測套件的改造,以維護其現有基本客群,而一些專注於此領域的新創公司則在向小規模的市政機構推廣模組化拖車式設備。
垃圾收集和運輸車輛向電氣化轉型反映了更廣泛的脫碳趨勢。電池組、電動動力輸出裝置和再生煞車系統如今已成為新型垃圾車競標的標準配備。配套的智慧型設備、料位感測器、路線最佳化軟體和壓縮機壓力監測器將數位化監測範圍擴展到了進料車廂之外。早期採用者表示,透過預防性維護和更清晰的物料流數據,他們節省了成本,這有助於實現全球廢棄物管理設備市場的循環經濟目標。
儘管2025年非危險廢棄物的銷售額佔比為69.80%,但危險廢棄物處理解決方案預計將實現最快成長,到2031年複合年成長率將達到7.7%。對醫療、化學和廢棄物的廢棄物日益嚴格,廢棄物了對密封式切碎機、負壓進料系統和熱處理設備的需求。隨著鋰電池回收廠和溶劑回收線的投入運作,全球廢棄物廢棄物處理設備市場預計將進一步擴大。
目前電子廢棄物的正規回收率僅22.3%,凸顯了其巨大的商業潛力。機器人淨化站能夠提取純度高達98%的電池和電容器,從而降低安全風險並回收高價值金屬。此外,政府也積極推廣行動破碎機和基於密度的自動化分類機,用於處理建築和拆除廢棄物,從而實現混凝土和金屬的回收再利用。
區域分析
到2025年,亞太地區將佔全球廢棄物管理設備市場收入的46.50%。中國和印度憑藉著不斷成長的城市人口和活性化的工業活動,鞏固了其主導地位,推動了對物料回收設施(MRF)網路、源頭分類收集和電子廢棄物拆解的投資。政府補貼和技術合作正在促進人工智慧分類機和鋰電池回收生產線的應用,該地區的廢棄物管理設備市場正以高於平均的速度成長。
中東和非洲地區呈現最強勁的成長勢頭,預計到2031年複合年成長率將達到6.95%。該地區預計2024年將產生1.25億噸城市廢棄物,明年將達到2.44億噸。儘管回收率僅為4%,但可回收物含量高達80-90%,顯示存在巨大的潛在需求。東非各國於2025年通過了一項十點行動計劃,旨在加強其電子廢棄物基礎設施,並透過促進資本流入和技術轉讓,擴大非洲在全球廢棄物管理設備市場的佔有率。
歐洲透過嚴格的指令,在減少廢棄物掩埋、生產者責任制和碳中和方面保持著堅定立場。掩埋稅和循環經濟政策方案為維修壓實機、打包機和收集點的項目提供了資金。斯堪地那維亞在引進高密度壓平機和電動垃圾車方面領先,其性能標準正在整個歐洲大陸推廣。
在北美,儘管基礎設施評級僅為“C+”,表明資產更新速度緩慢,但基礎設施現代化仍在穩步推進。聯邦政府的零排放車輛目標和不斷擴大的生產者延伸責任制(EPR)法規,正在推動電動車隊和智慧物料回收設施(MRF)升級的投資。在中東地區,以海灣合作理事會(GCC)國家為首,石油收入正被投資於垃圾焚化發電發電廠、自動化分類和先進堆肥技術,從而在全球廢棄物管理設備市場中開闢出一個顯著的細分市場。
其他好處:
- Excel格式的市場預測(ME)表
- 3個月的分析師支持
目錄
第1章:引言
- 研究假設和市場定義
- 調查範圍
第2章:調查方法
第3章執行摘要
第4章 市場狀況
- 市場概覽
- 市場促進因素
- 歐洲加速部署配備人工智慧的光學分類機
- 北美地區向電動垃圾收集車過渡
- 禁令後促進全部區域電子廢棄物回收的措施
- 南亞大都會圈的強制性源頭分離法
- 全部區域掩埋稅法規的加強正在提振對壓縮機的需求。
- 在拉丁美洲,擴大生產者責任(EPR)基金正在推動打包機的更換。
- 市場限制因素
- 中型物料回收設施中機器人揀選系統的投資回收期較長。
- 由於半導體短缺,PLC的前置作業時間越來越長。
- 非洲各地地方政府採購流程的片段化
- 鋰電池破碎設備需要昂貴的歐盟電池安全認證
- 價值供應鏈分析
- 監理展望
- 技術展望
- 波特五力模型
- 廢棄物處理設備的區域分析
第5章 市場規模與成長預測
- 依設備類型
- 廢棄物分類裝置
- 機械分類系統
- 基於光學/人工智慧的分類系統
- 機器人揀選系統
- 廢棄物回收設施
- 切碎機
- 打包機和壓實機
- 破碎機/研磨機
- 輸送和分類系統
- 廢棄物收集和運輸車輛
- 垃圾車
- 鉤臂式堆高機和翻斗式裝載機
- 自動真空收集系統
- 廢棄物掩埋和處理設施
- 掩埋壓實機和推土機
- 焚燒爐及熱處理設備
- 堆肥和厭氧消化系統
- 輔助設備和智慧監控設備
- 智慧料倉和料位感測器
- 軟體和數位平台
- 廢棄物分類裝置
- 廢棄物類型
- 一般廢棄物
- 工業廢棄物(無害)
- 危險廢棄物
- 醫療廢棄物和生物危害廢棄物
- 電子廢棄物(電子廢棄物)
- 建築和拆除垃圾
- 最終用戶
- 地方政府
- 廢棄物管理服務提供者
- 工業設施
- 商業設施
- 住宅部門
- 透過操作模式
- 固定設備
- 行動/可攜式設備
- 按自動化級別
- 手動的
- 半自動
- 全自動/智慧
- 透過電源
- 柴油引擎
- 電的
- 混合
- 液壓/動力輸出軸驅動
- 按地區
- 北美洲
- 美國
- 加拿大
- 墨西哥
- 南美洲
- 巴西
- 阿根廷
- 哥倫比亞
- 其他南美國家
- 歐洲
- 德國
- 英國
- 法國
- 義大利
- 西班牙
- 北歐國家(丹麥、芬蘭、冰島、挪威、瑞典)
- 其他歐洲國家
- 中東和非洲
- GCC
- 以色列
- 土耳其
- 南非
- 埃及
- 其他中東和非洲國家
- 亞太地區
- 中國
- 日本
- 印度
- 韓國
- 東協(印尼、泰國、菲律賓、馬來西亞、越南)
- 澳洲和紐西蘭
- 其他亞太國家
- 北美洲
第6章 競爭情勢
- 市場集中度
- 業界領導企業的策略舉措
- 市佔率分析(主要公司)
- 公司簡介
- Wastequip
- CP Manufacturing Inc.
- Dover Corporation
- Morita Holdings Corporation
- JCB
- Caterpillar Inc.
- TOMRA Systems ASA
- Veolia Environment SA
- SUEZ Group
- Babcock & Wilcox Enterprises
- Metso Outotec
- Komptech GmbH
- Tana Oy
- McNeilus Truck and Manufacturing Inc.
- Kirchhoff Group
- Blue Group
- Sierra International Machinery
- Fujian Longma Environmental Sanitation Equipment
- Henan Winner Vibrating Equipment
- Danieli Centro Recycling
- Terex Corporation
- Covanta
- Bollegraaf Recycling Solutions
- Steinert GmbH
第7章 市場機會與未來展望
According to Mordor Intelligence, global waste disposal equipment market size in 2026 is estimated at USD 4.7 billion, growing from 2025 value of USD 4.46 billion with 2031 projections showing USD 6.08 billion, growing at 5.30% CAGR over 2026-2031.
This report is Segmented by Equipment Type (Waste Recycling Equipment and More), by Waste Type (Hazardous Waste and More), by End User (Industrial Facilities and More), by Mode of Operation (Stationary Equipment and More), by Automation Level (Manual and More), by Geography (Asia and More) and More. The Report Offers Market Size and Forecasts in Value (USD) for all the Above Segments.
Global Waste Disposal Equipment Market Trends and Insights
Accelerated Adoption of AI-enabled Optical Sorters
AI-guided optical sorters now reach 99% material-recognition accuracy, unlocking higher recovery rates for metals and wood and trimming operating budgets for large material-recovery facilities. A seven-year cost comparison shows an automated plant all-in expense of USD 14.0 million, versus USD 23.6 million for a similarly sized manual operation, translating to a 40.6% life-cycle saving.These financial gains, coupled with labor-shortage relief and tighter purity mandates, are propelling deployment across Europe's high-labor-cost markets and spilling into North America and advanced Asian hubs.
Post-ban E-waste Recycling Stimulus
Regional bans on electronic waste imports and the domestic generation of 2.9 million tons of obsolete devices have galvanized Asia-Pacific governments to expand local processing. The Global e-Waste Monitor notes USD 62 billion in recoverable resources locked in unprocessed scrap. Investment is flowing into shredders, depollution lines, and robotic dismantlers capable of safely extracting lithium batteries, encouraging faster uptake of specialized equipment across the region.
Long Payback for Robotic Pickers
Smaller facilities struggle to justify multi-robot systems where throughput is modest and capital budgets are tight, prolonging break-even horizons beyond five years. Financing programs and equipment-as-a-service models are gradually easing this barrier, but uptake remains slow in developing regions.
Other drivers and restraints analyzed in the detailed report include:
- Transition to Electric Refuse Collection Fleets
- Mandatory Source Segregation Laws
- Semiconductor Shortages
For complete list of drivers and restraints, kindly check the Table Of Contents.
Segment Analysis
Waste recycling equipment held a 35.40% revenue share of the Global waste disposal equipment market in 2025. Manufacturers are integrating near-infrared sensors, machine learning, and robotics to raise purity and reduce labor costs. AI-driven systems are projected to post a 11.9% CAGR, outpacing conventional screen-and-magnet lines as facilities chase higher commodity yields and automate low-value tasks. Traditional brands are retrofitting optical detection kits into existing sorters to protect installed bases, while specialized startups push modular, trailer-mounted units for smaller municipalities.
The electric shift in collection and transfer vehicles mirrors broader decarbonization trends; battery packs, electric PTOs, and regenerative braking are now standard in new refuse-truck tenders. Ancillary smart devices, fill-level sensors, route-optimization software, and compactor-pressure monitors extend digital oversight beyond the tipping floor. Early adopters report preventive-maintenance savings and clearer material-flow data that underpin circular economy targets inside the Global waste disposal equipment market.
Non-hazardous streams generated 69.80% of 2025 revenue, yet hazardous-waste solutions are advancing fastest at 7.7% CAGR through 2031. Regulatory focus on medical, chemical, and electronic residues boosts demand for sealed shredders, negative-pressure feeding systems, and thermal destruction units. The Global waste disposal equipment market size for hazardous-waste treatment is expected to expand as lithium-battery recovery plants and solvent-recapture lines come online.
E-waste, with only 22.3% formal recycling, underlines a widening opportunity. Robotic depollution stations now remove batteries and capacitors at 98% purity, alleviating safety risks and retrieving high-value metals. Construction-and-demolition debris also prompts investments in mobile crushers and automated density-based separators, which reclaim concrete and metals for reuse.
Complete Report Scope:
- By Equipment Type
- Waste Sorting Equipment
- Mechanical Sorting Systems
- Optical / AI-based Sorting Systems
- Robotic Picking Systems
- Waste Recycling Equipment
- Shredders
- Balers & Compactors
- Crushers & Pulverizers
- Conveying & Screening Systems
- Waste Collection & Transportation Vehicles
- Refuse Collection Trucks
- Hook-lift & Skip Loaders
- Automated Vacuum Collection Systems
- Waste Landfill & Treatment Equipment
- Landfill Compactors & Dozers
- Incinerators & Thermal Treatment Units
- Composting & Anaerobic Digestion Units
- Ancillary & Smart Monitoring Devices
- Smart Bins & Fill-level Sensors
- Software & Digital Platforms
- Waste Sorting Equipment
- By Waste Type
- Municipal Solid Waste
- Industrial Waste (Non-Hazardous)
- Hazardous Waste
- Medical & Bio-hazardous Waste
- Electronic Waste (E-waste)
- Construction & Demolition Debris
- By End-user
- Municipal Authorities
- Waste Management Service Providers
- Industrial Facilities
- Commercial Establishments
- Residential Sector
- By Mode of Operation
- Stationary Equipment
- Mobile / Portable Equipment
- By Automation Level
- Manual
- Semi-automatic
- Fully Automatic / Smart
- By Power Source
- Diesel
- Electric
- Hybrid
- Hydraulic / PTO-driven
- By Geography
- North America
- United States
- Canada
- Mexico
- South America
- Brazil
- Argentina
- Colombia
- Rest of South America
- Europe
- Germany
- United Kingdom
- France
- Italy
- Spain
- NORDICS (Denmark, Finland, Iceland, Norway, and Sweden)
- Rest of Europe
- Middle East and Africa
- GCC
- Israel
- Turkey
- South Africa
- Egypt
- Rest of Middle East and Africa
- Asia-Pacific
- China
- Japan
- India
- South Korea
- ASEAN (Indonesia, Thailand, Philippines, Malaysia, Vietnam)
- Australia & New Zealand
- Rest of Asia-Pacific
- North America
Geography Analysis
Asia-Pacific held 46.50% of the Global waste disposal equipment market revenue in 2025. China and India anchor this leadership as urban populations climb and industrial activity intensifies, fostering investments in MRF networks, source-segregated collection, and e-waste dismantling. National subsidies and technology partnerships drive AI-enabled sorters and lithium-battery recovery lines, enlarging the regional Global waste disposal equipment market size at above-average speed.
The Middle East and Africa represent the most dynamic growth trajectory at 6.95% CAGR through 2031. The continent generated 125 million tons of municipal solid waste in 2024 and faces a projected 244 million tons load next year. Recycling lags at 4%, yet an 80-90% recyclable content signals latent demand. East African economies endorsed a ten-point action plan in 2025 to boost e-waste infrastructure, encouraging capital inflows and technology transfer that widen African participation in the Global waste disposal equipment market.
Europe maintains a robust stance thanks to stringent directives on landfill diversion, producer responsibility, and carbon neutrality. Escalating landfill taxes and circular-economy policy packages fund compactor, baler, and depot refurbishment programs. Regions within Scandinavia lead adoption of high-density presses and electric refuse trucks, setting performance benchmarks that ripple across the continent.
North America continues steady equipment renewal, guided by a C+ infrastructure grade that highlights deferred asset replacement. Federal zero-emission vehicle targets and expanding extended-producer-responsibility statutes sustain investment in electrified fleets and smart MRF upgrades. The Middle East, led by GCC nations, channels oil-revenues into waste-to-energy plants, automated sorting, and advanced composting, adding a noteworthy niche within the Global waste disposal equipment market.
- Wastequip
- CP Manufacturing Inc.
- Dover Corporation
- Morita Holdings Corporation
- JCB
- Caterpillar Inc.
- TOMRA Systems ASA
- Veolia Environment S.A.
- SUEZ Group
- Babcock & Wilcox Enterprises
- Metso Outotec
- Komptech GmbH
- Tana Oy
- McNeilus Truck and Manufacturing Inc.
- Kirchhoff Group
- Blue Group
- Sierra International Machinery
- Fujian Longma Environmental Sanitation Equipment
- Henan Winner Vibrating Equipment
- Danieli Centro Recycling
- Terex Corporation
- Covanta
- Bollegraaf Recycling Solutions
- Steinert GmbH
Additional Benefits:
- The market estimate (ME) sheet in Excel format
- 3 months of analyst support
TABLE OF CONTENTS
1 Introduction
- 1.1 Study Assumptions & Market Definition
- 1.2 Scope of the Study
2 Research Methodology
3 Executive Summary
4 Market Landscape
- 4.1 Market Overview
- 4.2 Market Drivers
- 4.2.1 Accelerated adoption of AI-enabled optical sorters across Europe
- 4.2.2 Transition to electric refuse-collection fleets across North America
- 4.2.3 Post-ban e-waste recycling stimulus throughout Asia-Pacific
- 4.2.4 Mandatory source-segregation laws in South Asia's metropolitan clusters
- 4.2.5 Escalating landfill-tax regimes across the Nordic region driving compactor demand
- 4.2.6 Extended Producer Responsibility (EPR) funds boosting baler upgrades in Latin America
- 4.3 Market Restraints
- 4.3.1 Long payback for robotic pickers in midsize MRFs
- 4.3.2 Semiconductor shortages inflating PLC lead-times
- 4.3.3 Fragmented municipal procurement processes across Africa
- 4.3.4 Costly EU battery-safety certification for lithium-shredding equipment
- 4.4 Value / Supply-Chain Analysis
- 4.5 Regulatory Outlook
- 4.6 Technological Outlook
- 4.7 Porter's Five Forces
- 4.7.1 Threat of New Entrants
- 4.7.2 Bargaining Power of Buyers
- 4.7.3 Bargaining Power of Suppliers
- 4.7.4 Threat of Substitute Products
- 4.7.5 Intensity of Competitive Rivalry
- 4.8 Regional Insights on Waste Disposal Equipment
5 Market Size & Growth Forecasts (Value, In USD Billion)
- 5.1 By Equipment Type
- 5.1.1 Waste Sorting Equipment
- 5.1.1.1 Mechanical Sorting Systems
- 5.1.1.2 Optical / AI-based Sorting Systems
- 5.1.1.3 Robotic Picking Systems
- 5.1.2 Waste Recycling Equipment
- 5.1.2.1 Shredders
- 5.1.2.2 Balers & Compactors
- 5.1.2.3 Crushers & Pulverizers
- 5.1.2.4 Conveying & Screening Systems
- 5.1.3 Waste Collection & Transportation Vehicles
- 5.1.3.1 Refuse Collection Trucks
- 5.1.3.2 Hook-lift & Skip Loaders
- 5.1.3.3 Automated Vacuum Collection Systems
- 5.1.4 Waste Landfill & Treatment Equipment
- 5.1.4.1 Landfill Compactors & Dozers
- 5.1.4.2 Incinerators & Thermal Treatment Units
- 5.1.4.3 Composting & Anaerobic Digestion Units
- 5.1.5 Ancillary & Smart Monitoring Devices
- 5.1.5.1 Smart Bins & Fill-level Sensors
- 5.1.5.2 Software & Digital Platforms
- 5.1.1 Waste Sorting Equipment
- 5.2 By Waste Type
- 5.2.1 Municipal Solid Waste
- 5.2.2 Industrial Waste (Non-Hazardous)
- 5.2.3 Hazardous Waste
- 5.2.4 Medical & Bio-hazardous Waste
- 5.2.5 Electronic Waste (E-waste)
- 5.2.6 Construction & Demolition Debris
- 5.3 By End-user
- 5.3.1 Municipal Authorities
- 5.3.2 Waste Management Service Providers
- 5.3.3 Industrial Facilities
- 5.3.4 Commercial Establishments
- 5.3.5 Residential Sector
- 5.4 By Mode of Operation
- 5.4.1 Stationary Equipment
- 5.4.2 Mobile / Portable Equipment
- 5.5 By Automation Level
- 5.5.1 Manual
- 5.5.2 Semi-automatic
- 5.5.3 Fully Automatic / Smart
- 5.6 By Power Source
- 5.6.1 Diesel
- 5.6.2 Electric
- 5.6.3 Hybrid
- 5.6.4 Hydraulic / PTO-driven
- 5.7 By Geography
- 5.7.1 North America
- 5.7.1.1 United States
- 5.7.1.2 Canada
- 5.7.1.3 Mexico
- 5.7.2 South America
- 5.7.2.1 Brazil
- 5.7.2.2 Argentina
- 5.7.2.3 Colombia
- 5.7.2.4 Rest of South America
- 5.7.3 Europe
- 5.7.3.1 Germany
- 5.7.3.2 United Kingdom
- 5.7.3.3 France
- 5.7.3.4 Italy
- 5.7.3.5 Spain
- 5.7.3.6 NORDICS (Denmark, Finland, Iceland, Norway, and Sweden)
- 5.7.3.7 Rest of Europe
- 5.7.4 Middle East and Africa
- 5.7.4.1 GCC
- 5.7.4.2 Israel
- 5.7.4.3 Turkey
- 5.7.4.4 South Africa
- 5.7.4.5 Egypt
- 5.7.4.6 Rest of Middle East and Africa
- 5.7.5 Asia-Pacific
- 5.7.5.1 China
- 5.7.5.2 Japan
- 5.7.5.3 India
- 5.7.5.4 South Korea
- 5.7.5.5 ASEAN (Indonesia, Thailand, Philippines, Malaysia, Vietnam)
- 5.7.5.6 Australia & New Zealand
- 5.7.5.7 Rest of Asia-Pacific
- 5.7.1 North America
6 Competitive Landscape
- 6.1 Market Concentration
- 6.2 Strategic Moves by Key Players in the Industry
- 6.3 Market Share Analysis (Key Players)
- 6.4 Company Profiles (includes Global level Overview, Market level overview, Core Segments, Financials as available, Strategic Information, Products & Services, and Recent Developments)
- 6.4.1 Wastequip
- 6.4.2 CP Manufacturing Inc.
- 6.4.3 Dover Corporation
- 6.4.4 Morita Holdings Corporation
- 6.4.5 JCB
- 6.4.6 Caterpillar Inc.
- 6.4.7 TOMRA Systems ASA
- 6.4.8 Veolia Environment S.A.
- 6.4.9 SUEZ Group
- 6.4.10 Babcock & Wilcox Enterprises
- 6.4.11 Metso Outotec
- 6.4.12 Komptech GmbH
- 6.4.13 Tana Oy
- 6.4.14 McNeilus Truck and Manufacturing Inc.
- 6.4.15 Kirchhoff Group
- 6.4.16 Blue Group
- 6.4.17 Sierra International Machinery
- 6.4.18 Fujian Longma Environmental Sanitation Equipment
- 6.4.19 Henan Winner Vibrating Equipment
- 6.4.20 Danieli Centro Recycling
- 6.4.21 Terex Corporation
- 6.4.22 Covanta
- 6.4.23 Bollegraaf Recycling Solutions
- 6.4.24 Steinert GmbH
7 Market Opportunities & Future Outlook

 廢棄物制燃料市場:全球市場預測,2026-2032年
 廢棄物市場規模、佔有率和成長分析:按產品類型、材質、容量、最終用戶、分銷管道和地區分類-2026-2033年產業預測廢棄物管理設備市場:按設備、廢棄物類型、技術、動力來源、整合度和最終用戶分類-2026-2032年全球市場預測
 廢棄物管理設備市場-全球產業規模、佔有率、趨勢、機會、預測:按設備類型、按廢棄物類型、按應用、按地區和競爭對手分類,2021-2031年
 廢棄物管理設備市場規模、佔有率和成長分析:廢棄物設備類型和地區分類 - 2026-2033 年產業預測廚房廢棄物設備市場按產品類型、技術、安裝類型、容量、最終用戶和分銷管道分類-2026年至2032年全球預測廢棄物處理冷水機市場按產品類型、冷卻技術、電源、最終用戶和分銷管道分類-2026-2032年全球預測
 全球廢棄物燃料技術市場