


 |
市場調查報告書
商品編碼
2116549
二手施工機械:市場佔有率分析、產業趨勢與統計、成長預測(2026-2031)Used Construction Equipment - Market Share Analysis, Industry Trends & Statistics, Growth Forecasts (2026 - 2031) |
||||||

※ 本網頁內容可能與最新版本有所差異。詳細情況請與我們聯繫。
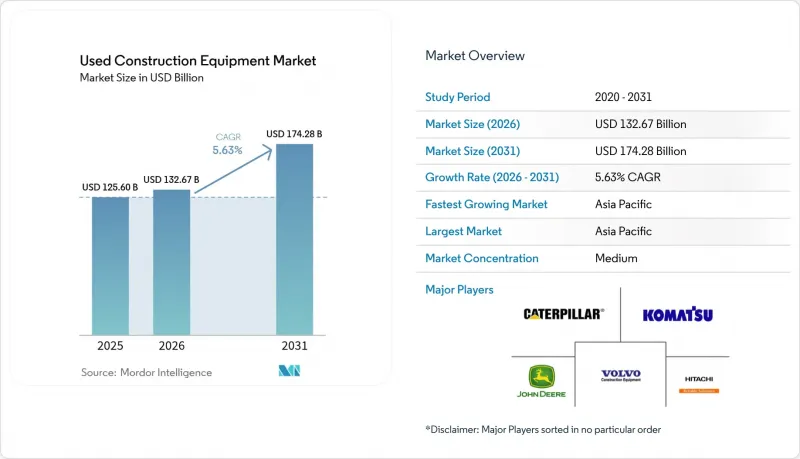
據 Mordor Intelligence 稱,2026 年二手施工機械市場規模預計為 1,326.7 億美元,高於 2025 年的 1,256 億美元,預計到 2031 年將達到 1,742.8 億美元。
預計從 2026 年到 2031 年,其複合年成長率將達到 5.63%。
本報告按產品類型(起重機、伸縮臂叉裝車等)、驅動系統(內燃機等)、終端用戶行業(建築和基礎設施、採礦和採石等)、銷售管道(經銷商/仲介、競標等)以及地區(北美、南美等)進行細分。市場預測以價值(美元)和數量(台)兩種形式呈現。
二手施工機械市場全球趨勢與洞察
供應鏈主導的車隊更新
由於原廠設備製造商 (OEM) 的交貨週期長達 12 至 18 個月,二手設備不僅被用作臨時解決方案,而且往往成為車隊的長期組成部分。目前,為了即時交付,建築商願意支付遠高於 2024 年前估值標準的溢價,尤其是在工廠產能仍然受限的專業領域。需求不再遵循傳統的經濟週期,而是受開工日期驅動,這在二手內支撐了二手施工機械市場的結構性需求。根據經銷商報告,20-30 噸挖土機和中型輪式裝載機等標準機型的交易速度最快。這是因為零件供應充足且操作人員熟悉這些設備,從而降低了部署風險。這一趨勢在北美和亞太地區尤其明顯,這些地區同時面臨大型企劃和住宅短缺的問題。因此,價格維持在高於趨勢水平,促使車隊管理人員儘早鎖定二手的運作能力,以確保未來的供應。
新興市場的基礎設施獎勵策略
到2035年,亞太地區各國政府將需要約43兆美元的資本支出,例如印度耗資1.4兆美元的「國家基礎設施管道」項目和中國的都市更新計畫。國內生產無法完全滿足短期內對標準化重型機械的需求,因此,進口使用壽命為3-5年的機械設備填補了這一缺口。日本、歐洲和北美的經銷商正擴大向印度、印尼和菲律賓出口符合標準的機械設備,預計2024年後跨境貿易將大幅成長。隨著新興市場買家能夠即時獲取全球訊息,價格差異正在縮小,迫使賣家調整要價以與國際基準接軌。各國政府通常優先考慮專案進度而非機械設備的使用年限,因此,只要符合可靠性標準,使用頻率較低的機械設備也會被接受。
二手設備價格的波動週期
季度價格波動會阻礙資金籌措和處置決策,尤其對於與大宗商品市場超級週期密切相關的礦業機械而言更是如此。在經濟衰退期間,運輸卡車和重型裝載機的價值可能在12個月內減半,但隨著金屬價格上漲而回升。設備種類有限的小規模承包商可能面臨較緊張的財務狀況,必須延後採購,直到價格波動趨於穩定。這可能導致流動性壓力和價格進一步下跌。此外,現金流難以預測也令貸款機構望而卻步,導致貸款條件收緊,而這正是發生在買家最需要資金籌措以利用折扣庫存的時候。
細分市場分析
到2025年,挖土機將佔二手施工機械市場規模的42.68%。這主要歸功於其多功能性,能夠勝任諸如平整場地、開挖溝槽和拆除等各種作業。零件的供應充足以及操作人員的熟練,減少了停機時間,從而提高了租賃車隊的採用率。該類別的高流動性吸引了機構投資者和小規模承包商,即使在季節性低迷時期也能保持活躍的交易。受城市化進程帶來的遠端起重解決方案需求成長的推動,預計到2031年,起重機市場將以6.42%的複合年成長率成長。塔式起重機和履帶式起重機的原始設備製造商(OEM)產能緊張,進一步推高了擁有完整維修記錄的最新型號的價格。這使得賣家能夠獲得高於平均水平的利潤率,而買家也能夠接受這一價格,因為在施工高峰期租賃選擇有限。附件和物料輸送設備增強了模組化柔軟性,鼓勵承包商圍繞核心承載機械和專用工具最佳化車隊,而不是依賴多種專用機械。這種模組化方法正在推動對快速連接器系統的需求,從而加快現場更換速度。
隨著安全標準的提高,人們對具備遠端資訊處理功能的機型越來越感興趣,這些機型能夠記錄運作週期和過載事件。擁有完整電子歷史記錄的機型交易速度更快,價格也更高,尤其是在監管嚴格的歐洲地區。同時,各大品牌標準化的操作佈局促進了跨機型培訓,使操作員能夠在混合車隊中重新部署,而不會影響生產效率。這項優勢鞏固了挖土機的主導地位,而起重機則憑藉其在專業起重作業領域的卓越表現,成為二手施工機械市場中成長最快的細分領域。
內燃機憑藉其無可比擬的能量密度和廣泛的柴油基礎設施,預計到2025年仍將佔據二手施工機械市場90.92%的佔有率。在預測期之後,柴油仍將是偏遠礦山和管道項目等大規模土方工程的必需品。然而,電動機械的複合年成長率(CAGR)為8.08%,並且在設有噪音限制和碳排放配額的城市地區已發揮重要作用。由於供應有限且維護成本曲線陡峭,符合法規要求的車型仍需支付20-30%的溢價。對於在排放氣體管制區域進行夜間作業的車隊營運商而言,電動機械的總營運成本更低,尤其是在當地電力公司提供離峰時段充電折扣的情況下。
混合動力系統正在逐步建立起雖小但穩定的市場佔有率,尤其是在運作週期多變的設備上,例如閒置時間較長的伸縮臂堆高機。柴油-電力驅動系統透過降低油耗和延長電池更換週期,在降低初始投資成本的同時,也降低了營運成本。然而,隨著電池價格的持續下降,這項技術的溢價正在逐漸縮小。目前,內燃機(ICE)的主導地位為二手施工機械市場提供了必要的深度和價格穩定性,但零排放區的擴大正在為逐步但不可逆轉地向電氣化轉型奠定基礎。
區域分析
預計到2025年,亞太地區將佔據二手施工機械市場47.62%的佔有率,並將在2031年之前以6.74%的複合年成長率成長。這主要得益於印度、中國和東南亞國家加速交通走廊、可再生能源和住宅領域的投資。印度的國家基礎設施規劃和中國的城市更新政策正在持續推動對施工機械的需求,導致當地原始設備製造商(OEM)產能過剩,並刺激了從日本、歐洲和北美的進口。該地區對海運物流的投資正在縮短機械運輸時間,從而實現與專案啟動計劃相符的準時交貨。
北美市場的成長得益於成熟的二手市場生態系統和美國雄厚的公共工程預算。該地區擁有最先進的原始設備製造商(OEM)回購計劃,使承包商能夠每3-4年升級一次設備,而無需承擔顯著的折舊免稅額。加拿大資源相關項目的增加推動了對林業和管道專用設備的需求,進一步促進了跨境貿易的流動性。在歐洲,交易量適中,但單價較高。這是由於嚴格的排放氣體法規推高了符合第五階段排放標準的機械設備的價格。德國和北歐國家的補貼鼓勵採用更清潔的設備,從而提高了設備的殘值。由於都市區市場的集中以及法規的早期實施,與其他地區相比,電動小型挖土機和緊湊型輪式裝載機在歐洲二手市場中所佔比例特別高。
中東和非洲已成為新的關注區域,尤其是海灣合作理事會(GCC)成員國,它們正努力在石油收入多元化和雄心勃勃的建設計畫之間尋求平衡。像沙烏地阿拉伯的NEOM這樣的大型企劃需要即時獲得機械設備,因此進口可靠的先進設備是首選。在撒哈拉以南非洲,採礦業的擴張支撐了對部分施工機械的需求,但政治風險和物流挑戰仍限制了市場的進一步擴張。南美洲的商品價格週期性波動,在價格上漲時期,巴西和智利會大量購買銅和鐵礦石;而在價格下跌時期,購買量則會減少。這不僅為全球貿易帶來了波動,也創造了套利機會。
其他好處:
- Excel格式的市場預測(ME)表
- 3個月的分析師支持
目錄
第1章:引言
- 研究假設和市場定義
- 調查範圍
第2章:調查方法
第3章執行摘要
第4章 市場狀況
- 市場概覽
- 市場促進因素
- 供應鏈主導的車輛更換
- 新興市場的基礎設施獎勵策略
- 不斷飆升的殘值推高了轉售時的投資報酬率 (ROI)。
- 都市區建築工地強制電氣化
- 競標平台的快速數位化
- 原廠回購和認證二手車計劃
- 市場限制因素
- 二手設備價格的波動週期
- 8年以上資金籌措趨緊
- 引擎改裝方面的監理不確定性
- 檢驗和品質標準的差異
- 價值供應鏈分析
- 監理情勢
- 技術展望
- 波特五力模型
第5章 市場規模與成長預測
- 依產品類型
- 起重機
- 伸縮臂堆高機
- 挖土機
- 物料輸送設備
- 裝載機和後鏟
- 配件及其他
- 透過驅動系統
- 內燃機
- 電的
- 混合
- 按最終用途行業分類
- 建築和基礎設施
- 採礦和採石
- 農業和林業
- 工業和倉儲
- 按銷售管道
- 交易商/仲介
- 競標(現場和線上)
- 租賃車輛處置
- 直接經原廠認證的二手車
- 按地區
- 北美洲
- 美國
- 加拿大
- 其他北美國家
- 南美洲
- 巴西
- 阿根廷
- 其他南美國家
- 歐洲
- 德國
- 英國
- 法國
- 俄羅斯
- 西班牙
- 義大利
- 其他歐洲國家
- 亞太地區
- 中國
- 印度
- 日本
- 韓國
- 澳洲
- 其他亞太國家
- 中東和非洲
- 阿拉伯聯合大公國
- 沙烏地阿拉伯
- 土耳其
- 埃及
- 南非
- 其他中東和非洲國家
- 北美洲
第6章 競爭情勢
- 市場集中度
- 策略趨勢
- 市佔率分析
- 公司簡介
- Caterpillar Inc.
- Komatsu Ltd.
- Deere & Company
- Volvo Construction Equipment
- Hitachi Construction Machinery Co., Ltd.
- Liebherr Group
- Kobelco Construction Machinery Co., Ltd.
- Terex Corporation
- Manitou Group
- CNH Industrial(Case CE)
- JCB
- Sany Heavy Industry Co. Ltd.
- Xuzhou Construction Machinery Group Co., Ltd.
- HD Hyundai Construction Equipment Co., Ltd.
- Bobcat Company
- Kubota Corporation
- Wirtgen Group
- Astec Industries
第7章 市場機會與未來展望
According to Mordor Intelligence, used construction equipment market size in 2026 is estimated at USD 132.67 billion, growing from 2025 value of USD 125.60 billion with 2031 projections showing USD 174.28 billion, growing at 5.63% CAGR over 2026-2031.
This report is Segmented by Product Type (Crane, Telescopic Handler, and More), Drive Type (Internal Combustion Engine, and More), End-Use Industry (Construction and Infrastructure, Mining and Quarrying, and More), Sales Channel (Dealer/Broker, Auction, and More), and Geography (North America, South America, and More). The Market Forecasts are Provided in Terms of Value (USD) and Volume (Units).
Global Used Construction Equipment Market Trends and Insights
Supply-Chain-Driven Fleet Renewals
OEM delivery times that stretch 12-18 months have turned used assets into bridge solutions that frequently become permanent parts of the fleet. Contractors now pay high premiums over pre-2024 valuation benchmarks for immediate delivery, particularly in specialty categories where factory output remains constrained. Demand no longer follows legacy economic cycles and instead hinges on construction start dates, creating a structural pull that underpins the used construction equipment market through the near term. Dealers report that standardized models such as 20- to 30-ton excavators and mid-size wheel loaders transact fastest, because parts availability and operator familiarity compress adoption risk. The dynamic is especially intense in North America and the Asia-Pacific, where mega-projects overlap with housing shortages. These conditions sustain above-trend prices and encourage fleet managers to hedge future availability by locking in secondary-market capacity early.
Infrastructure Stimulus in Emerging Markets
Asia-Pacific governments need approximately USD 43 trillion in capital spending through 2035, with India's USD 1.4 trillion National Infrastructure Pipeline and China's urban renewal plans headline examples . Domestic production cannot fully cover near-term demand for standardized equipment, so imports of 3- to 5-year-old machines fill the gap. Dealers in Japan, Europe, and North America increasingly ship compliant units to India, Indonesia, and the Philippines, creating a jump in cross-border flows since 2024. Price arbitrage narrows as buyers in emerging markets gain real-time visibility into global listings, forcing sellers to align asking prices with international benchmarks. Governments often prioritize project speed over equipment age, making lightly used machinery acceptable as long as reliability thresholds are met.
Volatile Used-Equipment Price Cycles
Quarterly swings impede financing and disposal decisions, particularly in mining-oriented equipment that tracks commodity super-cycles. In downturns, values of haul trucks and large loaders can halve within 12 months before recovering as metal prices rebound. Small contractors without diversified fleets face balance-sheet stress, sometimes delaying purchases until volatility subsides, which compresses liquidity and amplifies further price drops. Less predictable cash flows also deter lenders, tightening credit just when buyers most need financing to capitalize on discounted inventory.
Other drivers and restraints analyzed in the detailed report include:
- Soaring Residual Values Driving Resale ROI
- Electrification Mandates for Urban Job-Sites
- Financing Tightness for Above 8-Year Assets
For complete list of drivers and restraints, kindly check the Table Of Contents.
Segment Analysis
Excavators accounted for 42.68% of the used construction equipment market size in 2025, owing to their versatility across site preparation, trenching, and demolition tasks. Ready access to parts and operator familiarity reduces downtime and underpins high absorption in rental fleets. The category's liquidity attracts both institutional investors and smaller contractors, keeping turnover brisk even during seasonal slowdowns. Cranes are advancing at a 6.42% CAGR through 2031 as urban densification fuels demand for high-reach lifting solutions. Tight OEM production slots for tower and crawler cranes amplify the premium on late-model units with accurate service logs. Sellers can thus capture above-average margins, and buyers accept them because rental alternatives are scarce during peak building cycles. Attachments and material-handling implements add modular flexibility, encouraging contractors to optimize fleets around core carriers and specialized tooling rather than multiple dedicated machines. This modular approach bolsters absorption for quick-coupler systems that accelerate jobsite changeovers.
Rising safety standards are also directing attention to telematics-enabled models that record duty cycles and overload events. Units with complete electronic histories transact faster and at higher values, especially in Europe, where regulatory compliance is strict. Meanwhile, standardized control layouts across major brands ease cross-training, allowing mixed fleets to reallocate operators without productivity penalties. That capability reinforces excavators' leadership, while specialized lifting still distinguishes cranes as the fastest growth niche within the used construction equipment market.
Internal combustion engines continue to hold 90.92% of the used construction equipment market share in 2025 due to unmatched energy density and ubiquitous diesel infrastructure. Heavy earthmoving in remote mining and pipeline projects will keep diesel indispensable beyond the forecast horizon. Yet electric machines are showing an 8.08% CAGR and are already pivotal in city centers with decibel limits and carbon budgets. Premiums of 20-30% persist for compliant units because supply is thin and the learning curve for maintenance is steep. Fleets exploiting night-shift work in emission-controlled areas find total operating costs lower for electrics, particularly when local utilities offer discounted off-peak charging.
Hybrid systems are carving a narrow but resilient space, especially on equipment with variable duty cycles, such as telescopic handlers that idle extensively. Diesel-electric drivetrains lower fuel consumption and delay battery replacement schedules, balancing capital cost against operational savings. However, the technology premium narrows as battery prices continue to fall. For now, ICE dominance gives the used construction equipment market essential depth and value stability, while growth in zero-emission zones lays the groundwork for a gradual but irreversible shift to electrics.
Complete Report Scope:
- By Product Type
- Crane
- Telescopic Handler
- Excavator
- Material Handling Equipment
- Loader and Backhoe
- Attachments and Others
- By Drive Type
- Internal Combustion Engine
- Electric
- Hybrid
- By End-use Industry
- Construction and Infrastructure
- Mining and Quarrying
- Agriculture and Forestry
- Industrial and Warehousing
- By Sales Channel
- Dealer / Broker
- Auction (Physical and Online)
- Rental Fleet Disposal
- Direct OEM Certified Pre-owned
- By Geography
- North America
- United States
- Canada
- Rest of North America
- South America
- Brazil
- Argentina
- Rest of South America
- Europe
- Germany
- United Kingdom
- France
- Russia
- Spain
- Italy
- Rest of Europe
- Asia-Pacific
- China
- India
- Japan
- South Korea
- Australia
- Rest of Asia-Pacific
- Midde East and Africa
- United Arab Emirates
- Saudi Arabia
- Turkey
- Egypt
- South Africa
- Rest of Middle East and Africa
- North America
Geography Analysis
Asia-Pacific held 47.62% of the used construction equipment market share in 2025 and will grow at a 6.74% CAGR through 2031 as India, China, and Southeast Asian nations accelerate spending on transport corridors, renewable power, and housing. India's National Infrastructure Pipeline and China's urban renewal policies drive sustained machine absorption, overwhelming local OEM capacity and prompting imports from Japan, Europe, and North America. Equipment transit times shorten due to regional maritime logistics investments, enabling just-in-time arrivals that align with project mobilization schedules.
North America's growth is underpinned by a mature secondary-market ecosystem and steady public-works appropriations in the United States. OEM buy-back programs are most advanced here, allowing contractors to rotate fleets every three to four years without major depreciation hits. Canada's uptick in resource projects has boosted demand for specialized forestry and pipeline equipment, further deepening liquidity in cross-border trade. Europe exhibits moderate volume but high unit values, driven by stringent emission frameworks that elevate the price of Stage V-compliant machines. Residual values remain strong partly because reimbursement programs in Germany and the Nordics subsidize cleaner equipment adoption. Electric mini-excavators and compact wheel loaders are disproportionately represented in European resales thanks to dense urban markets and early regulatory adoption.
The Middle East and Africa are emerging hot spots, especially Gulf Cooperation Council nations that balance oil revenue diversification with ambitious construction programs. Mega-projects such as NEOM in Saudi Arabia require immediate fleets, favoring imports of reliable late-model machines. Sub-Saharan Africa's mining expansion sustains demand for several construction equipment, though political risk and logistics still limit broader market depth. South America mirrors commodity cycles; Brazil and Chile purchase heavily during copper and iron-ore upswings, then slow during downturns, injecting volatility but also arbitrage opportunities into global flows.
- Caterpillar Inc.
- Komatsu Ltd.
- Deere & Company
- Volvo Construction Equipment
- Hitachi Construction Machinery Co., Ltd.
- Liebherr Group
- Kobelco Construction Machinery Co., Ltd.
- Terex Corporation
- Manitou Group
- CNH Industrial (Case CE)
- JCB
- Sany Heavy Industry Co. Ltd.
- Xuzhou Construction Machinery Group Co., Ltd.
- HD Hyundai Construction Equipment Co., Ltd.
- Bobcat Company
- Kubota Corporation
- Wirtgen Group
- Astec Industries
Additional Benefits:
- The market estimate (ME) sheet in Excel format
- 3 months of analyst support
TABLE OF CONTENTS
1 Introduction
- 1.1 Study Assumptions & Market Definition
- 1.2 Scope of the Study
2 Research Methodology
3 Executive Summary
4 Market Landscape
- 4.1 Market Overview
- 4.2 Market Drivers
- 4.2.1 Supply-Chain-Driven Fleet Renewals
- 4.2.2 Infrastructure Stimulus in Emerging Markets
- 4.2.3 Soaring Residual Values Driving Resale ROI
- 4.2.4 Electrification Mandates for Urban Job-Sites
- 4.2.5 Rapid Digitalization of Auction Platforms
- 4.2.6 OEM Buy-Back and Certified-Pre-Owned Programs
- 4.3 Market Restraints
- 4.3.1 Volatile Used-Equipment Price Cycles
- 4.3.2 Financing Tightness for Above 8-Year Assets
- 4.3.3 Regulatory Uncertainty on Engine Retrofits
- 4.3.4 Fragmented Inspection-Quality Standards
- 4.4 Value / Supply-Chain Analysis
- 4.5 Regulatory Landscape
- 4.6 Technological Outlook
- 4.7 Porter's Five Forces
- 4.7.1 Threat of New Entrants
- 4.7.2 Bargaining Power of Buyers
- 4.7.3 Bargaining Power of Suppliers
- 4.7.4 Threat of Substitutes
- 4.7.5 Intensity of Competitive Rivalry
5 Market Size & Growth Forecasts (Value (USD) and Volume (Units))
- 5.1 By Product Type
- 5.1.1 Crane
- 5.1.2 Telescopic Handler
- 5.1.3 Excavator
- 5.1.4 Material Handling Equipment
- 5.1.5 Loader and Backhoe
- 5.1.6 Attachments and Others
- 5.2 By Drive Type
- 5.2.1 Internal Combustion Engine
- 5.2.2 Electric
- 5.2.3 Hybrid
- 5.3 By End-use Industry
- 5.3.1 Construction and Infrastructure
- 5.3.2 Mining and Quarrying
- 5.3.3 Agriculture and Forestry
- 5.3.4 Industrial and Warehousing
- 5.4 By Sales Channel
- 5.4.1 Dealer / Broker
- 5.4.2 Auction (Physical and Online)
- 5.4.3 Rental Fleet Disposal
- 5.4.4 Direct OEM Certified Pre-owned
- 5.5 By Geography
- 5.5.1 North America
- 5.5.1.1 United States
- 5.5.1.2 Canada
- 5.5.1.3 Rest of North America
- 5.5.2 South America
- 5.5.2.1 Brazil
- 5.5.2.2 Argentina
- 5.5.2.3 Rest of South America
- 5.5.3 Europe
- 5.5.3.1 Germany
- 5.5.3.2 United Kingdom
- 5.5.3.3 France
- 5.5.3.4 Russia
- 5.5.3.5 Spain
- 5.5.3.6 Italy
- 5.5.3.7 Rest of Europe
- 5.5.4 Asia-Pacific
- 5.5.4.1 China
- 5.5.4.2 India
- 5.5.4.3 Japan
- 5.5.4.4 South Korea
- 5.5.4.5 Australia
- 5.5.4.6 Rest of Asia-Pacific
- 5.5.5 Midde East and Africa
- 5.5.5.1 United Arab Emirates
- 5.5.5.2 Saudi Arabia
- 5.5.5.3 Turkey
- 5.5.5.4 Egypt
- 5.5.5.5 South Africa
- 5.5.5.6 Rest of Middle East and Africa
- 5.5.1 North America
6 Competitive Landscape
- 6.1 Market Concentration
- 6.2 Strategic Moves
- 6.3 Market Share Analysis
- 6.4 Company Profiles (Includes Global Level Overview, Market Level Overview, Core Segments, Financials as Available, Strategic Information, Market Rank/Share for Key Companies, Products and Services, SWOT Analysis, and Recent Developments)
- 6.4.1 Caterpillar Inc.
- 6.4.2 Komatsu Ltd.
- 6.4.3 Deere & Company
- 6.4.4 Volvo Construction Equipment
- 6.4.5 Hitachi Construction Machinery Co., Ltd.
- 6.4.6 Liebherr Group
- 6.4.7 Kobelco Construction Machinery Co., Ltd.
- 6.4.8 Terex Corporation
- 6.4.9 Manitou Group
- 6.4.10 CNH Industrial (Case CE)
- 6.4.11 JCB
- 6.4.12 Sany Heavy Industry Co. Ltd.
- 6.4.13 Xuzhou Construction Machinery Group Co., Ltd.
- 6.4.14 HD Hyundai Construction Equipment Co., Ltd.
- 6.4.15 Bobcat Company
- 6.4.16 Kubota Corporation
- 6.4.17 Wirtgen Group
- 6.4.18 Astec Industries
7 Market Opportunities & Future Outlook
- 7.1 White-space & Unmet-need Assessment


