


 |
市場調查報告書
商品編碼
2116115
歐洲長皮運輸:市場佔有率分析、產業趨勢與統計及成長預測(2026-2031 年)Europe Long Haul Transport - Market Share Analysis, Industry Trends & Statistics, Growth Forecasts (2026 - 2031) |
||||||

※ 本網頁內容可能與最新版本有所差異。詳細情況請與我們聯繫。
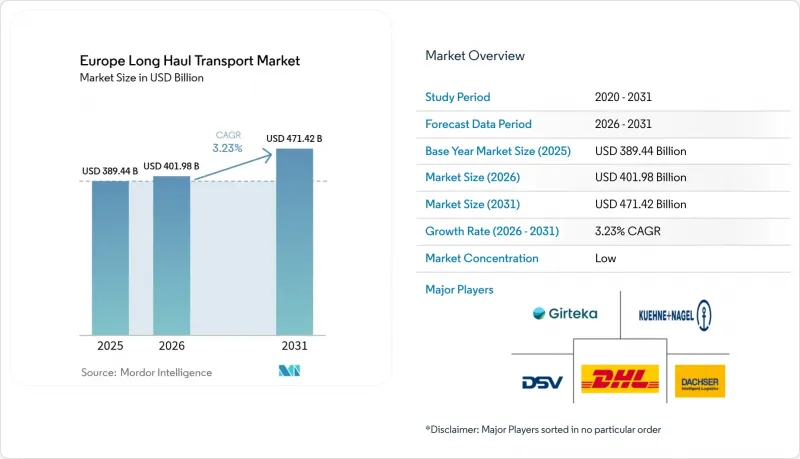
據 Mordor Intelligence 稱,2025 年歐洲長途運輸市場價值為 3894.4 億美元,預計到 2031 年將達到 4714.2 億美元,而 2026 年為 4019.8 億美元,預測期(2026-2031 年)的複合成長率為 3.23%。
本報告按運輸方式(公路、鐵路、海運和內河航運、航空)、終端用戶行業(農業、漁業、林業;建築業;製造業;石油和天然氣、採礦和採石業;批發和零售業;其他)以及地區(德國、英國、西班牙、義大利、荷蘭、法國、波蘭等)進行細分。市場預測以美元計價。
歐洲長途運輸市場的趨勢與洞察
歐盟綠色交易與「適合55歲族群」的交通方式轉型目標
「Fit-for-55」方案設定了具有法律約束力的二氧化碳減排目標,迫使托運人將長途貨物從公路轉向鐵路和內河航運。然而,由於貨運站擁擠和最後一公里運輸的限制,日常需求仍然嚴重偏向卡車。鐵路運輸有明顯的環保優勢,每噸公里排放量比公路低80%,但主要鐵路幹線的運轉率已超過85%,幾乎沒有空間容納激增的需求。碳邊境調節機制將物流排放納入進口合規審計,進一步加劇了這種壓力。因此,採購團隊現在對貨物碳排放數據的評估強度與以往僅用於成本評估的強度相同。 ISO 14083等認證系統已成為事實上的競標要求,迫使中小型承運商採用他們長期以來一直擱置的遠端資訊處理和資料報告工具。因此,儘管模式轉換的進展落後於政策預期,但車輛現代化和數位化視覺化專案的進展速度超出了預期。
TEN-T大型企劃的擴展
由歐盟14億歐元聯合撥款資助的波羅的海鐵路(Rail Baltika)870公里標準軌距線路,預計將打造連接塔林和華沙的無縫通道,但由於授權流程延誤,預計其通車時間將推遲至2030年或更晚。費馬恩海峽鐵路隧道預計2029年通車,屆時哥本哈根至漢堡的旅行時間將縮短至三小時以內,從而緩解目前受渡輪限制的貨運壓力。同時,德國國內鐵路網的升級改造每年獲得25億歐元的資金,但不同地區的土地徵用糾紛導致挖掘工作延誤。這些延誤都阻礙了鐵路在歐洲長途運輸市場的發展,儘管制定了碳減排目標,但大部分運輸量仍依賴道路運輸運輸。多式聯運貨場和電氣化等配套投資依賴於幹線的建成,因此,任何里程碑式專案的延誤都會產生更大的連鎖反應。從長遠來看,這些路線將把高速、低碳幹線納入網路,重塑整個大陸的貨運結構。
鐵路、港口和多式聯運的運力瓶頸
2024年,萊茵-阿爾卑斯山走廊和北海-地中海走廊的鐵路貨運利用率超過85%,幾乎沒有空間增加列車,列車時刻表的可靠性也受到影響。鹿特丹、安特衛普和漢堡的貨運站高峰期幾乎滿載運作,貨櫃停留時間超過48小時,削弱了鐵路理論上的門到門速度優勢。雖然貨運站自動化項目正在進行中,但土地徵用和授權程序通常需要3到5年,這意味著在2027年之前不太可能出現實質改善。目前,歐洲46%的鐵路線仍在使用柴油機車,這限制了模式轉換帶來的排放氣體效益,並使業者面臨燃料價格波動的風險。這些瓶頸因素綜合起來表明,在新的運輸能力投入運作之前,鐵路在歐洲長途運輸市場的佔有率將保持停滯不前。
細分市場分析
到2025年,道路運輸在歐洲長途運輸市場仍將佔59.10%的佔有率。這得歸功於歐洲發達的高速公路網路,確保了準時送達。然而,柴油價格上漲和司機短缺正對營運商的利潤率構成壓力。預計到2031年,航空貨運將維持最高的成長率,年複合成長率將達到4.75%,這主要得益於電子商務小包裹量的成長以及符合GDP標準的低溫運輸藥品運輸(需支付額外費用)。鐵路每噸公里排放量較低,符合「適合55歲」的政策,但運力瓶頸以及首末段的轉運限制了其市場佔有率的短期成長。每年運送3億噸萊茵河貨物的內河航道正面臨氣候變遷導致的水位下降帶來的挑戰,迫使部分貨物轉向鐵路和公路運輸。這凸顯了加強應對氣候變遷能力的重要性。
數位化貨運平台已將主要公路走廊的車輛閒置率從25%降低至18%以下,從而提升了小規模車隊的競爭力並降低了排放強度。鐵路聯運業者正透過引入物聯網感測器來追蹤位置和影響,從而縮小長期存在的資訊鴻溝,實現與道路運輸相媲美的透明度。同時,歐盟正投入5億歐元用於萊茵河和多瑙河流域船閘的現代化改造,以確保水路運輸在乾旱風險下的競爭力。隨著小包裹密度的增加,歐洲長途航空貨運市場規模預計將穩步擴大,這凸顯了企業運輸策略中運輸方式多元化的必要性。
其他好處:
- Excel格式的市場預測(ME)表
- 3個月的分析師支持
目錄
第1章:引言
- 研究假設和市場定義
- 調查範圍
第2章:調查方法
第3章執行摘要
第4章 市場狀況
- 市場概覽
- 市場促進因素
- 歐盟綠色新政與「適合55歲」出行方式轉變目標
- 擴展TEN-T大型企劃(波羅的海鐵路、費馬恩海峽鐵路等)
- 電子商務的爆炸式成長正在推動對小包裹和航空貨運路線的需求。
- 跨運輸方式的整合與第四方物流整合
- 零碳燃料和陸上電力基礎設施的部署
- 後疫情時代的韌性與近岸外包策略
- 市場限制因素
- 鐵路、港口和多式聯運碼頭的運力瓶頸
- 大型卡車調度可能導致運輸方式轉變逆轉
- 公路、鐵路和海運運輸領域駕駛人和技術工人短缺。
- 能源和船用燃料價格波動
- 價值供應鏈分析
- 監理情勢
- 技術展望
- 波特五力模型
第5章 市場規模及成長預測(價值,2019-2030 年)
- 透過運輸方式
- 路
- 鐵路
- 海運和內河航運
- 航空
- 按最終用戶行業分類
- 農業、漁業、林業
- 建造
- 製造業
- 石油和天然氣、採礦和採石
- 批發和零售
- 其他
- 國家
- 德國
- 英國
- 西班牙
- 義大利
- 荷蘭
- 法國
- 波蘭
- 其他歐洲國家
第6章 競爭情勢
- 市場集中度
- 策略趨勢
- 市佔率分析
- 公司簡介
- DHL Group
- Kuehne+Nagel
- DSV A/S
- Dachser
- Girteka Logistics
- Waberer's International
- Raben Group
- H. Essers
- Primafrio
- Turners(Soham)Ltd
- DFDS Logistics
- SNCF
- GXO Logistics
- Culina Group
- CMA CGM
- ROHLIG SUUS Logistics SA
- GRUBER Logistics SpA
- Hapag-Lloyd
- Rail Cargo Group
- InterRail Group
第7章 市場機會與未來展望
According to Mordor Intelligence, the Europe long haul transport market size was valued at USD 389.44 billion in 2025 and estimated to grow from USD 401.98 billion in 2026 to reach USD 471.42 billion by 2031, at a CAGR of 3.23% during the forecast period (2026-2031).
This report is Segmented by Mode of Transport (Road, Rail, Sea and Inland Waterways, Air), End-User Industry (Agriculture, Fishing, and Forestry; Construction; Manufacturing; Oil and Gas, Mining and Quarrying; Wholesale and Retail Trade; Others), and Geography (Germany, United Kingdom, Spain, Italy, Netherlands, France, Poland, and More). The Market Forecasts are Provided in Terms of Value (USD).
Europe Long Haul Transport Market Trends and Insights
EU Green Deal & Fit-for-55 Modal-Shift Targets
The Fit-for-55 package fixes legally binding CO2 cuts that push shippers to reroute long-haul volume from road toward rail or inland waterways, yet terminal backlogs and last-mile constraints still tilt day-to-day demand toward trucks. Rail's 80% lower emissions per tonne-kilometer give it a clear environmental edge, but capacity on core corridors hovers above 85%, leaving little surge headroom. The carbon-border adjustment mechanism extends the pressure by inserting logistics emissions into import compliance audits, so procurement teams now assess freight carbon data with the same rigor once reserved for cost. Certification schemes such as ISO 14083 have become de facto tender prerequisites, compelling smaller carriers to buy telematics and data-reporting tools they had long deferred. Consequently, fleet renewal and digital visibility projects are pacing quicker than anticipated, even if modal shifts lag policy intent.
Expansion of TEN-T Megaprojects
Rail Baltica's 870 km of standard-gauge track, supported by EUR 1.4 billion in EU co-financing, promises a seamless Tallinn-Warsaw route, yet permitting delays push commissioning beyond 2030. The Fehmarn Belt rail tunnel slashes Copenhagen-Hamburg transit to under three hours when operational in 2029, unlocking freight flows that today navigate ferry bottlenecks. Parallel German network upgrades receive EUR 2.5 billion of annual funding, but localized land-acquisition disputes slow diggers on the ground. Each delay holds back the rail share of Europe Long Haul Transport market growth, leaving road hauliers to soak up volume despite carbon targets. Secondary investments in intermodal yards and electrification hinge on main-line completion, amplifying the knock-on effect of every missed milestone. Long-term, these links still reshape continental freight geometry by embedding a high-speed, low-carbon spine into the network.
Rail-Line, Port & Intermodal Capacity Bottlenecks
Rail freight utilization on Rhine-Alpine and North Sea-Mediterranean corridors exceeded 85% in 2024, leaving minimal headroom for extra trains and increasing schedule unreliability. Rotterdam, Antwerp, and Hamburg terminals ran near saturation during peak weeks, extending container dwell times beyond 48 hours and eroding rail's theoretical door-to-door speed advantage. Terminal automation projects are underway, yet land acquisition and permitting often span three to five years, so meaningful relief is not expected before 2027. Diesel motive power still covers 46% of European track, limiting the emissions benefit of modal shift and exposing operators to fuel-price volatility. These bottlenecks collectively cap the rail share of the Europe Long Haul Transport market until new capacity comes online.
Other drivers and restraints analyzed in the detailed report include:
- Explosive E-commerce
- Consolidation & 4PL Integration
- Driver & Skills Shortages
For complete list of drivers and restraints, kindly check the Table Of Contents.
Segment Analysis
Road transport maintained a 59.10% Europe Long Haul Transport market share in 2025 as the continent's dense highway network underpins time-critical deliveries, yet escalating diesel costs and driver scarcity compress operator margins. Air freight carries the fastest growth outlook at a 4.75% CAGR through 2031, fueled by e-commerce parcel volume and GDP-compliant cold-chain pharmaceuticals that command premium rates. Rail's lower emissions per tonne-kilometer align with Fit-for-55 policy, but capacity bottlenecks and first-mile/last-mile transfers temper its immediate share gains. Inland waterways, moving 300 million t of Rhine traffic annually, face climate-linked low-water disruptions that shift cargo onto rail and road, highlighting the climate resilience imperative.
Digital freight platforms reduced empty running on primary road corridors from 25% to under 18%, boosting small-fleet competitiveness and lowering emissions intensity. Rail intermodal operators deploy IoT sensors that track location and shock to mimic road-level transparency, narrowing a historic information gap. Meanwhile, EU funds of EUR 500 million target lock modernization on Rhine and Danube stretches, a step meant to safeguard waterway competitiveness against drought risk. The Europe Long Haul Transport market size attached to air freight is forecast to climb steadily as parcel density rises, underscoring modal diversification in corporate shipping strategies.
Complete Report Scope:
- By Mode of Transport
- Road
- Rail
- Sea and Inlandwaterways
- Air
- By End-user Industry
- Agriculture, Fishing, and Forestry
- Construction
- Manufacturing
- Oil and Gas, Mining and Quarrying
- Wholesale and Retail Trade
- Others
- By Country
- Germany
- United Kingdom
- Spain
- Italy
- Netherlands
- France
- Poland
- Rest of Europe
List of Companies Covered in this Report:
- DHL Group
- Kuehne + Nagel
- DSV A/S
- Dachser
- Girteka Logistics
- Waberer's International
- Raben Group
- H. Essers
- Primafrio
- Turners (Soham) Ltd
- DFDS Logistics
- SNCF
- GXO Logistics
- Culina Group
- CMA CGM
- ROHLIG SUUS Logistics SA
- GRUBER Logistics SpA
- Hapag-Lloyd
- Rail Cargo Group
- InterRail Group
Additional Benefits:
- The market estimate (ME) sheet in Excel format
- 3 months of analyst support
TABLE OF CONTENTS
1 Introduction
- 1.1 Study Assumptions & Market Definition
- 1.2 Scope of the Study
2 Research Methodology
3 Executive Summary
4 Market Landscape
- 4.1 Market Overview
- 4.2 Market Drivers
- 4.2.1 EU Green Deal & Fit-for-55 modal-shift targets
- 4.2.2 Expansion of TEN-T megaprojects (Rail Baltica, Fehmarn Belt, etc.)
- 4.2.3 Explosive e-commerce boosting parcel & air-cargo lane demand
- 4.2.4 Consolidation & 4PL integration across modes
- 4.2.5 Roll-out of zero-carbon fuel & shore-power infrastructure
- 4.2.6 Post-pandemic resilience & near-shoring strategies
- 4.3 Market Restraints
- 4.3.1 Rail-line, port & intermodal terminal capacity bottlenecks
- 4.3.2 Heavier-truck Directive risk of reverse modal shift
- 4.3.3 Driver & skills shortages across road, rail & maritime
- 4.3.4 Energy & bunker-fuel price volatility
- 4.4 Value / Supply-Chain Analysis
- 4.5 Regulatory Landscape
- 4.6 Technological Outlook
- 4.7 Porter's Five Forces
- 4.7.1 Threat of New Entrants
- 4.7.2 Bargaining Power of Suppliers
- 4.7.3 Bargaining Power of Buyers
- 4.7.4 Threat of Substitutes
- 4.7.5 Competitive Rivalry
5 Market Size & Growth Forecasts (Value, 2019 - 2030)
- 5.1 By Mode of Transport
- 5.1.1 Road
- 5.1.2 Rail
- 5.1.3 Sea and Inlandwaterways
- 5.1.4 Air
- 5.2 By End-user Industry
- 5.2.1 Agriculture, Fishing, and Forestry
- 5.2.2 Construction
- 5.2.3 Manufacturing
- 5.2.4 Oil and Gas, Mining and Quarrying
- 5.2.5 Wholesale and Retail Trade
- 5.2.6 Others
- 5.3 By Country
- 5.3.1 Germany
- 5.3.2 United Kingdom
- 5.3.3 Spain
- 5.3.4 Italy
- 5.3.5 Netherlands
- 5.3.6 France
- 5.3.7 Poland
- 5.3.8 Rest of Europe
6 Competitive Landscape
- 6.1 Market Concentration
- 6.2 Strategic Moves
- 6.3 Market Share Analysis
- 6.4 Company Profiles (includes Global level Overview, Market level overview, Core Segments, Financials as available, Strategic Information, Market Rank/Share for key companies, Products & Services, and Recent Developments)
- 6.4.1 DHL Group
- 6.4.2 Kuehne + Nagel
- 6.4.3 DSV A/S
- 6.4.4 Dachser
- 6.4.5 Girteka Logistics
- 6.4.6 Waberer's International
- 6.4.7 Raben Group
- 6.4.8 H. Essers
- 6.4.9 Primafrio
- 6.4.10 Turners (Soham) Ltd
- 6.4.11 DFDS Logistics
- 6.4.12 SNCF
- 6.4.13 GXO Logistics
- 6.4.14 Culina Group
- 6.4.15 CMA CGM
- 6.4.16 ROHLIG SUUS Logistics SA
- 6.4.17 GRUBER Logistics SpA
- 6.4.18 Hapag-Lloyd
- 6.4.19 Rail Cargo Group
- 6.4.20 InterRail Group
7 Market Opportunities & Future Outlook
- 7.1 White-space & Unmet-need Assessment


