


 |
市場調查報告書
商品編碼
2116047
智慧電源:市場佔有率分析、產業趨勢與統計、成長預測(2026-2031)Smart Power - Market Share Analysis, Industry Trends & Statistics, Growth Forecasts (2026 - 2031) |
||||||

※ 本網頁內容可能與最新版本有所差異。詳細情況請與我們聯繫。
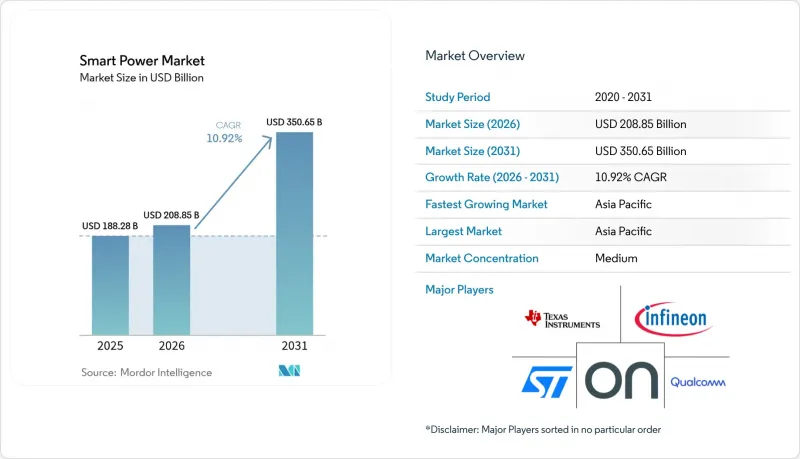
根據 Mordor Intelligence 預測,智慧電源市場規模將從 2025 年的 1882.8 億美元成長到 2026 年的 2088.5 億美元,然後在 2031 年達到 3506.5 億美元,2026 年至 2031 年的複合年成長率為 10.92%。
本報告按產品(無線充電器、能源管理系統)、技術(感應/磁振造影、射頻/紅外線等)、應用(家用電子電器、汽車和電動交通等)、最終用戶(OEM/設備製造商等)、功率裝置類型(電源管理IC等)和地區進行細分。市場預測以美元(USD)為單位。
全球智慧電力市場趨勢及洞察
無線充電在家用電子電器的廣泛應用
Qi2認證於2024年初通過,將磁錯位損耗降低至5%以下。這項突破性成就使得15瓦的平板電腦和筆記型電腦無線充電板實用化。 2024年,蘋果和三星出貨了超過2.5億部支援Qi2的智慧型手機,推動了價值40億美元的配件生態系統的發展。汽車製造商也紛紛效仿,推出了車載充電板,以減少線材磨損並提升車內檔次。酒店集團計劃在2026年約50萬間客房中整合Qi2模組,以提高便利性並降低維護成本。無線介面的普及也推動了工業IoT設備採用密封防水設計,進而提升了嚴苛環境下對無線充電設備的需求。
5G智慧型手機和物聯網設備中電源管理IC的廣泛應用。
在獨立組網的5G網路中,每個單元的功率放大器數量加倍,增加了晶片面積和電源管理整合電路(PMIC)的附加價值。 2024年下半年出貨的旗艦晶片組採用了動態電壓調節技術,可將電池壽命延長25%,預計到2025年,這項技術將在中階產品中得到更廣泛的應用。預計到2030年,物聯網邊緣節點的數量將達到300億,其睡眠電流需求低於1微安培,因此半導體製造商正在開發納瓦級轉換器。印度已撥款20億美元用於PMIC在地化生產,縮短了區域行動電話品牌的供應鏈。安全標準IEC 62368-1強化了故障保護方面的規則,導致PMIC內建的控制功能增加,材料清單(BOM)總價值上升。
氮化鎵和碳化矽等寬能隙材料高成本。
截至2024年,直徑150毫米的碳化矽(SiC)晶圓價格已接近1,500美元,與同等規格矽晶圓300美元的價格形成鮮明對比。這擠壓了組件的利潤空間,並限制了其應用範圍,使其僅限於高階驅動系統和工業領域。三家供應商控制超過70%的晶錠產能,而多年期供應合約將高價鎖定至2027年。 200毫米基板上的氮化鎵(GaN)外延良率仍為85%,遠低於主流消費級產品所需的95%的目標。因此,缺陷會增加成本,而品牌最終會將這些成本轉嫁給消費者。材料成本佔成品SiC MOSFET成本的40-50%,除非晶體生長技術取得突破性進展,否則價格大幅下降的空間將十分有限。 12-18個月的前置作業時間迫使汽車製造商分散採購矽和SiC逆變器,從兩家公司採購,削弱了大量採購的成本優勢。
細分市場分析
到2025年,無線充電器將佔據智慧電源市場42.55%的佔有率,這主要得益於超過8億件配件的出貨量。能源管理系統,特別是利用家庭分時電價最佳化和商業建築需量反應的能源管理系統,預計將推動市場在2031年之前以12.05%的複合年成長率成長。加州和德克薩斯州的電力公司在2024年安裝了200萬個智慧恆溫器,這些智慧恆溫器屬於靈活用電計畫的一部分,該計畫旨在獎勵尖峰負載削減。新平台內建的機器學習演算法能夠將建築能耗降低高達25%,從而縮短投資回收期並產生持續的軟體收入。無線充電功能目前正被整合到飯店和辦公家具中,但超過三年的行動電話更換週期限制了配件的重複訂購。
持續的屋頂太陽能發電熱潮正在加速對智慧逆變器和控制器的需求,這些設備可以將電池整合到虛擬電廠(VPP)中。到2024年,美國住宅太陽能發電和儲能系統的安裝數量將超過50萬套,每個系統都需要一個多端口能源中心,用於發電、儲能和靈活的負載平衡。各公司都在積極爭取ISO 50001認證,這推動了對能夠提供精細監控和自動故障檢測功能的系統的採購。無線充電器的應用範圍正從智慧型手機擴展到二合一筆記型電腦和掌上型遊戲機,但由於高階智慧型手機市場已趨於飽和,其成長速度預計將低於能源管理系統的普及速度。
到2025年,感應式充電和磁振造影技術將佔銷售額的54.60%,主要得益於旗艦智慧型手機對Qi2標準的廣泛採用。然而,寬能隙功率電子裝置預計將以14.10%的複合年成長率成長,成為技術領域中成長最快的領域。目前,超過60%的新型800伏特電動車平台都採用了碳化矽(SiC)模組,其效率的提升使得電池體積更小、續航里程更長。氮化鎵(GaN)電晶體被應用於100瓦USB-C充電器中,其重量比矽基產品輕40%,這確保了其能夠獲得主流配件製造商的青睞。資料中心營運商正在測試用於48伏特伺服器機架的GaN功率級,目標是實現98%的轉換效率,這將顯著降低冷卻負載。
高頻和紅外線無線電力傳輸仍是一個小眾領域,市佔率不足5%,其應用也僅限於資產追蹤和醫療植入。然而,首個1瓦無線電力傳輸認證將於2024年獲得,這預示著其在零售標誌和倉庫感測器等領域的應用前景廣闊。在近距離充電領域,由於電感式充電板的線圈耦合效率超過85%,且相容於金屬機殼,因此仍佔據主導地位。儘管如此,GaN和SiC技術的進步使得開關頻率得以提升,從而可以製造更小的線圈,降低電磁干擾,並提高裝置外形尺寸的柔軟性。
區域分析
預計到2025年,亞太地區將佔全球銷售額的37.80%,複合年成長率(CAGR)為12.25%,是所有地區中成長率最高的。同年,中國生產了超過900萬輛電池式電動車,每輛車都配備了碳化矽(SiC)逆變器和氮化鎵(GaN)充電器。印度的生產連結獎勵計畫計畫(PLI)推動電子產品產值在2024年達到1,150億美元,支持國內電源管理積體電路(PMIC)製造工廠的發展,進而降低對進口的依賴。日本新增了8吉瓦可再生能源發電裝置容量,刺激了對400萬套住宅能源系統的需求,這些系統可將屋頂太陽能發電與電網訊號同步。韓國半導體製造設備出口額超過200億美元,反映出其在異構PMIC和處理器先進封裝方面的資本投入。
北美和歐洲各佔約25%的市佔率。在美國,《通貨膨脹抑制法案》提供的7,500美元電動車稅額扣抵抵免加速了配備碳化矽驅動系統的車型銷量。到2024年,電力公司將安裝10個吉瓦時電網級電池儲能系統,每個系統都採用配備碳化矽功率級的多兆瓦逆變器。在歐洲,REPowerEU已累計430億歐元(約470億美元)在2028年前實現電網數位化。將於2025年生效的《建築能源性能指令》強制要求採用智慧化指標,以促進新建築中整合管理系統的應用。
儘管中東和非洲的佔比不到10%,但這些地區正呈現局部成長,尤其是在波灣合作理事會)國家智慧電錶的部署以及南非可再生能源競標中對先進併網逆變器的需求。拉丁美洲仍蘊藏著新的機遇,巴西和墨西哥正在探索分時電價機制和公用事業主導的屋頂太陽能補貼計劃,以鼓勵採用能源管理系統。雖然這些地區的先進半導體製造能力有限,但針對分散式可再生能源的政策獎勵正在創造對智慧電力硬體和軟體的下游需求。
其他好處:
- Excel格式的市場預測(ME)表
- 3個月的分析師支持
目錄
第1章:引言
- 研究假設和市場定義
- 調查範圍
第2章:調查方法
第3章執行摘要
第4章 市場狀況
- 市場概覽
- 市場促進因素
- 無線充電在家用電子電器的廣泛應用
- 5G智慧型手機和物聯網設備中電源管理IC的廣泛應用。
- 電動車的快速普及需要高效率的電力電子設備。
- 政府對智慧電網現代化改造的獎勵
- 將智慧電源模組整合到模組化家具中
- 透過人工智慧驅動的電源管理演算法降低待機功率損耗
- 市場限制因素
- 氮化鎵和碳化矽等寬能隙材料高成本。
- 標準的互通性和碎片化
- 高密度電源管理積體電路的溫度控管挑戰
- 半導體元件關稅波動
- 產業價值鏈分析
- 監理情勢
- 技術展望
- 宏觀經濟因素對市場的影響
- 波特五力分析
- 內建無線充電器的家具發展趨勢分析
- 投資分析
第5章 市場規模與成長預測
- 依產品
- 無線充電器
- 能源管理系統
- 透過技術
- 電感/磁共振
- 射頻/紅外線
- 寬能隙功率電子裝置(GaN、SiC)
- 透過使用
- 家用電子產品
- 汽車和電動旅行
- 工業自動化
- 住宅和商業能源管理
- 最終用戶
- OEM/設備製造商
- 公共產業及能源服務公司
- 飯店和零售業
- 政府/國防
- 按功率設備類型
- 電源管理積體電路
- 智慧功率模組
- 分離式寬能隙元件
- 開關電源
- 按地區
- 北美洲
- 美國
- 加拿大
- 墨西哥
- 南美洲
- 巴西
- 墨西哥
- 其他南美國家
- 歐洲
- 德國
- 英國
- 法國
- 西班牙
- 義大利
- 其他歐洲國家
- 亞太地區
- 中國
- 印度
- 日本
- 澳洲
- 韓國
- 其他亞太國家
- 中東和非洲
- 中東
- 沙烏地阿拉伯
- 阿拉伯聯合大公國
- 卡達
- 土耳其
- 其他中東國家
- 非洲
- 南非
- 奈及利亞
- 其他非洲國家
- 中東
- 北美洲
第6章 競爭情勢
- 市場集中度
- 策略趨勢
- 市佔率分析
- 公司簡介
- Texas Instruments Incorporated
- Infineon Technologies AG
- STMicroelectronics NV
- ON Semiconductor Corporation
- Qualcomm Incorporated
- Apple Inc.
- Samsung Electronics Co., Ltd.
- LG Electronics Inc.
- Huawei Technologies Co., Ltd.
- Nokia Corporation
- Anker Innovations Technology Co., Ltd.
- Belkin International, Inc.
- Logitech International SA
- ZAGG Inc.(mophie)
- Energous Corporation
- Ossia Inc.
- Powermat Technologies Ltd.
- Dialog Semiconductor GmbH
- Navitas Semiconductor Corporation
- Efficient Power Conversion Corporation
- GaN Systems Inc.
第7章 市場機會與未來展望
According to Mordor Intelligence, the smart power market size is expected to grow from USD 188.28 billion in 2025 to USD 208.85 billion in 2026 and is forecast to reach USD 350.65 billion by 2031 at 10.92% CAGR over 2026-2031.
This report is Segmented by Product (Wireless Chargers, Energy Management Systems), Technology (Inductive/Magnetic Resonance, Radio Frequency/Infrared, and More), Application (Consumer Electronics, Automotive and E-Mobility, and More), End User (OEMs/Device Manufacturers, and More), Power Device Type (Power Management ICs, and More), and Geography. The Market Forecasts are Provided in Terms of Value (USD).
Global Smart Power Market Trends and Insights
Rising Adoption of Wireless Charging in Consumer Electronics
Qi2 certification in early 2024 reduced magnetic misalignment losses below 5%, a milestone that made 15-watt inductive pads practical for tablets and laptops. Apple and Samsung shipped more than 250 million Qi2-enabled phones in 2024, catalyzing a USD 4 billion accessory ecosystem. Automakers followed, adding in-cab charging pads that curb cable wear and accent premium interiors. Hotel groups are embedding Qi2 modules in approximately half a million guest rooms by 2026 to enhance convenience and reduce maintenance costs. The switch away from wired ports also supports sealed, water-resistant designs for industrial IoT devices, boosting unit demand in harsh-environment segments.
Proliferation of Power Management ICs in 5G Smartphones and IoT Devices
Standalone 5G networks double the number of power amplifiers per phone, lifting PMIC die area and value content. Flagship chipsets that shipped in late 2024 incorporate dynamic voltage scaling, which saves 25% of battery life, driving adoption across mid-range tiers in 2025. IoT edge nodes, forecast to reach 30 billion units by 2030, require a sub-1-microamp sleep current, prompting semiconductor manufacturers to develop nanowatt converters. India earmarked USD 2 billion to localize PMIC fabrication, shortening supply chains for regional handset brands. Safety standard IEC 62368-1 tightens fault protection rules, sending more control functions inside the PMIC and raising the bill-of-materials value.
High Cost of Wide-Bandgap Materials Such as GaN and SiC
SiC wafers priced near USD 1,500 for 150-millimeter diameters in 2024 contrast sharply against USD 300 silicon equivalents, squeezing module margins and confining adoption to premium drivetrain and industrial categories. With three vendors controlling more than 70% of boule capacity, multi-year supply deals lock in elevated pricing through 2027. GaN epitaxy yields of 85% on 200-millimeter substrates still trail the 95% target for mainstream consumer cost points, resulting in defect premiums that brands ultimately pass on to consumers. Material costs form 40-50% of the finished SiC MOSFET expense, limiting large-scale price drops unless breakthroughs in crystal growth occur. Lead times of 12-18 months push automakers to dual-source silicon and SiC inverters, diluting volume leverage.
Other drivers and restraints analyzed in the detailed report include:
- Rapid Growth of Electric Vehicles Requiring High-Efficiency Power Electronics
- Government Incentives for Smart Grid Modernization
- Interoperability and Standards Fragmentation
For complete list of drivers and restraints, kindly check the Table Of Contents.
Segment Analysis
Wireless chargers held a 42.55% share of the smart power market size in 2025, driven by more than 800 million accessory shipments. Energy management systems are forecast to outpace at a 12.05% CAGR through 2031, leveraging time-of-use tariff optimization in homes and demand-response automation in commercial buildings. California and Texas utilities installed 2 million smart thermostats during 2024 under flexibility programs that reward peak-load curtailment. Machine-learning algorithms within new platforms can reduce building energy intensity by up to 25%, enhancing payback and generating recurring software revenue. Wireless charging is now being incorporated into furniture sold to hospitality and office clients, yet handset replacement cycles that stretch beyond three years temper accessory reorder volume.
The ongoing rooftop solar boom accelerates demand for intelligent inverters and controllers that integrate batteries into virtual power plants. Residential solar-plus-storage installs in the United States exceeded 500,000 units in 2024, each requiring multi-port energy hubs that orchestrate generation, storage, and flexible loads. Corporates pursue ISO 50001 certification, driving procurement of systems that deliver granular monitoring and automatic fault detection. Wireless chargers migrate beyond phones into two-in-one laptops and handheld gaming devices, but saturation in the premium smartphone tier suggests slower incremental growth compared with energy management rollouts.
Inductive and magnetic resonance technologies accounted for 54.60% of 2025 revenue, primarily due to the deployment of Qi2 across flagship smartphones. Still, wide-bandgap power electronics are expected to post a 14.10% CAGR, the fastest among technology buckets. SiC modules now feature in more than 60% of new 800-volt EV platforms, delivering efficiency gains that cascade into smaller batteries and longer driving range. GaN transistors power 100-watt USB-C chargers that are 40% lighter than silicon-based units, securing design slots with accessory leaders. Data-center operators are testing GaN power stages for 48-volt server racks, aiming for 98% conversion efficiency, which could significantly reduce the cooling load.
Radio frequency and infrared wireless power transfer remain niche, with a share under 5%, confined to asset tracking and medical implant use. Yet the first 1-watt over-the-air certification received in 2024 hints at expanded retail signage and warehouse sensor opportunities. Inductive pads retain dominance in near-field charging as coil coupling surpasses 85% and supports metal device housings. Nonetheless, the march toward higher switching frequencies enabled by GaN and SiC reduces coil dimensions, thereby curbing electromagnetic interference and enhancing form factor flexibility.
Complete Report Scope:
- By Product
- Wireless Chargers
- Energy Management Systems
- By Technology
- Inductive / Magnetic Resonance
- Radio Frequency / Infrared
- Wide-Bandgap Power Electronics (GaN, SiC)
- By Application
- Consumer Electronics
- Automotive and E-Mobility
- Industrial Automation
- Residential and Commercial Energy Management
- By End User
- OEMs / Device Manufacturers
- Utilities and Energy Service Companies
- Hospitality and Retail
- Government and Defense
- By Power Device Type
- Power Management ICs
- Smart Power Modules
- Discrete Wide-Bandgap Devices
- Switching Mode Power Supplies
- By Geography
- North America
- United States
- Canada
- Mexico
- South America
- Brazil
- Mexico
- Rest of South America
- Europe
- Germany
- United Kingdom
- France
- Spain
- Italy
- Rest of Europe
- Asia Pacific
- China
- India
- Japan
- Australia
- South Korea
- Rest of Asia Pacific
- Middle East and Africa
- Middle East
- Saudi Arabia
- United Arab Emirates
- Qatar
- Turkey
- Rest of Middle East
- Africa
- South Africa
- Nigeria
- Rest of Africa
- Middle East
- North America
Geography Analysis
The Asia Pacific region held 37.80% of 2025 revenue and is advancing at a 12.25% CAGR, the strongest among all regions. China produced more than 9 million battery electric vehicles that year, each loaded with SiC inverters and GaN chargers. India's Production Linked Incentive scheme propelled electronics output to USD 115 billion in 2024, supporting domestic PMIC fabs that reduce import reliance. Japan added 8 gigawatts of renewable capacity, sparking demand for 4 million residential energy systems that sync rooftop solar with grid signals. South Korea's semiconductor equipment exports surpassed USD 20 billion, reflecting capital outlays on advanced packaging of heterogeneous PMICs and processors.
North America and Europe each held a near 25% share. In the United States, the Inflation Reduction Act's USD 7,500 EV tax credit has accelerated sales of models featuring SiC drivetrains. Utilities installed 10 gigawatt-hours of grid-scale batteries in 2024, each using multi-megawatt inverters built on SiC power stages. Europe's REPowerEU has earmarked EUR 43 billion (USD 47 billion) for the digitization of distribution networks through 2028. The Energy Performance of Buildings Directive, effective from 2025, mandates smart readiness indicators that promote integrated management systems in new construction.
The Middle East and Africa contributed under 10% but enjoy pockets of high growth, especially in Gulf Cooperation Council smart meter rollouts and South African renewable tenders that demand advanced grid-support inverters. Latin America remains an emerging opportunity as Brazil and Mexico explore time-of-use tariffs and utility-backed rooftop solar credits that encourage energy management system uptake. Although advanced semiconductor fabrication is limited in these regions, policy incentives for distributed renewables create downstream demand for smart power hardware and software.
- Texas Instruments Incorporated
- Infineon Technologies AG
- STMicroelectronics N.V.
- ON Semiconductor Corporation
- Qualcomm Incorporated
- Apple Inc.
- Samsung Electronics Co., Ltd.
- LG Electronics Inc.
- Huawei Technologies Co., Ltd.
- Nokia Corporation
- Anker Innovations Technology Co., Ltd.
- Belkin International, Inc.
- Logitech International S.A.
- ZAGG Inc. (mophie)
- Energous Corporation
- Ossia Inc.
- Powermat Technologies Ltd.
- Dialog Semiconductor GmbH
- Navitas Semiconductor Corporation
- Efficient Power Conversion Corporation
- GaN Systems Inc.
Additional Benefits:
- The market estimate (ME) sheet in Excel format
- 3 months of analyst support
TABLE OF CONTENTS
1 INTRODUCTION
- 1.1 Study Assumptions and Market Definition
- 1.2 Scope of the Study
2 RESEARCH METHODOLOGY
3 EXECUTIVE SUMMARY
4 MARKET LANDSCAPE
- 4.1 Market Overview
- 4.2 Market Drivers
- 4.2.1 Rising Adoption of Wireless Charging in Consumer Electronics
- 4.2.2 Proliferation of Power Management ICs in 5G Smartphones and IoT Devices
- 4.2.3 Rapid Growth of Electric Vehicles Requiring High-Efficiency Power Electronics
- 4.2.4 Government Incentives for Smart Grid Modernization
- 4.2.5 Integration of Smart Power Modules into Modular Furniture
- 4.2.6 AI-Enhanced Power Management Algorithms Reducing Standby Losses
- 4.3 Market Restraints
- 4.3.1 High Cost of Wide-Bandgap Materials such as GaN and SiC
- 4.3.2 Interoperability and Standards Fragmentation
- 4.3.3 Thermal Management Challenges in High-Density PMICs
- 4.3.4 Tariff Volatility on Semiconductor Components
- 4.4 Industry Value Chain Analysis
- 4.5 Regulatory Landscape
- 4.6 Technological Outlook
- 4.7 Impact of Macroeconomic Factors on the Market
- 4.8 Porter's Five Forces Analysis
- 4.8.1 Bargaining Power of Suppliers
- 4.8.2 Bargaining Power of Consumers
- 4.8.3 Threat of New Entrants
- 4.8.4 Threat of Substitute Products
- 4.8.5 Intensity of Competitive Rivalry
- 4.9 Wireless Charger Embedded Furniture Trend Analysis
- 4.10 Investment Analysis
5 MARKET SIZE AND GROWTH FORECASTS (VALUE)
- 5.1 By Product
- 5.1.1 Wireless Chargers
- 5.1.2 Energy Management Systems
- 5.2 By Technology
- 5.2.1 Inductive / Magnetic Resonance
- 5.2.2 Radio Frequency / Infrared
- 5.2.3 Wide-Bandgap Power Electronics (GaN, SiC)
- 5.3 By Application
- 5.3.1 Consumer Electronics
- 5.3.2 Automotive and E-Mobility
- 5.3.3 Industrial Automation
- 5.3.4 Residential and Commercial Energy Management
- 5.4 By End User
- 5.4.1 OEMs / Device Manufacturers
- 5.4.2 Utilities and Energy Service Companies
- 5.4.3 Hospitality and Retail
- 5.4.4 Government and Defense
- 5.5 By Power Device Type
- 5.5.1 Power Management ICs
- 5.5.2 Smart Power Modules
- 5.5.3 Discrete Wide-Bandgap Devices
- 5.5.4 Switching Mode Power Supplies
- 5.6 By Geography
- 5.6.1 North America
- 5.6.1.1 United States
- 5.6.1.2 Canada
- 5.6.1.3 Mexico
- 5.6.2 South America
- 5.6.2.1 Brazil
- 5.6.2.2 Mexico
- 5.6.2.3 Rest of South America
- 5.6.3 Europe
- 5.6.3.1 Germany
- 5.6.3.2 United Kingdom
- 5.6.3.3 France
- 5.6.3.4 Spain
- 5.6.3.5 Italy
- 5.6.3.6 Rest of Europe
- 5.6.4 Asia Pacific
- 5.6.4.1 China
- 5.6.4.2 India
- 5.6.4.3 Japan
- 5.6.4.4 Australia
- 5.6.4.5 South Korea
- 5.6.4.6 Rest of Asia Pacific
- 5.6.5 Middle East and Africa
- 5.6.5.1 Middle East
- 5.6.5.1.1 Saudi Arabia
- 5.6.5.1.2 United Arab Emirates
- 5.6.5.1.3 Qatar
- 5.6.5.1.4 Turkey
- 5.6.5.1.5 Rest of Middle East
- 5.6.5.2 Africa
- 5.6.5.2.1 South Africa
- 5.6.5.2.2 Nigeria
- 5.6.5.2.3 Rest of Africa
- 5.6.5.1 Middle East
- 5.6.1 North America
6 COMPETITIVE LANDSCAPE
- 6.1 Market Concentration
- 6.2 Strategic Moves
- 6.3 Market Share Analysis
- 6.4 Company Profiles (includes Global Level Overview, Market Level Overview, Core Segments, Financials as Available, Strategic Information, Market Rank/Share for Key Companies, Products and Services, and Recent Developments)
- 6.4.1 Texas Instruments Incorporated
- 6.4.2 Infineon Technologies AG
- 6.4.3 STMicroelectronics N.V.
- 6.4.4 ON Semiconductor Corporation
- 6.4.5 Qualcomm Incorporated
- 6.4.6 Apple Inc.
- 6.4.7 Samsung Electronics Co., Ltd.
- 6.4.8 LG Electronics Inc.
- 6.4.9 Huawei Technologies Co., Ltd.
- 6.4.10 Nokia Corporation
- 6.4.11 Anker Innovations Technology Co., Ltd.
- 6.4.12 Belkin International, Inc.
- 6.4.13 Logitech International S.A.
- 6.4.14 ZAGG Inc. (mophie)
- 6.4.15 Energous Corporation
- 6.4.16 Ossia Inc.
- 6.4.17 Powermat Technologies Ltd.
- 6.4.18 Dialog Semiconductor GmbH
- 6.4.19 Navitas Semiconductor Corporation
- 6.4.20 Efficient Power Conversion Corporation
- 6.4.21 GaN Systems Inc.
7 MARKET OPPORTUNITIES AND FUTURE OUTLOOK
- 7.1 White-Space and Unmet-Need Assessment


