


 |
市場調查報告書
商品編碼
2116016
雲端工作負載保護:市場佔有率分析、行業趨勢和統計數據、成長預測(2026-2031 年)Cloud Workload Protection - Market Share Analysis, Industry Trends & Statistics, Growth Forecasts (2026 - 2031) |
||||||

※ 本網頁內容可能與最新版本有所差異。詳細情況請與我們聯繫。
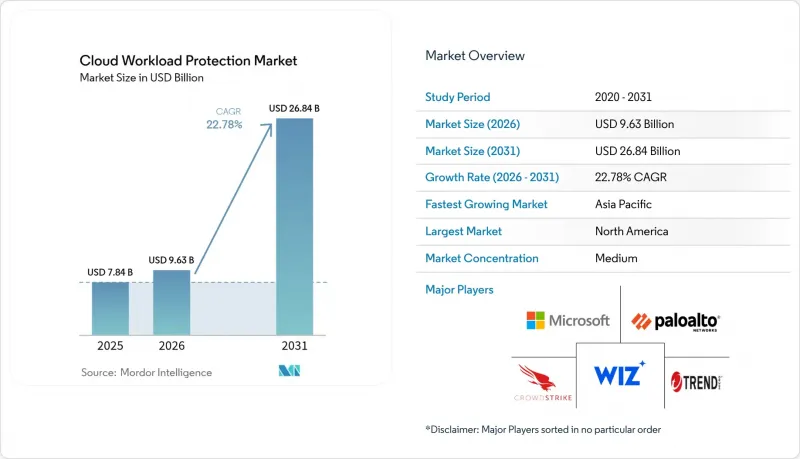
根據 Mordor Intelligence 預測,雲端工作負載保護市場規模將從 2025 年的 78.4 億美元成長到 2026 年的 96.3 億美元,然後在 2031 年達到 268.4 億美元,2026 年至 2031 年的複合年成長率為 22.78%。
本報告按組件(解決方案、服務)、安全架構(基於代理的、其他)、部署類型(私有雲、公有雲、混合雲)、雲端工作負載類型(虛擬機、其他)、組織規模(大型企業、其他)、最終用戶(銀行、金融服務和保險、醫療保健、其他)以及地區進行細分。市場預測以美元計價。
全球雲端工作負載保護市場趨勢與洞察
多重雲端採用率快速成長
將工作負載分佈在多個超超大規模資料中心業者上的企業策略正在重新思考安全架構,並提升對無代理可見性的需求。美國國防部的《雲端安全手冊》倡導在異質環境中實現統一的安全態勢,從而推動了以平台為中心的採購趨勢。金融機構正著重採用多重雲端環境,以實現跨司法管轄區的合規性,確保營運彈性,同時避免被單一供應商鎖定。 CNAPP 套件因其將安全態勢管理、運行時保護和事件回應整合到單一控制平面而備受關注。供應商的藍圖越來越重視基於 API 的發現機制,這消除了在數千個臨時資產上部署和更新代理商的管理負擔。
遷移到 DevSecOps 可加速 CNAPP 的採用
將安全控制整合到持續整合和配置管道中,可加快工作負載上線前漏洞的偵測速度。微軟關於保護雲端原生應用程式的指南展示了建置過程中的自動化檢查如何縮短修復週期,並提高開發人員與安全目標的一致性。這種方法在滿足管治要求的同時,提高了發布速度。 Kubernetes 等容器編排管理平台引入了運行時複雜性,而傳統終端代理難以監控這些複雜性,這推動了整合式「掃描到保護」工作流程的普及。隨著 DevSecOps 文化的成熟,採購策略正轉向那些在整合開發環境中提供對開發人員友善的 API、策略即程式碼範本和可操作回饋循環的解決方案。
複雜的多區域資料居住要求
資料主權法規的差異迫使企業維護特定區域的雲端實例並限制遙測資料傳輸,這使得統一威脅偵測變得更加複雜。 《不可能的雲端》一書重點闡述了在地化法規如何導致安全架構碎片化和營運成本飆升。金融公司必須遵守GDPR、巴塞爾協議III和各國銀行法,這要求服務提供者在國內處理日誌、擁有加密金鑰並提供本地認證的資料中心。供應商投入大量研發資源以獲得合規認證,這可能會減緩創新並提高新興企業的進入門檻。
細分市場分析
預計到 2025 年,解決方案將佔總收入的 67.35%,這反映出市場對涵蓋從態勢管理到事件回應等各個環節的整合平台的需求。隨著運行時分析成為一項強制性要求,解決方案交付中雲端工作負載保護的市場規模預計也將擴大,威脅偵測和回應工具的複合年成長率 (CAGR) 將達到 27.29%。綜合套件整合了漏洞評估、合規性報告和加密功能,從而提高了平台採用率並降低了總體擁有成本 (TCO)。
剩餘的32.65%收入來自服務板塊,主要得益於其託管檢測功能,該功能有效解決了人才短缺問題。專業服務可協助進行架構設計和遷移,而託管服務則更受尋求營運專業知識但又不想僱用全職員工的中小型企業青睞。技術與服務的緊密結合正在加速價值實現,為諮詢服務提升銷售創造了途徑,並持續推動雲端工作負載保護市場的收入成長。
到 2025 年,基於代理的部署將佔據雲端工作負載保護市場佔有率的 63.25%。這是因為核心駐留模組能夠提供對封包和進程控制的精細化可見性。這些可見性對於高頻交易和其他對延遲敏感、需要確定性監控的工作負載仍然至關重要。然而,隨著超大規模資料中心業者API 的日趨成熟,以及客戶傾向於選擇維運負擔較小的解決方案,無代理市場正以 31.15% 的複合年成長率 (CAGR) 不斷擴張。
無代理雲端工作負載保護的市場規模正受益於 ARM 伺服器的普及和無伺服器運算的擴展,這兩者都對傳統代理提出了挑戰。混合策略正在彌補功能上的不足,該策略將用於關鍵任務資產的用戶端感測器與用於臨時工作負載的 API 遙測相結合。微軟向 Azure Monitor Agent 的遷移標誌著業界正朝著統一收集器的方向發展,這種收集器能夠在擴展資料粒度的同時最大限度地降低 CPU 開銷。
區域分析
預計到2025年,北美將佔據37.70%的市場佔有率,這得益於成熟的雲端運算應用、強勁的創業融資以及FedRAMP等監管措施的推動。高規格的認證正在推動民用機構和國防項目採用雲端運算,並提升供應商的信譽。加拿大和墨西哥也呈現類似的趨勢,它們正在根據當地的隱私法律調整美國的框架,並擴大市場覆蓋範圍。
亞太地區正以28.9%的複合年成長率成長,這主要得益於印度「數位優先」的銀行業、中國製造業的數位轉型以及澳洲和日本公共部門強制採用雲端運算。根據Akamai的數據,全部區域的網路攻擊增加了73%,預計到2024年,金融服務業將處理超過270億個惡意請求。這種威脅情勢正在推動運行時保護技術的快速普及,這一趨勢在新加坡和韓國尤為顯著,因為這兩個國家的監管機構正在強制要求企業遵守零信任原則。
預計到2025年,歐洲將維持27.95%的收入佔有率,GDPR仍將是推動合規的主要動力。歐洲資料保護委員會強調跨國資料管理,並敦促跨國公司實施區域性遙測管道。供應商正競相遵守新的人工智慧相關法律,這些法律對本地化資料中心、加密金鑰所有權、模型可解釋性和資料保存等方面進行了定義。隨著雲端運算在製造業和能源領域的應用不斷擴展,東歐和北歐市場正在推動進一步成長。
其他好處:
- Excel格式的市場預測(ME)表
- 3個月的分析師支持
目錄
第1章:引言
- 研究假設和市場定義
- 調查範圍
第2章:調查方法
第3章執行摘要
第4章 市場狀況
- 市場概覽
- 市場促進因素
- 多重雲端的採用率正在迅速提高。
- 向 DevSecOps 的轉變正在加速 CNAPP 的採用。
- 雲端原生勒索軟體的興起以及對違規。
- 成本效益與本地部署工具的比較
- 利用 eBPF 進行深度遙測可確保運行時可靠性。
- 雲端保險承保人需要CWPP認證。
- 市場限制因素
- 複雜的多系統資料居住要求
- 安全營運團隊中工具的氾濫與負責人的倦怠
- 雲端安全領域人員短缺
- ARM 伺服器的日益普及正在對傳統代理程式產生影響。
- 產業價值鏈分析
- 監理情勢
- 技術展望
- 波特五力模型
第5章 市場規模與成長預測
- 按組件
- 解決方案
- 監控和日誌記錄
- 政策與合規管理
- 脆弱性評估
- 威脅偵測和事件回應
- 加密、令牌化和金鑰管理
- 服務
- 託管服務
- 專業服務
- 解決方案
- 透過安全架構
- 基於代理的
- 無代理
- 混合
- 按部署模式
- 公共雲端
- 私有雲端
- 混合雲端
- 按雲端工作負載類型分類
- 虛擬機器(VM)
- 容器
- 無伺服器/FaaS
- 按組織規模
- 大公司
- 中小企業
- 按最終用戶行業分類
- BFSI
- 醫療保健和生命科學
- 資訊科技/通訊
- 零售和消費品
- 媒體與娛樂
- 能源公用事業
- 政府/國防
- 其他終端用戶產業
- 按地區
- 北美洲
- 美國
- 加拿大
- 墨西哥
- 南美洲
- 巴西
- 阿根廷
- 其他南美國家
- 歐洲
- 英國
- 德國
- 法國
- 俄羅斯
- 其他歐洲國家
- 亞太地區
- 中國
- 日本
- 印度
- 澳洲和紐西蘭
- 韓國
- 其他亞太國家
- 中東和非洲
- 中東
- 海灣合作理事會(沙烏地阿拉伯、阿拉伯聯合大公國、卡達、科威特、巴林、阿曼)
- 土耳其
- 其他中東國家
- 非洲
- 南非
- 奈及利亞
- 肯亞
- 其他非洲國家
- 中東
- 北美洲
第6章 競爭情勢
- 市場集中度
- 策略趨勢
- 市佔率分析
- 公司簡介
- Orca Security
- CrowdStrike(Falcon Cloud Security)
- Palo Alto Networks(Prisma Cloud)
- Microsoft(Defender for Cloud)
- Wiz, Inc.
- Trend Micro Inc.
- Check Point Software Tech.
- McAfee LLC
- Broadcom Inc.(Symantec)
- Sophos Group plc
- Upwind
- SentinelOne
- Cisco(Protect Cloud Workload)
- Guardicore(Rapid7)
- Wiz
- Aqua Security
- Tenable(Cloud Security)
- Qualys, Inc.
- Tripwire Inc.
- LogRhythm Inc.
- Snyk Ltd.
第7章 市場機會與未來展望
According to Mordor Intelligence, the cloud workload protection market size is expected to grow from USD 7.84 billion in 2025 to USD 9.63 billion in 2026 and is forecast to reach USD 26.84 billion by 2031 at 22.78% CAGR over 2026-2031.
This report is Segmented by Component (Solutions, and Services), by Security Architecture (Agent-Based, and More), by Deployment (Private, Public, Hybrid), by Cloud Workload Type (Virtual Machines (VMs), and More), by Organization Size (Large Enterprises, and More), by End-User (BFSI, Healthcare, and More), and Geography. The Market Forecasts are Provided in Terms of Value (USD).
Global Cloud Workload Protection Market Trends and Insights
Multi-cloud Adoption Surge
Enterprise strategies that distribute workloads across several hyperscalers reshape security architectures and elevate demand for agentless visibility. The Department of Defense Cloud Security Playbook advocates a unified security posture across heterogeneous environments, reinforcing platform-centric buying preferences. Financial institutions value multi-cloud for compliance across jurisdictions, ensuring operational resilience while avoiding vendor lock-in. CNAPP suites gain traction because they consolidate posture management, runtime protection, and incident response inside a single control plane. Vendor roadmaps increasingly emphasize API-based discovery that eliminates the administrative burden of deploying and updating agents across thousands of ephemeral assets.
DevSecOps Shift Accelerating CNAPP Roll-outs
Embedding security controls within continuous integration and deployment pipelines accelerates detection of vulnerabilities before workloads reach production. Microsoft's guidance on cloud-native application protection illustrates how automated checks inside build processes shorten remediation cycles and align developers with security objectives. The approach boosts release velocity while sustaining governance requirements. Container orchestration platforms such as Kubernetes bring runtime complexity that traditional endpoint agents cannot easily monitor, spurring adoption of integrated scan-to-protect workflows. As DevSecOps culture matures, procurement pivots toward solutions that expose developer-friendly APIs, policy-as-code templates, and actionable feedback loops inside integrated development environments.
Complex Multi-regime Data-Residency Mandates
Divergent data-sovereignty rules force enterprises to maintain region-specific cloud instances and limit telemetry transfer, complicating unified threat detection. Impossible Cloud highlights how localization laws prompt fragmented security architectures and inflate operating costs. Financial firms must comply with GDPR, Basel III, and national banking statutes, requiring providers to offer in-country log processing, encryption key ownership, and locally certified data centers. Vendors allocate significant R&D resources to achieve compliance accreditations, which can slow feature innovation and increase barriers to entry for emerging players.
Other drivers and restraints analyzed in the detailed report include:
- Rising Cloud-Native Ransomware and Compliance Fines
- eBPF-Powered Deep-Telemetry Unlocks Runtime Trust
- Tool Sprawl and Agent Fatigue Among SecOps Teams
For complete list of drivers and restraints, kindly check the Table Of Contents.
Segment Analysis
Solutions generated a 67.35% revenue contribution in 2025, reflecting the market's preference for converged platforms that stretch from posture management to incident response. The cloud workload protection market size for solution offerings is poised to climb alongside a 27.29% CAGR in threat detection and response tooling as runtime analytics become table stakes. Comprehensive suites bundle vulnerability assessment, compliance reporting, and encryption, which drives platform stickiness and reduces total cost of ownership.
Services delivered the remaining 32.65% revenue, led by managed detection capabilities that offset talent shortages. Professional services support architectural design and migration, while managed offerings appeal to small and medium enterprises seeking operational expertise without hiring full-time staff. Tight integration between technology and services ensures faster time-to-value and creates up-sell pathways for advisory engagements, sustaining recurring revenue growth across the cloud workload protection market.
Agent-based deployments accounted for 63.25% of the cloud workload protection market share in 2025 because kernel-resident modules provide deep packet visibility and process control. They remain indispensable for high-frequency trading and other latency-sensitive workloads that demand deterministic monitoring. However, the agentless cohort is scaling at 31.15% CAGR as hyperscaler APIs mature and customers gravitate toward lighter operational footprints.
The cloud workload protection market size attached to agentless models benefits from ARM server adoption and serverless expansion, both of which challenge legacy agents. Hybrid strategies that combine in-guest sensors for mission-critical assets with API telemetry for ephemeral workloads bridge capability gaps. Microsoft's transition to Azure Monitor Agent exemplifies the industry's pivot to consolidated collectors that minimize CPU overhead while expanding data granularity
Complete Report Scope:
- By Component
- Solutions
- Monitoring and Logging
- Policy and Compliance Management
- Vulnerability Assessment
- Threat Detection and Incident Response
- Encryption, Tokenisation and Key Management
- Services
- Managed Services
- Professional Services
- Solutions
- By Security Architecture
- Agent-based
- Agentless
- Hybrid
- By Deployment Model
- Public Cloud
- Private Cloud
- Hybrid Cloud
- By Cloud Workload Type
- Virtual Machines (VMs)
- Containers
- Serverless / FaaS
- By Organization Size
- Large Enterprises
- Small and Mid-size Enterprises (SMEs)
- By End-User Vertical
- BFSI
- Healthcare and Life Sciences
- IT and Telecommunications
- Retail and Consumer Goods
- Media and Entertainment
- Energy and Utilities
- Government and Defense
- Other End-User Vertical
- By Geography
- North America
- United States
- Canada
- Mexico
- South America
- Brazil
- Argentina
- Rest of South America
- Europe
- United Kingdom
- Germany
- France
- Russia
- Rest of Europe
- Asia-Pacific
- China
- Japan
- India
- Australia and New Zealand
- South Korea
- Rest of Asia-Pacific
- Middle East and Africa
- Middle East
- GCC (Saudi Arabia, UAE, Qatar, Kuwait, Bahrain, Oman)
- Turkey
- Rest of Middle East
- Africa
- South Africa
- Nigeria
- Kenya
- Rest of Africa
- Middle East
- North America
Geography Analysis
North America held 37.70% share in 2025, anchored by mature cloud penetration, strong venture funding, and regulatory drivers such as FedRAMP. High-profile authorizations fuel adoption across civilian agencies and defense programs, reinforcing vendor legitimacy. Canada and Mexico mirror these trends, adapting U.S. frameworks to local privacy statutes and extending market reach.
Asia-Pacific is advancing at 28.9% CAGR, powered by digital-first banking in India, manufacturing digitization in China, and public-sector cloud mandates in Australia and Japan. Akamai recorded a 73% rise in web attacks across the region, with financial services absorbing more than 27 billion malicious requests in 2024. This threat landscape fosters rapid uptake of runtime protection, particularly in Singapore and South Korea, where regulators expect zero-trust adherence.
Europe maintained 27.95% revenue share in 2025, and GDPR remains the principal compliance engine. The European Data Protection Board stresses cross-border data controls, compelling multinationals to deploy region-specific telemetry pipelines. Vendors compete on localized data centers, encryption key ownership, and adherence to emerging AI Acts that govern model explainability and data retention. Eastern European and Nordic markets contribute incremental growth as cloud adoption extends into manufacturing and energy sectors.
- Orca Security
- CrowdStrike (Falcon Cloud Security)
- Palo Alto Networks (Prisma Cloud)
- Microsoft (Defender for Cloud)
- Wiz, Inc.
- Trend Micro Inc.
- Check Point Software Tech.
- McAfee LLC
- Broadcom Inc. (Symantec)
- Sophos Group plc
- Upwind
- SentinelOne
- Cisco (Protect Cloud Workload)
- Guardicore (Rapid7)
- Wiz
- Aqua Security
- Tenable (Cloud Security)
- Qualys, Inc.
- Tripwire Inc.
- LogRhythm Inc.
- Snyk Ltd.
Additional Benefits:
- The market estimate (ME) sheet in Excel format
- 3 months of analyst support
TABLE OF CONTENTS
1 INTRODUCTION
- 1.1 Study Assumptions and Market Definition
- 1.2 Scope of the Study
2 RESEARCH METHODOLOGY
3 EXECUTIVE SUMMARY
4 MARKET LANDSCAPE
- 4.1 Market Overview
- 4.2 Market Drivers
- 4.2.1 Multi-cloud adoption surge
- 4.2.2 DevSecOps shift accelerating CNAPP roll-outs
- 4.2.3 Rising cloud-native ransomware and compliance fines
- 4.2.4 Operational-cost advantage vs. on-prem tooling
- 4.2.5 eBPF-powered deep-telemetry unlocks runtime trust
- 4.2.6 Cloud insurance underwriters mandating CWPP proof
- 4.3 Market Restraints
- 4.3.1 Complex multi-regime data-residency mandates
- 4.3.2 Tool sprawl and agent fatigue among SecOps teams
- 4.3.3 Shortage of cloud-security skillsets
- 4.3.4 Rising ARM-based server adoption breaking legacy agents
- 4.4 Industry Value Chain Analysis
- 4.5 Regulatory Landscape
- 4.6 Technological Outlook
- 4.7 Porters Five Forces
- 4.7.1 Bargaining Power of Suppliers
- 4.7.2 Bargaining Power of Buyers
- 4.7.3 Threat of New Entrants
- 4.7.4 Threat of Substitutes
- 4.7.5 Intensity of Competitive Rivalry
5 MARKET SIZE AND GROWTH FORECASTS (VALUE)
- 5.1 By Component
- 5.1.1 Solutions
- 5.1.1.1 Monitoring and Logging
- 5.1.1.2 Policy and Compliance Management
- 5.1.1.3 Vulnerability Assessment
- 5.1.1.4 Threat Detection and Incident Response
- 5.1.1.5 Encryption, Tokenisation and Key Management
- 5.1.2 Services
- 5.1.2.1 Managed Services
- 5.1.2.2 Professional Services
- 5.1.1 Solutions
- 5.2 By Security Architecture
- 5.2.1 Agent-based
- 5.2.2 Agentless
- 5.2.3 Hybrid
- 5.3 By Deployment Model
- 5.3.1 Public Cloud
- 5.3.2 Private Cloud
- 5.3.3 Hybrid Cloud
- 5.4 By Cloud Workload Type
- 5.4.1 Virtual Machines (VMs)
- 5.4.2 Containers
- 5.4.3 Serverless / FaaS
- 5.5 By Organization Size
- 5.5.1 Large Enterprises
- 5.5.2 Small and Mid-size Enterprises (SMEs)
- 5.6 By End-User Vertical
- 5.6.1 BFSI
- 5.6.2 Healthcare and Life Sciences
- 5.6.3 IT and Telecommunications
- 5.6.4 Retail and Consumer Goods
- 5.6.5 Media and Entertainment
- 5.6.6 Energy and Utilities
- 5.6.7 Government and Defense
- 5.6.8 Other End-User Vertical
- 5.7 By Geography
- 5.7.1 North America
- 5.7.1.1 United States
- 5.7.1.2 Canada
- 5.7.1.3 Mexico
- 5.7.2 South America
- 5.7.2.1 Brazil
- 5.7.2.2 Argentina
- 5.7.2.3 Rest of South America
- 5.7.3 Europe
- 5.7.3.1 United Kingdom
- 5.7.3.2 Germany
- 5.7.3.3 France
- 5.7.3.4 Russia
- 5.7.3.5 Rest of Europe
- 5.7.4 Asia-Pacific
- 5.7.4.1 China
- 5.7.4.2 Japan
- 5.7.4.3 India
- 5.7.4.4 Australia and New Zealand
- 5.7.4.5 South Korea
- 5.7.4.6 Rest of Asia-Pacific
- 5.7.5 Middle East and Africa
- 5.7.5.1 Middle East
- 5.7.5.1.1 GCC (Saudi Arabia, UAE, Qatar, Kuwait, Bahrain, Oman)
- 5.7.5.1.2 Turkey
- 5.7.5.1.3 Rest of Middle East
- 5.7.5.2 Africa
- 5.7.5.2.1 South Africa
- 5.7.5.2.2 Nigeria
- 5.7.5.2.3 Kenya
- 5.7.5.2.4 Rest of Africa
- 5.7.5.1 Middle East
- 5.7.1 North America
6 COMPETITIVE LANDSCAPE
- 6.1 Market Concentration
- 6.2 Strategic Moves
- 6.3 Market Share Analysis
- 6.4 Company Profiles (includes Global level Overview, Market level overview, Core Segments, Financials as available, Strategic Information, Market Rank/Share for key companies, Products and Services, and Recent Developments)
- 6.4.1 Orca Security
- 6.4.2 CrowdStrike (Falcon Cloud Security)
- 6.4.3 Palo Alto Networks (Prisma Cloud)
- 6.4.4 Microsoft (Defender for Cloud)
- 6.4.5 Wiz, Inc.
- 6.4.6 Trend Micro Inc.
- 6.4.7 Check Point Software Tech.
- 6.4.8 McAfee LLC
- 6.4.9 Broadcom Inc. (Symantec)
- 6.4.10 Sophos Group plc
- 6.4.11 Upwind
- 6.4.12 SentinelOne
- 6.4.13 Cisco (Protect Cloud Workload)
- 6.4.14 Guardicore (Rapid7)
- 6.4.15 Wiz
- 6.4.16 Aqua Security
- 6.4.17 Tenable (Cloud Security)
- 6.4.18 Qualys, Inc.
- 6.4.19 Tripwire Inc.
- 6.4.20 LogRhythm Inc.
- 6.4.21 Snyk Ltd.
7 MARKET OPPORTUNITIES AND FUTURE OUTLOOK
- 7.1 White-space and Unmet-need Assessment

 Frost Radar™:雲端工作負載保護平台,2026 年
 雲端工作負載效率和碳感知調度軟體:市場佔有率分析、行業趨勢和統計數據以及成長預測(2026-2031 年)雲端工作負載保護平台市場規模、佔有率、成長及全球產業分析:按類型、應用和地區的洞察,2026-2034年的預測
 雲端工作負載保護市場:按工作負載類型、服務類型、組織規模、部署模式和產業分類 - 全球預測(2026-2032 年)
 2026年全球雲端工作負載保護市場報告
 雲端工作負載保護平台 (CWPP) 市場分析及預測(至 2035 年):按類型、產品類型、服務、技術、組件、應用、部署模式、最終用戶、功能和解決方案分類雲端工作負載保護市場分析及預測(至 2035 年):按類型、產品、服務、技術、組件、應用、部署類型、最終用戶和解決方案分類全球雲端工作負載保護平台市場規模、佔有率、趨勢和成長分析報告(2026-2034年)
 雲端工作負載保護市場 - 全球產業規模、佔有率、趨勢、機會及預測(按組件、部署、最終用戶、地區和競爭格局分類,2021-2031 年)全球 CWPP/CSPM 市場(2024-2030 年)