


 |
市場調查報告書
商品編碼
2115824
農業分析:市場佔有率分析、產業趨勢與統計、成長預測(2026-2031)Agriculture Analytics - Market Share Analysis, Industry Trends & Statistics, Growth Forecasts (2026 - 2031) |
||||||

※ 本網頁內容可能與最新版本有所差異。詳細情況請與我們聯繫。
根據 Mordor Intelligence 預測,農業分析市場規模將從 2025 年的 39.6 億美元成長到 2026 年的 45.2 億美元,到 2031 年將達到 87.6 億美元,2026 年至 2031 年的複合年成長率為 14.15%。
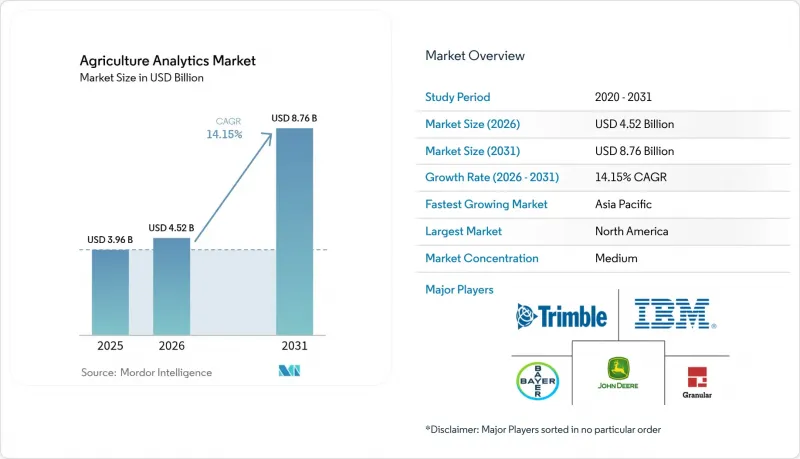
本報告按組件(解決方案、服務)、應用(農場分析、牲畜分析等)、部署模式(說明部署、以雲為中心的 SaaS、邊緣/混合部署)、農場規模(小規模農場、中型農場、大型農場)、數據源(衛星/航空圖像、無人機/無人飛行器圖像等)、分析方法(描述性、預測性(機器學習)等)和地區進行分類。
全球農業分析市場趨勢與洞察
大規模農作物農場的數位農業投資報酬率超過 20%。
在大規模農地種植中,精密農業的投資報酬率 (ROI) 持續超過 20%,這促使大規模農戶擴大分析平台的應用範圍。透過變數施肥和最佳化機械運作計劃,可以降低成本;而針對特定地塊的播種規劃則可提高產量。配備 JDLink 的農機成功案例表明,整合的遙測數據能夠產生可執行的洞察,從而實現兩位數百分比的投入成本降低。大型農場已證實的盈利正鼓勵中型農戶採用類似工具,進而推動農業分析市場的擴張。然而,儘管農業效益已得到證實,小規模農戶仍難以負擔訂閱費用。
農業零售商捆綁銷售分析即服務合約
材料供應商正將其業務模式從產品銷售轉向數據驅動的服務組合,這些組合整合了土壤檢測、遙感探測和產量預測等技術。拜耳與Source.ag的合作展示了零售商如何將人工智慧應用於溫室檢測和種子選擇最佳化。組合協議透過為供應商提供可預測的收入,並為農民提供全面的決策支持,從而推動了農業分析市場的持續需求。成功的關鍵在於農藝學的可靠性、與農場硬體的高效整合以及透明的投資回報率指標,這些指標能夠讓注重成本的客戶放心。在競爭激烈的市場環境中,那些與供應商共同開發分析工具而非轉售通用儀錶板的零售商更具優勢。
小規模農戶在一年免費期後感到疲倦
許多小規模農戶會在免費試用期內嘗試使用分析應用程式,但一旦服務轉為付費,他們就會停止使用,從而對平台用戶留存率產生負面影響。據AgUnity稱,當季節性收入無法抵銷訂閱費用時,解約率會超過40%。現金流有限、網路連線不穩定以及數位素養差距加劇了這項挑戰。服務提供者正在嘗試按付費使用制和合作模式,根據作物生長週期調整收費。如果沒有創新的定價策略,農業分析市場可能會錯失大量小規模農戶用戶。
細分市場分析
2025年,解決方案板塊將憑藉整合感測器資料、衛星影像和儀器遙測資料的農場管理套件,佔據農業分析市場67.60%的佔有率。終端用戶重視承包的功能、自動化報告和無縫更新,這些功能簡化了合規流程並提高了生產力。然而,服務板塊正以15.85%的複合年成長率快速成長,因為農場擴大將設定、資料遷移和模型調優外包給專家顧問。許多生產者缺乏解讀複雜分析結果所需的內部技能,這推動了對能夠保證農業成果的託管服務的需求。透過將農業專家和資料科學家納入決策流程,服務板塊也加深了客戶關係並提高了平台留存率。 eAgronom的顧問管理250萬公頃的農田,利用機器學習洞察來最佳化種植計劃,這充分體現了生產者對專家指導的重視。隨著基於績效的合約取代僅授權協議,農業分析市場服務業的規模預計將持續成長至 2031 年。同時,供應商不斷在其軟體包中添加人工智慧驅動的碳市場模組,力求在留住企業客戶的同時保持利潤率。
在農業分析市場中,農場分析在2025年仍將是核心應用領域,佔46.10%的市佔率。這主要得益於變數播種、養分測繪和飼料預測等技術的廣泛應用。採用這些技術最成熟的是多種作物種植型農業公司,它們能夠有效地利用高解析度衛星監測和先進建模技術管理大片農田。然而,畜牧業分析是成長最快的細分市場,年複合成長率高達15.55%。穿戴式裝置和視覺系統被引入市場,用於即時檢測牲畜的步態、發情週期和飼料轉換率。對於利潤率較低的垂直整合型肉類加工企業而言,電腦視覺框架極具吸引力,因為它可以減少檢驗工作所需的人力,並提高動物福利標準。水產養殖用戶正在部署物聯網系統,這些系統能夠實現94%的物種建議準確率,並實現自動投餵以減少廢棄物。這些創新正在拓展農業分析市場,使其不再局限於傳統田間作物,而是涵蓋了蛋白質生產的各個方面。農業零售商也正在利用需求數據來最佳化化肥庫存水平,並依靠價格最佳化演算法在旺季期間每天調整價格。
區域分析
預計到2025年,北美將佔據農業分析市場35.90%的佔有率。這得益於寬頻網路的廣泛普及、儀器遠端資訊處理技術的成熟應用以及支援技術升級的金融產品。隨著自主農業機械、排碳權檢驗和畜牧業分析技術的日益普及,預計到2031年,該地區將以13.55%的複合年成長率成長。聯邦和州政府的永續性獎勵擴大與資料檢驗實踐的支付掛鉤,從而推動了對相關平台的需求。與此同時,大規模合作社正朝著可互通的雲邊緣堆疊標準化方向發展。
亞太地區是成長最快的地區,複合年成長率達15.25%,這主要得益於中國對精密農業的津貼以及印度蓬勃發展的農業科技新創企業生態系統,該地區的市場規模高達240億美元。政府機構正在推廣遙感探測,為小規模提供諮詢服務,而低成本智慧型手機的普及也推動了遙感技術的快速應用。本土創新者正在最佳化稻田、園藝溫室和蝦池的分析技術,在廣闊的農業分析市場中創造區域性的收入來源。日本和韓國正在提供先進的機器人技術,將高頻數據傳輸到雲端,而澳洲的大型農場正在商業化試點邊緣機器人技術。
在歐洲,隨著《2027年通用農業政策》的實施,各項工作正穩步推進。智慧合規儀表板的強制使用,迫使即使是那些對科技持抵觸態度的農民也必須實現數位轉型。哥白尼衛星影像正在實現逐地塊監測的自動化,跨境溯源解決方案則促進了碳市場的參與。資金籌措機制正在支持致力於生物多樣性指標研究的新創企業,成員國的試點計畫也為鄰近地區提供了最佳實踐範本。儘管資料隱私法規的差異以及老舊設備的整合在一定程度上減緩了發展速度,但也推動了模組化架構的採用,使其能夠適應不同的監管環境。
其他好處:
- Excel格式的市場預測(ME)表
- 3個月的分析師支持
目錄
第1章:引言
- 研究假設和市場定義
- 調查範圍
第2章:調查方法
第3章執行摘要
第4章 市場狀況
- 市場概覽
- 市場促進因素
- 在大規模農作物農場中,數位農業的投資報酬率超過 20%。
- 農業用品零售商正在將分析即服務合約打包出售。
- 與歐盟 2027 年通用農業政策 (CAP) 中的補貼相關的智慧合規儀表板。
- 一個將農場碳權額貨幣化的平台
- 用於農業物聯網攝影機的邊緣人工智慧晶片,每個售價不到 5 美元。
- 重觀測間隔小於3天的衛星合成孔徑雷達衛星群
- 市場限制因素
- 經過一年的免費期後,小規模農戶開始感到許可證疲勞。
- 跨境食品供應鏈中與資料共用相關的訴訟風險
- 開發中國家特色作物中的演算法偏見
- GHz 以下頻寬的擁塞限制了感測器的回程傳輸。
- 產業價值鏈分析
- 監理情勢
- 技術展望
- 產業吸引力—五力分析
- 新進入者的威脅
- 買方/消費者議價能力
- 供應商的議價能力
- 替代品的威脅
- 競爭公司之間的競爭
- 宏觀經濟因素對市場的影響
第5章 市場規模與成長預測
- 按組件
- 解決方案
- 農業管理平台
- 產量監測與預測
- 供應鏈和可追溯性套件
- 服務
- 解決方案
- 透過使用
- 農業分析
- 牲畜分析
- 水產養殖分析
- 農業零售和農業材料價格分析
- 按安裝模式
- 現場
- 以雲端為中心的SaaS
- 邊緣/混合
- 按農場規模
- 小規模農場(少於100公頃)
- 中型農場(100-500公頃)
- 大型農場(超過500公頃)
- 按數據來源
- 衛星和航空影像
- 無人機/無人飛行器影像
- 現場物聯網感測器
- 機器遙測 CAN 總線
- 天氣和氣候資料饋送
- 透過分析方法
- 說明的
- 預測(機器學習)
- 處方(最佳化)
- 認知(基於人工智慧)
- 按地區
- 北美洲
- 美國
- 加拿大
- 墨西哥
- 南美洲
- 巴西
- 阿根廷
- 智利
- 其他南美國家
- 歐洲
- 德國
- 英國
- 法國
- 義大利
- 西班牙
- 俄羅斯
- 其他歐洲國家
- 亞太地區
- 中國
- 印度
- 日本
- 韓國
- 新加坡
- 馬來西亞
- 澳洲
- 其他亞太國家
- 中東和非洲
- 中東
- 阿拉伯聯合大公國
- 沙烏地阿拉伯
- 土耳其
- 其他中東國家
- 非洲
- 南非
- 奈及利亞
- 其他非洲國家
- 中東
- 北美洲
第6章 競爭情勢
- 市場集中度
- 策略趨勢
- 市佔率分析
- 公司簡介
- Trimble Inc.
- Deere & Company(John Deere Operations Center)
- Climate LLC(Bayer AG)
- IBM Corporation
- Granular, Inc.(Corteva)
- Proagrica Ltd(RELX)
- CropX Technologies
- Farmers Edge Inc.
- Agrostar(Stellapps)
- Raven Industries(CNH Industrial)
- Iteris Inc.
- AgEagle Aerial Systems Inc.
- Agrivi Ltd.
- Conservis Corporation
- PrecisionHawk, Inc.
- SAS Institute Inc.
- DataFarm Inc.
- CropIn Technology Solutions
- Taranis
- Planet Labs PBC
- Descartes Labs
- OneSoil AG
- xarvio Digital Farming Solutions(BASF)
- GeoPard Agriculture
- Agworld Pty Ltd.
- Farmbeat(Microsoft Corporation)
第7章 市場機會與未來趨勢
- 評估閒置頻段和未滿足的需求
According to Mordor Intelligence, the agriculture analytics market size is expected to grow from USD 3.96 billion in 2025 to USD 4.52 billion in 2026 and is forecast to reach USD 8.76 billion by 2031 at 14.15% CAGR over 2026-2031.
This report is Segmented by Component (Solutions and Services), Application (Farm Analytics, Livestock Analytics, and More), Deployment Model (On-Premise, Cloud-Centric SaaS, and Edge/Hybrid), Farm Size (Small Farms, Medium Farms, and Large Farms), Data Source (Satellite and Aerial Imagery, UAV/Drone Imagery, and More), Analytics Technique (Descriptive, Predictive (ML), and More), and Geography.
Global Agriculture Analytics Market Trends and Insights
Digital-farming ROI Crossing 20% on Large Row-Crop Farms
Return on investment for precision agriculture consistently exceeds 20% on expansive row-crop operations, incentivizing large growers to scale analytics platforms. Cost savings stem from variable-rate inputs and optimized machinery scheduling, while yield gains arise from site-specific seed prescriptions. The success of JDLink-equipped equipment illustrates how integrated telemetry feeds actionable insights that cut input use by double-digit percentages. Demonstrated profitability on large farms encourages medium-sized growers to adopt similar tools, widening the Agriculture analytics market. However, smallholders still struggle to cover subscription fees despite proven agronomic benefits.
Ag-Retailers Bundling Analytics-as-a-Service Contracts
Input suppliers are pivoting from product sales toward data-driven service bundles that merge soil tests, remote sensing, and yield forecasts. Bayer's alliance with Source.ag shows how retailers embed AI in greenhouse trials to refine seed selection. Bundled contracts provide predictable revenue for suppliers and holistic decision support for farmers, fueling recurring demand across the Agriculture analytics market. Success hinges on agronomic credibility, efficient integration with farm hardware, and transparent ROI metrics that reassure cost-conscious clients. Competitive dynamics favour retailers that co-develop analytics rather than resell generic dashboards.
Licence Fatigue Among Smallholders After 1-Year Freemium
Many smallholders trial analytics apps during free introductory periods, yet discontinue once fees begin, hurting platform retention rates. AgUnity reports churn exceeding 40% when seasonal revenues fail to offset subscription costs. Limited cash flow, inconsistent internet access, and digital literacy gaps compound the challenge. Providers are testing pay-per-use or cooperative models that align billing with crop cycles. Without creative pricing, the Agriculture analytics market risks missing a vast smallholder segment.
Other drivers and restraints analyzed in the detailed report include:
- Subsidy-Linked Smart Compliance Dashboards in EU CAP 2027
- Edge-AI Chips Below USD 5 for Ag-IoT Cameras
- Data-Sharing Litigation Risk in Cross-Border Food Chains
For complete list of drivers and restraints, kindly check the Table Of Contents.
Segment Analysis
Solutions captured 67.60% of the Agriculture analytics market share in 2025 through integrated farm-management suites that consolidate sensor feeds, satellite imagery, and equipment telemetry into single dashboards. End-users value turnkey functionality, automated reporting, and seamless updates that simplify compliance and boost productivity. However, the services segment is accelerating at a 15.85% CAGR as farms outsource configuration, data migration, and model tuning to specialist advisors. Many growers lack the in-house skills needed to interpret complex analytics, pushing demand for managed offerings that guarantee agronomic outcomes.Services also underpin platform stickiness by embedding agronomists and data scientists within the decision cycle, deepening customer relationships. eAgronom's consultants oversee 2.5 million hectares and use machine-learning insights to refine crop plans, illustrating the premium growers place on expert guidance. The Agriculture analytics market size for services is projected to expand steadily through 2031 as outcome-based contracts replace licence-only deals. Meanwhile, solution vendors continue to enrich packages with AI-driven carbon-market modules, hoping to preserve margins while retaining enterprise buyers.
Farm analytics remained the cornerstone application with a 46.10% share of the Agriculture analytics market in 2025, underpinned by widespread use of variable-rate seeding, nutrient mapping, and yield forecasting. Uptake is strongest on row-crop enterprises where large fields justify high-resolution satellite monitoring and advanced modeling. Yet livestock analytics is the fastest-growing niche at a 15.55% CAGR, as herds are fitted with wearables and vision systems that detect lameness, heat cycles, and feed efficiency in real time.Computer-vision frameworks cut inspection labor and raise welfare standards, making them attractive to vertically integrated meat processors facing tight margins. Aquaculture users are deploying IoT-enabled systems that register 94% accuracy in species recommendations and automate feeding to reduce waste. These innovations broaden the Agriculture analytics market by addressing protein production beyond traditional field crops. Agro-retailers also exploit demand data to refine fertilizer inventory levels, leaning on price-optimization algorithms that adjust offers daily during peak seasons.
Complete Report Scope:
- By Component
- Solutions
- Farm Management Platforms
- Yield Monitoring and Forecasting
- Supply-Chain and Traceability Suites
- Services
- Solutions
- By Application
- Farm Analytics
- Livestock Analytics
- Aquaculture Analytics
- Agro-retail and Input-pricing Analytics
- By Deployment Model
- On-premise
- Cloud-centric SaaS
- Edge/Hybrid
- By Farm Size
- Small Farms (<100 ha)
- Medium Farms (100-500 ha)
- Large Farms (>500 ha)
- By Data Source
- Satellite and Aerial Imagery
- UAV/Drone Imagery
- In-field IoT Sensors
- Machine Telemetry and CAN-bus
- Weather and Climate Feeds
- By Analytics Technique
- Descriptive
- Predictive (ML)
- Prescriptive (Optimization)
- Cognitive (AI-based)
- By Geography
- North America
- United States
- Canada
- Mexico
- South America
- Brazil
- Argentina
- Chile
- Rest of South America
- Europe
- Germany
- United Kingdom
- France
- Italy
- Spain
- Russia
- Rest of Europe
- Asia-Pacific
- China
- India
- Japan
- South Korea
- Singapore
- Malaysia
- Australia
- Rest of Asia-Pacific
- Middle East and Africa
- Middle East
- United Arab Emirates
- Saudi Arabia
- Turkey
- Rest of Middle East
- Africa
- South Africa
- Nigeria
- Rest of Africa
- Middle East
- North America
Geography Analysis
North America held 35.90% of the Agriculture analytics market in 2025, benefiting from widespread broadband coverage, established equipment telematics, and supportive financial products that underwrite technology upgrades. The region will expand at 13.55% CAGR through 2031 as autonomous machinery, carbon-credit verification, and livestock analytics deepen penetration. Federal and state sustainability incentives increasingly link payments to data-validated practices, boosting platform demand while large cooperatives standardize on interoperable cloud-edge stacks.
Asia-Pacific is the fastest-growing territory at 15.25% CAGR, driven by China's precision-agriculture grants and India's vibrant agtech start-up scene valued at USD 24 billion. Government agencies promote remote sensing for smallholder advisory, and low-cost smartphones facilitate rapid adoption. Local innovators tailor analytics to rice paddies, horticulture greenhouses, and shrimp ponds, creating region-specific revenue streams within the broader Agriculture analytics market. Japan and South Korea contribute advanced robotics that feed high-frequency data into cloud pipelines, while Australia's broadacre farms trial edge-robotics at commercial scale.
Europe advances steadily under the Common Agricultural Policy 2027 rules that mandate smart compliance dashboards, compelling even technology-averse growers to digitize. Copernicus imagery automates parcel monitoring, and cross-border traceability solutions facilitate carbon-market participation. Funding mechanisms support start-ups targeting biodiversity metrics, and member-state pilots showcase best-practice templates for neighboring regions. Data-privacy fragmentation and legacy equipment integration temper growth but also encourage modular architectures that can navigate heterogeneous regulatory landscapes.
- Trimble Inc.
- Deere & Company (John Deere Operations Center)
- Climate LLC (Bayer AG)
- IBM Corporation
- Granular, Inc. (Corteva)
- Proagrica Ltd (RELX)
- CropX Technologies
- Farmers Edge Inc.
- Agrostar (Stellapps)
- Raven Industries (CNH Industrial)
- Iteris Inc.
- AgEagle Aerial Systems Inc.
- Agrivi Ltd.
- Conservis Corporation
- PrecisionHawk, Inc.
- SAS Institute Inc.
- DataFarm Inc.
- CropIn Technology Solutions
- Taranis
- Planet Labs PBC
- Descartes Labs
- OneSoil AG
- xarvio Digital Farming Solutions (BASF)
- GeoPard Agriculture
- Agworld Pty Ltd.
- Farmbeat (Microsoft Corporation)
Additional Benefits:
- The market estimate (ME) sheet in Excel format
- 3 months of analyst support
TABLE OF CONTENTS
1 INTRODUCTION
- 1.1 Study Assumptions and Market Definition
- 1.2 Scope of the Study
2 RESEARCH METHODOLOGY
3 EXECUTIVE SUMMARY
4 MARKET LANDSCAPE
- 4.1 Market Overview
- 4.2 Market Drivers
- 4.2.1 Digital-farming ROI crossing 20% on large row-crop farms
- 4.2.2 Ag-retailers bundling analytics-as-a-service contracts
- 4.2.3 Subsidy-linked "smart compliance" dashboards in EU CAP 2027
- 4.2.4 On-farm carbon-credit monetisation platforms
- 4.2.5 Edge-AI chips dropping below USD 5/unit for ag-IoT cameras
- 4.2.6 Satellite SAR constellations hitting sub-3-day revisit time
- 4.3 Market Restraints
- 4.3.1 Licence fatigue among smallholders after 1-year freemium
- 4.3.2 Data-sharing litigation risk in cross-border food chains
- 4.3.3 Algorithm bias for specialty crops in developing nations
- 4.3.4 Sub-GHz spectrum crowding throttling sensor backhaul
- 4.4 Industry Value Chain Analysis
- 4.5 Regulatory Landscape
- 4.6 Technological Outlook
- 4.7 Industry Attractiveness - Porter's Five Forces Analysis
- 4.7.1 Threat of New Entrants
- 4.7.2 Bargaining Power of Buyers/Consumers
- 4.7.3 Bargaining Power of Suppliers
- 4.7.4 Threat of Substitute Products
- 4.7.5 Intensity of Competitive Rivalry
- 4.8 Impact of Macroeconomic Factors on the Market
5 MARKET SIZE AND GROWTH FORECASTS (VALUES)
- 5.1 By Component
- 5.1.1 Solutions
- 5.1.1.1 Farm Management Platforms
- 5.1.1.2 Yield Monitoring and Forecasting
- 5.1.1.3 Supply-Chain and Traceability Suites
- 5.1.2 Services
- 5.1.1 Solutions
- 5.2 By Application
- 5.2.1 Farm Analytics
- 5.2.2 Livestock Analytics
- 5.2.3 Aquaculture Analytics
- 5.2.4 Agro-retail and Input-pricing Analytics
- 5.3 By Deployment Model
- 5.3.1 On-premise
- 5.3.2 Cloud-centric SaaS
- 5.3.3 Edge/Hybrid
- 5.4 By Farm Size
- 5.4.1 Small Farms (<100 ha)
- 5.4.2 Medium Farms (100-500 ha)
- 5.4.3 Large Farms (>500 ha)
- 5.5 By Data Source
- 5.5.1 Satellite and Aerial Imagery
- 5.5.2 UAV/Drone Imagery
- 5.5.3 In-field IoT Sensors
- 5.5.4 Machine Telemetry and CAN-bus
- 5.5.5 Weather and Climate Feeds
- 5.6 By Analytics Technique
- 5.6.1 Descriptive
- 5.6.2 Predictive (ML)
- 5.6.3 Prescriptive (Optimization)
- 5.6.4 Cognitive (AI-based)
- 5.7 By Geography
- 5.7.1 North America
- 5.7.1.1 United States
- 5.7.1.2 Canada
- 5.7.1.3 Mexico
- 5.7.2 South America
- 5.7.2.1 Brazil
- 5.7.2.2 Argentina
- 5.7.2.3 Chile
- 5.7.2.4 Rest of South America
- 5.7.3 Europe
- 5.7.3.1 Germany
- 5.7.3.2 United Kingdom
- 5.7.3.3 France
- 5.7.3.4 Italy
- 5.7.3.5 Spain
- 5.7.3.6 Russia
- 5.7.3.7 Rest of Europe
- 5.7.4 Asia-Pacific
- 5.7.4.1 China
- 5.7.4.2 India
- 5.7.4.3 Japan
- 5.7.4.4 South Korea
- 5.7.4.5 Singapore
- 5.7.4.6 Malaysia
- 5.7.4.7 Australia
- 5.7.4.8 Rest of Asia-Pacific
- 5.7.5 Middle East and Africa
- 5.7.5.1 Middle East
- 5.7.5.1.1 United Arab Emirates
- 5.7.5.1.2 Saudi Arabia
- 5.7.5.1.3 Turkey
- 5.7.5.1.4 Rest of Middle East
- 5.7.5.2 Africa
- 5.7.5.2.1 South Africa
- 5.7.5.2.2 Nigeria
- 5.7.5.2.3 Rest of Africa
- 5.7.5.1 Middle East
- 5.7.1 North America
6 COMPETITIVE LANDSCAPE
- 6.1 Market Concentration
- 6.2 Strategic Moves
- 6.3 Market Share Analysis
- 6.4 Company Profiles (includes Global level Overview, Market level overview, Core Segments, Financials as available, Strategic Information, Market Rank/Share for key companies, Products and Services, and Recent Developments)
- 6.4.1 Trimble Inc.
- 6.4.2 Deere & Company (John Deere Operations Center)
- 6.4.3 Climate LLC (Bayer AG)
- 6.4.4 IBM Corporation
- 6.4.5 Granular, Inc. (Corteva)
- 6.4.6 Proagrica Ltd (RELX)
- 6.4.7 CropX Technologies
- 6.4.8 Farmers Edge Inc.
- 6.4.9 Agrostar (Stellapps)
- 6.4.10 Raven Industries (CNH Industrial)
- 6.4.11 Iteris Inc.
- 6.4.12 AgEagle Aerial Systems Inc.
- 6.4.13 Agrivi Ltd.
- 6.4.14 Conservis Corporation
- 6.4.15 PrecisionHawk, Inc.
- 6.4.16 SAS Institute Inc.
- 6.4.17 DataFarm Inc.
- 6.4.18 CropIn Technology Solutions
- 6.4.19 Taranis
- 6.4.20 Planet Labs PBC
- 6.4.21 Descartes Labs
- 6.4.22 OneSoil AG
- 6.4.23 xarvio Digital Farming Solutions (BASF)
- 6.4.24 GeoPard Agriculture
- 6.4.25 Agworld Pty Ltd.
- 6.4.26 Farmbeat (Microsoft Corporation)
7 MARKET OPPORTUNITIES AND FUTURE TRENDS
- 7.1 White-Space and Unmet-Need Assessment

 農業分析市場 - 全球市場預測,2026-2032年
 再生農業分析市場預測至2034年—按組成部分、農場規模、作物類型、應用、最終用戶和地區分類的全球分析
 2026年全球農業分析市場報告精密農業分析市場預測:至 2034 年—按組件、部署類型、農場規模、技術、應用、最終用戶和地區分類的全球分析
 農業分析市場分析及預測(至2035年):按類型、產品類型、服務、技術、組件、應用、部署類型、最終用戶和解決方案分類
 全球農業分析市場規模、佔有率、趨勢和成長分析報告(2026-2034)
 2026-2030年全球農業分析市場
 農業分析市場規模、佔有率和成長分析(按產品、農場類型、農場規模和地區分類)-產業預測,2026-2033年全球農業分析市場-2025年至2030年預測農業分析市場:依組件、農場規模、部署和地區,2026-2032年