


 |
市場調查報告書
商品編碼
2115256
學習與分析:市場佔有率分析、產業趨勢與統計、成長預測(2026-2031 年)Learning Analytics - Market Share Analysis, Industry Trends & Statistics, Growth Forecasts (2026 - 2031) |
||||||

※ 本網頁內容可能與最新版本有所差異。詳細情況請與我們聯繫。
根據 Mordor Intelligence 預測,學習分析市場規模將從 2025 年的 140.5 億美元成長到 2026 年的 169.9 億美元,然後在 2031 年達到 438.7 億美元,2026 年至 2031 年的複合年成長率為 20.90%。
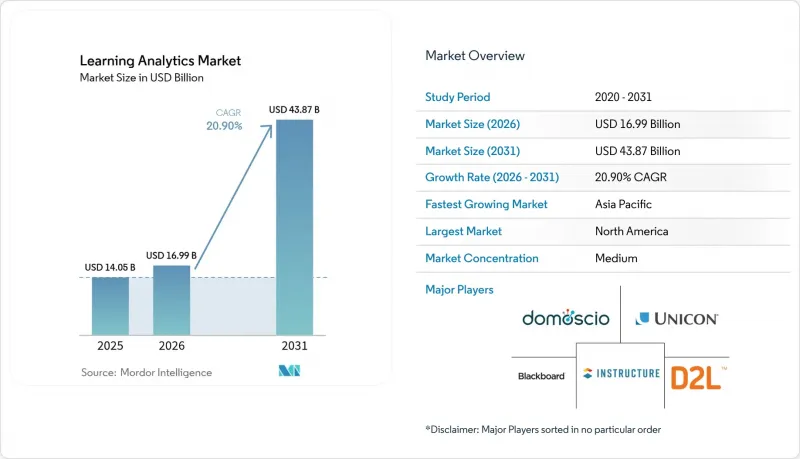
本報告按交付方式(軟體和服務)、部署方式(本地部署和雲端部署)、分析類型(說明分析、預測性分析、處方性分析)、應用領域(績效管理和學生成功支援、課程開發等)、最終用戶(學術機構和企業)以及地區進行細分。市場預測以美元計價。
全球學習分析市場趨勢與洞察
人們越來越關注提高學生的學習成果和留存率
教育機構目前正在部署分析套件,將財務永續性與畢業率指標聯繫起來,識別有風險的學生,並提出及時的干預建議。疫情後的招生壓力加劇了這項需求的迫切性,利用綜合平台的大學新生入學率提高了15%至20%。隨著28個州實施基於結果的資助計劃(公共資金與學生成功掛鉤),分析技術正從一項可有可無的創新轉變為一項營運必需品。這種轉變也滿足了認證機構和雇主的課責要求,他們將畢業生的就業成果與教育機構的聲譽緊密聯繫在一起。
基於雲端的學習分析平台和MOOC擴展
基於雲端的交付模式消除了基礎設施壁壘,使即使是小規模學校也能透過訂閱模式獲得企業級洞察。與學習管理系統的無縫整合縮短了引進週期,而即時處理則實現了大規模的個人化回饋循環。大型開放式網路課程 (MOOC) 供應商正透過持續的雲端分析來最佳化其內容,該聯盟現在在嚴格的加密標準下共享匿名資料共用。由此帶來的普及化使得學習分析市場遠遠超越了早期採用者的範疇。
資料隱私和安全合規負擔
GDPR 和 FERPA 對同意和資料處理提出了嚴格的要求,增加了法律和技術成本。教育機構必須更新其管治框架,加密詳細的學生個人記錄,並向相關人員證明演算法決策的合理性,這導致採購週期延長。同時,供應商必須對解決方案進行本地化以滿足特定地區的法規要求,這種複雜性和成本增加可能會導致全球部署的延遲。
細分市場分析
到2025年,軟體解決方案將佔總收入的67.62%,構成學習分析市場的基礎。預測儀錶板提供預警指標,自適應引擎則可實現內容個人化。在整個預測期內,服務預計將以22.52%的複合年成長率成長,超過軟體,這反映出市場對整合、培訓和維運管理的需求。教育機構越來越依賴合作夥伴來彌合技術和教育方面的差距,這凸顯了人類專業知識對於充分發揮價值仍然至關重要。
該服務的成長反映了其日益成長的複雜性。從多個來源資料擷取、調整人工智慧模型以及不斷更新合規性都需要專業技能。因此,諮詢公司和託管服務公司正在爭取長期契約,因為教育機構不僅需要許可證,更需要有保障的結果。因此,隨著平台應用的不斷深入,預計到2031年,以服務為導向的學習分析市場規模將穩定成長。
截至2025年,本地部署架構在學習分析市場仍佔70.35%的佔有率,這得益於資料主權政策和校園內已建立的基礎設施。然而,雲端解決方案正以22.96%的複合年成長率快速成長,這主要得益於其強大的容量彈性和訂閱定價模式,從而降低了整體擁有成本(TCO)。在疫情衝擊下遷移到雲端的教育機構,由於雲端提供的無縫遠端存取和快速的功能更新,不太可能再回到原來的環境。
目前,混合架構正在興起,它允許教育機構在本地伺服器上維護高度敏感的資料集,同時利用雲端運算能力進行高要求的分析。這種分層架構兼顧了隱私需求和可擴展性,促進了分階段過渡,這將進一步擴大學習分析市場。因此,能夠提供靈活部署選項的供應商對規避風險的客戶和具有前瞻性思維的客戶都極具吸引力。
區域分析
北美憑藉其成熟的教育科技生態系統、清晰的資金籌措管道以及建立信任的平衡隱私框架,預計到2025年將保持38.12%的市場佔有率,繼續保持領先地位。聯邦政府主導的U-GAIN計畫等措施正在投資可擴展的解決方案,並鼓勵教育機構將分析技術融入日常運作。加拿大各省政府的策略也呼應了這一趨勢,進一步鞏固了該地區的領先地位。
亞太地區預計將成為最具活力的市場,複合年成長率將達到21.62%。印度斥資50億盧比興建的人工智慧卓越中心以及中國的現代化政策,正集中資金和政策支援數據驅動型教育。日本和韓國等市場則憑藉其對5G技術的早期應用和高度的數位化準備度,為市場發展做出了貢獻。儘管各地區的監管規定有所不同,但該地區龐大的人口規模和政府的支持正在推動學習分析市場的持續擴張。
在歐洲,持續穩定的成長得益於符合GDPR的解決方案,這些方案在分析價值和嚴格的隱私法規之間取得了平衡。英國斥資400萬英鎊(約543萬美元)的人工智慧教師支援計劃,體現了政策層面的信心;而德國和法國則在機構層面資助數位轉型。能夠證明其嚴格合規的供應商擁有明顯的優勢,從而鞏固了學習分析市場中一個龐大且高度專業化的細分領域。
其他好處:
- Excel格式的市場預測(ME)表
- 3個月的分析師支持
目錄
第1章:引言
- 研究假設和市場定義
- 調查範圍
第2章:調查方法
第3章執行摘要
第4章 市場狀況
- 市場概覽
- 市場促進因素
- 人們越來越關注提高學生學習成果和入學率。
- 雲端學習分析平台和MOOC的擴展
- 政府和機構對教育科技的投入正在激增。
- 人工智慧/機器學習技術的進步使得獲得更深入的分析見解成為可能。
- 學習記錄儲存與XR內容的整合
- 基於績效的資金籌措模式正在推動分析技術的應用。
- 市場限制因素
- 資料隱私和安全合規負擔
- 教育領域分析專業人才短缺
- 供應商鎖定和NGDLE互通性挑戰
- 審查演算法偏差導致採購操作延誤。
- 價值鏈分析
- 監理情勢
- 技術展望
- 波特五力分析
- 評估宏觀經濟趨勢對市場的影響
- 投資分析
第5章 市場規模與成長預測
- 透過提供的服務
- 軟體
- 預測分析工具
- 說明和診斷性儀錶板
- 自適應學習平台
- 服務
- 專業服務
- 託管服務
- 軟體
- 部署模式
- 現場
- 雲
- 按分析類型
- 說明分析
- 預測分析
- 指示性分析
- 透過使用
- 績效管理和學生學業成就
- 課程與課程開發
- 評估與自適應學習
- 招募、行銷和留存率
- 最終用戶
- 學術機構
- K-12教育機構
- 高等教育機構
- 公司
- 大公司
- 中小企業
- 學術機構
- 按地區
- 北美洲
- 美國
- 加拿大
- 墨西哥
- 歐洲
- 德國
- 英國
- 法國
- 義大利
- 西班牙
- 俄羅斯
- 其他歐洲國家
- 亞太地區
- 中國
- 日本
- 印度
- 韓國
- 澳洲和紐西蘭
- 其他亞太國家
- 南美洲
- 巴西
- 阿根廷
- 其他南美國家
- 中東和非洲
- 中東
- 沙烏地阿拉伯
- 阿拉伯聯合大公國
- 土耳其
- 其他中東國家
- 非洲
- 南非
- 奈及利亞
- 其他非洲國家
- 中東
- 北美洲
第6章 競爭情勢
- 市場集中度
- 策略趨勢
- 市佔率分析
- 公司簡介
- Instructure Inc.(Canvas)
- Blackboard Inc.
- D2L Corporation(Brightspace)
- Civitas Learning Inc.
- Hobsons Inc.(Naviance)
- Domoscio
- Unicon Inc.
- Watershed Systems
- BrightBytes Inc.
- Certica Solutions Inc.
- IBM Corporation
- Oracle Corporation
- Microsoft Corporation
- SAS Institute Inc.
- Google LLC(Education)
- PowerSchool Holdings Inc.
- Turnitin LLC
- Knewton(Wiley)
- Squirrel AI
- Apereo Foundation(OpenLRS, Sakai)
第7章 市場機會與未來展望
According to Mordor Intelligence, the learning analytics market size is expected to grow from USD 14.05 billion in 2025 to USD 16.99 billion in 2026 and is forecast to reach USD 43.87 billion by 2031 at 20.90% CAGR over 2026-2031.
This report is Segmented by Offerings (Software, and Services), Deployment Mode (On-Premise, and Cloud), Analytics Type (Descriptive Analytics, Predictive Analytics, and Prescriptive Analytics), Application (Performance Management and Student Success, Curriculum and Course Development, and More), End User (Academia, and Corporate), and Geography. The Market Forecasts are Provided in Terms of Value (USD).
Global Learning Analytics Market Trends and Insights
Increasing Focus on Improving Student Outcomes and Retention
Institutions now tie financial viability to completion metrics, adopting analytics suites that flag at-risk learners and recommend timely interventions. Post-pandemic enrollment pressures heightened the urgency, and universities using comprehensive platforms have recorded 15-20% gains in first-year retention. Performance-based funding in 28 states links public allocations to student success, turning analytics from optional innovation into operational necessity. The shift also answers accountability demands from accreditors and employers who equate graduate performance with institutional reputation.
Expansion of Cloud-Based Learning Analytics Platforms and MOOCs
Cloud delivery removes infrastructure barriers, letting smaller schools obtain enterprise-grade insights via subscription models. Seamless links with learning management systems shorten deployment cycles, while real-time processing supports personalized feedback loops at scale. Massive Open Online Course providers refine content through continuous cloud analytics, and consortia now share anonymized datasets under stringent encryption standards. The resulting democratization broadens the learning analytics market far beyond early adopters.
Data Privacy and Security Compliance Burden
GDPR and FERPA impose strict consent and data-handling mandates that raise legal and technical costs. Institutions must modernize governance frameworks, encrypt granular learner records, and justify algorithmic decisions to stakeholders, slowing procurement cycles. Vendors, in turn, localize solutions to meet region-specific rules, adding complexity and cost that can delay global rollouts.
Other drivers and restraints analyzed in the detailed report include:
- Government and Institutional EdTech Funding Surge
- Advances in AI/ML Enabling Deeper Analytics Insights
- Shortage of Analytics Talent Within Education Sector
For complete list of drivers and restraints, kindly check the Table Of Contents.
Segment Analysis
Software solutions generated 67.62% of 2025 revenue, forming the backbone of the learning analytics market. Predictive dashboards surface early-warning indicators, while adaptive engines personalize content. Over the forecast horizon, services will outpace software with a 22.52% CAGR, reflecting demand for integration, training, and managed operations. Institutions increasingly rely on partners to bridge technical and pedagogical gaps, underscoring that human expertise remains essential for delivering full value.
Services growth also mirrors rising complexity: multi-source data ingestion, AI model tuning, and evergreen compliance updates require specialized skills. Consulting and managed services firms therefore secure long-term contracts as schools seek outcome guarantees rather than licenses alone. As a result, the learning analytics market size attributable to services is projected to rise steadily through 2031 alongside deepening platform penetration.
On-premise architectures retained 70.35% share of the learning analytics market size in 2025, supported by data-sovereignty policies and entrenched campus infrastructure. Yet cloud solutions are expanding at 22.96% CAGR, driven by elastic capacity and subscription pricing that lower total cost of ownership. Institutions that moved to the cloud during pandemic disruptions seldom revert, citing seamless remote access and quicker feature updates.
Hybrid frameworks now emerge, letting schools keep sensitive datasets on local servers while harnessing cloud compute for intensive analytics. This layered architecture reconciles privacy mandates with scalability, and it encourages incremental migration paths that further enlarge the learning analytics market. Vendors offering flexible deployment options thus appeal to both risk-averse and forward-leaning customers.
Complete Report Scope:
- By Offerings
- Software
- Predictive Analytics Tools
- Descriptive and Diagnostic Dashboards
- Adaptive Learning Platforms
- Services
- Professional Services
- Managed Services
- Software
- By Deployment Mode
- On-Premise
- Cloud
- By Analytics Type
- Descriptive Analytics
- Predictive Analytics
- Prescriptive Analytics
- By Application
- Performance Management and Student Success
- Curriculum and Course Development
- Assessment and Adaptive Learning
- Recruitment, Marketing and Retention
- By End User
- Academia
- K-12 Schools
- Higher Education Institutions
- Corporate
- Large Enterprises
- Small and Medium Enterprises (SMEs)
- Academia
- By Geography
- North America
- United States
- Canada
- Mexico
- Europe
- Germany
- United Kingdom
- France
- Italy
- Spain
- Russia
- Rest of Europe
- Asia-Pacific
- China
- Japan
- India
- South Korea
- Australia and New Zealand
- Rest of Asia-Pacific
- South America
- Brazil
- Argentina
- Rest of South America
- Middle East and Africa
- Middle East
- Saudi Arabia
- United Arab Emirates
- Turkey
- Rest of Middle East
- Africa
- South Africa
- Nigeria
- Rest of Africa
- Middle East
- North America
Geography Analysis
North America kept its leadership with 38.12% share in 2025 owing to mature EdTech ecosystems, clear funding channels, and balanced privacy frameworks that foster trust. Federal initiatives such as the U-GAIN program channel resources into scalable solutions, encouraging institutions to embed analytics in daily operations. Canada's provincial strategies echo this momentum, reinforcing regional dominance.
Asia-Pacific represents the most dynamic arena with a 21.62% CAGR forecast. India's ₹500 crore AI Centre of Excellence and China's modernization policies funnel capital and policy support toward data-driven instruction. Markets such as Japan and South Korea contribute through early 5G adoption and high digital readiness. Despite heterogeneous regulations, the region's demographic scale and government backing fuel sustained expansion of the learning analytics market.
Europe keeps steady growth, propelled by GDPR-compliant solutions that reconcile analytics value with strict privacy mandates. The UK's GBP 4 million (USD 5.43 million) AI teacher-support scheme illustrates policy-level confidence, while Germany and France fund institution-level digital transitions. Vendors able to demonstrate airtight compliance enjoy a clear advantage, reinforcing a specialized yet sizeable subsection of the learning analytics market.
- Instructure Inc. (Canvas)
- Blackboard Inc.
- D2L Corporation (Brightspace)
- Civitas Learning Inc.
- Hobsons Inc. (Naviance)
- Domoscio
- Unicon Inc.
- Watershed Systems
- BrightBytes Inc.
- Certica Solutions Inc.
- IBM Corporation
- Oracle Corporation
- Microsoft Corporation
- SAS Institute Inc.
- Google LLC (Education)
- PowerSchool Holdings Inc.
- Turnitin LLC
- Knewton (Wiley)
- Squirrel AI
- Apereo Foundation (OpenLRS, Sakai)
Additional Benefits:
- The market estimate (ME) sheet in Excel format
- 3 months of analyst support
TABLE OF CONTENTS
1 INTRODUCTION
- 1.1 Study Assumptions and Market Definition
- 1.2 Scope of the Study
2 RESEARCH METHODOLOGY
3 EXECUTIVE SUMMARY
4 MARKET LANDSCAPE
- 4.1 Market Overview
- 4.2 Market Drivers
- 4.2.1 Increasing focus on improving student outcomes and retention
- 4.2.2 Expansion of cloud-based learning analytics platforms and MOOCs
- 4.2.3 Government and institutional EdTech funding surge
- 4.2.4 Advances in AI/ML enabling deeper analytics insights
- 4.2.5 Integration of Learning Record Stores with XR content
- 4.2.6 Outcome-based funding models driving analytics adoption
- 4.3 Market Restraints
- 4.3.1 Data privacy and security compliance burden
- 4.3.2 Shortage of analytics talent within education sector
- 4.3.3 Vendor lock-in and NGDLE interoperability gaps
- 4.3.4 Algorithmic bias scrutiny slowing procurements
- 4.4 Value Chain Analysis
- 4.5 Regulatory Landscape
- 4.6 Technological Outlook
- 4.7 Porter's Five Forces Analysis
- 4.7.1 Bargaining Power of Suppliers
- 4.7.2 Bargaining Power of Buyers
- 4.7.3 Threat of New Entrants
- 4.7.4 Threat of Substitutes
- 4.7.5 Intensity of Competitive Rivalry
- 4.8 Assessment of the Impact of Macroeconomic Trends on the Market
- 4.9 Investment Analysis
5 MARKET SIZE AND GROWTH FORECASTS (VALUE)
- 5.1 By Offerings
- 5.1.1 Software
- 5.1.1.1 Predictive Analytics Tools
- 5.1.1.2 Descriptive and Diagnostic Dashboards
- 5.1.1.3 Adaptive Learning Platforms
- 5.1.2 Services
- 5.1.2.1 Professional Services
- 5.1.2.2 Managed Services
- 5.1.1 Software
- 5.2 By Deployment Mode
- 5.2.1 On-Premise
- 5.2.2 Cloud
- 5.3 By Analytics Type
- 5.3.1 Descriptive Analytics
- 5.3.2 Predictive Analytics
- 5.3.3 Prescriptive Analytics
- 5.4 By Application
- 5.4.1 Performance Management and Student Success
- 5.4.2 Curriculum and Course Development
- 5.4.3 Assessment and Adaptive Learning
- 5.4.4 Recruitment, Marketing and Retention
- 5.5 By End User
- 5.5.1 Academia
- 5.5.1.1 K-12 Schools
- 5.5.1.2 Higher Education Institutions
- 5.5.2 Corporate
- 5.5.2.1 Large Enterprises
- 5.5.2.2 Small and Medium Enterprises (SMEs)
- 5.5.1 Academia
- 5.6 By Geography
- 5.6.1 North America
- 5.6.1.1 United States
- 5.6.1.2 Canada
- 5.6.1.3 Mexico
- 5.6.2 Europe
- 5.6.2.1 Germany
- 5.6.2.2 United Kingdom
- 5.6.2.3 France
- 5.6.2.4 Italy
- 5.6.2.5 Spain
- 5.6.2.6 Russia
- 5.6.2.7 Rest of Europe
- 5.6.3 Asia-Pacific
- 5.6.3.1 China
- 5.6.3.2 Japan
- 5.6.3.3 India
- 5.6.3.4 South Korea
- 5.6.3.5 Australia and New Zealand
- 5.6.3.6 Rest of Asia-Pacific
- 5.6.4 South America
- 5.6.4.1 Brazil
- 5.6.4.2 Argentina
- 5.6.4.3 Rest of South America
- 5.6.5 Middle East and Africa
- 5.6.5.1 Middle East
- 5.6.5.1.1 Saudi Arabia
- 5.6.5.1.2 United Arab Emirates
- 5.6.5.1.3 Turkey
- 5.6.5.1.4 Rest of Middle East
- 5.6.5.2 Africa
- 5.6.5.2.1 South Africa
- 5.6.5.2.2 Nigeria
- 5.6.5.2.3 Rest of Africa
- 5.6.5.1 Middle East
- 5.6.1 North America
6 COMPETITIVE LANDSCAPE
- 6.1 Market Concentration
- 6.2 Strategic Moves
- 6.3 Market Share Analysis
- 6.4 Company Profiles (includes Global level Overview, Market level overview, Core Segments, Financials as available, Strategic Information, Market Rank/Share, Products and Services, Recent Developments)
- 6.4.1 Instructure Inc. (Canvas)
- 6.4.2 Blackboard Inc.
- 6.4.3 D2L Corporation (Brightspace)
- 6.4.4 Civitas Learning Inc.
- 6.4.5 Hobsons Inc. (Naviance)
- 6.4.6 Domoscio
- 6.4.7 Unicon Inc.
- 6.4.8 Watershed Systems
- 6.4.9 BrightBytes Inc.
- 6.4.10 Certica Solutions Inc.
- 6.4.11 IBM Corporation
- 6.4.12 Oracle Corporation
- 6.4.13 Microsoft Corporation
- 6.4.14 SAS Institute Inc.
- 6.4.15 Google LLC (Education)
- 6.4.16 PowerSchool Holdings Inc.
- 6.4.17 Turnitin LLC
- 6.4.18 Knewton (Wiley)
- 6.4.19 Squirrel AI
- 6.4.20 Apereo Foundation (OpenLRS, Sakai)
7 MARKET OPPORTUNITIES AND FUTURE OUTLOOK
- 7.1 White-space and Unmet-Need Assessment

 學習分析市場預測至2034年-按組件、部署模型、分析類型、資料來源、應用、最終使用者和地區分類的全球分析學習分析與洞察平台市場預測至2034年-按分析類型、資料來源、應用、部署模式、最終使用者和地區分類的全球分析
 教育與學習分析市場:按組件、部署模式、分析類型、應用程式和最終用戶分類-2026-2032年全球市場預測
 2026年全球教育與學習分析市場報告
 教育與學習分析市場規模、佔有率、趨勢和預測:按分析類型、應用、組件、部署模式、最終用戶和地區分類,2026-2034 年
 學習分析市場規模、佔有率和成長分析(按組件、部署類型、分析類型、最終用戶和地區分類)-2026-2033年產業預測
 教育與學習分析市場規模、佔有率及成長分析(按組件、部署模式、分析類型、最終用戶、應用和地區分類)-產業預測,2026-2033年