


 |
市場調查報告書
商品編碼
2115243
正面吊運機:市佔率分析、產業趨勢與統計、成長預測(2026-2031)Reach Stacker - Market Share Analysis, Industry Trends & Statistics, Growth Forecasts (2026 - 2031) |
||||||

※ 本網頁內容可能與最新版本有所差異。詳細情況請與我們聯繫。
據 Mordor Intelligence 稱,2025 年正面吊運機市場價值為 27.6 億美元,預計到 2031 年將達到 37.4 億美元,而 2026 年為 29 億美元,預測期(2026-2031 年)的複合年成長率為 5.19%。
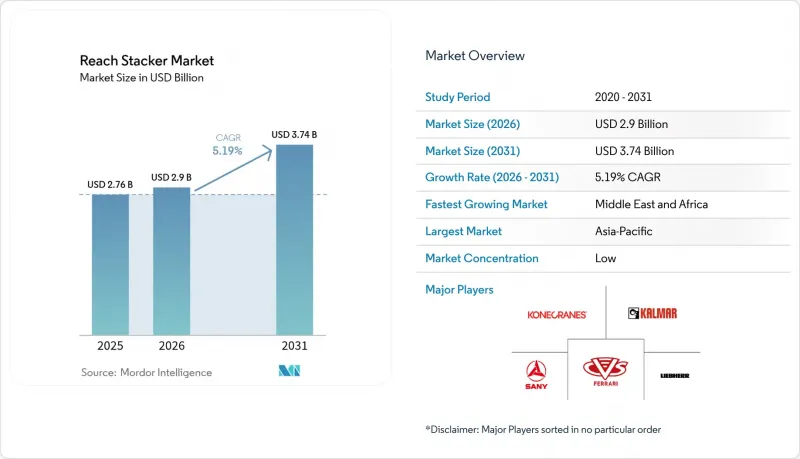
本報告按應用領域(海港、內陸貨櫃場/乾港、多式聯運鐵路貨場、工業等)、負載容量(30噸以下、30-45噸、45-100噸及其他)、動力傳動系統類型(內燃機、混合動力、純電動及其他)和地區(北美、南美及其他)進行細分。市場預測以美元計價。
全球正面吊運機市場趨勢及洞察
海港貨櫃吞吐量快速成長
2024年,全球貨櫃吞吐量激增,紅海繞行航線的延伸和運力運轉率的提高,導致對標準箱里程(TEU miles)的需求增加。上海港在2025年1月處理了創紀錄的500萬個貨櫃,中國八大主要貨櫃港口的總合吞吐量達到2.24億標準箱,年增7%,高於全球平均水準。貨物量的集中導致主要樞紐港口的設備瓶頸,碼頭尋求不依賴固定起重機設備的靈活貨櫃裝卸解決方案,因此對正面吊運機的需求不斷成長。儘管地緣政治動盪,但亞歐貿易路線的穩健性顯示貨物流動動能仍在持續。同時,在非洲等新興市場,隨著區域港口擴大處理能力以承接分流的貨物量,設備需求增加了66.71%。港口擁塞表明,在泊位有限的情況下,隨著碼頭最佳化正面吊運機的移動優勢變得日益重要。
加速船隊電氣化進程,以實現國際海事組織2030年目標
國際海事組織(IMO)提出的2030年將二氧化碳排放量減少40%的目標,正在推動港口設備的電氣化,其範圍已從船舶排放擴展到碼頭營運。零排放港口聯盟(ZEPA)的研究表明,2031年至2035年間,超過94%的新購貨櫃裝卸設備預計將是電池驅動的,碼頭營運商正在加快升級改造,以履行其脫碳承諾。 APM碼頭公司為南美洲首個100%電動碼頭部署了240台新型貨櫃裝卸設備,其中包括電動碼頭牽引車,這充分展現了正在進行的基礎設施轉型規模。 2024年,洛杉磯港部署了美國首台商用電動貨物頂部裝卸機,證明了零排放技術在大規模應用中的有效性。同時,加州的排放法規要求船舶在2027年前達到合規標準,但這項過渡計畫很大程度上取決於電網基礎設施的發展。這是因為到 2040 年,歐洲電網可能需要擴容 20% 至 50%,以滿足電氣化需求。
新興市場港口面臨債務危機,導致資本投資凍結
由於利率上升,新興市場港口面臨日益成長的債務償還成本,這加劇了資本支出方面的限制,為設備採購週期帶來了巨大阻力。世界銀行對埃及基礎設施資金籌措的分析指出,複雜的體制結構和監管壁壘阻礙了私人投資用於交通運輸部門的現代化,而這在許多新興經濟體中通用現象。杜拜環球港務集團(DP World)承諾到2029年在非洲投資30億美元,但同時也承認物流成本高昂和基礎設施差距巨大,並表示持續的資本投資對於實現營運效率目標至關重要。在負債累累的市場中,港口營運商越來越傾向於優先維護現有設備而非購置新設備,導致設備更新周期延長,技術升級進程延遲,而這些升級本可以推動對正面吊運機的需求。這些限制對那些進入國際資本市場管道有限的小規模區域港口影響尤為嚴重,造成了市場兩極化的局面:大型樞紐港口持續投資,而次級港口則推遲現代化改造計畫。
細分市場分析
到2025年,離岸港口將佔正面吊運機市場佔有率的67.92%,這反映了它們作為主要貨櫃裝卸樞紐的地位,正面吊運機在這些樞紐中為堆場作業和船舶裝載順序提供了至關重要的柔軟性。該領域的領先地位主要得益於船舶尺寸的不斷增大,這需要功能多樣的陸上設備來補充固定式起重機基礎設施,尤其是在靠泊尖峰時段期,貨櫃裝卸量超過岸橋的承載能力時。駁船和內河碼頭是成長最快的應用領域,到2031年複合年成長率將達到10.15%。這主要得益於內河航道開發項目以及連接沿海港口和內陸物流中心的多式聯運的擴張。內陸貨櫃堆場和內陸港正受益於基礎設施投資,例如猶他州規劃中的內陸碼頭和維吉尼亞的港口擴建項目,這些投資為內陸地區創造了新的設備部署機會。
工業應用領域,包括鋼鐵、木材和紙張處理,依然保持強勁勢頭,因為製造工廠需要專門的貨櫃裝卸能力來進行原料物流和成品分銷。隨著內陸基礎建設的擴展,多式聯運鐵路貨場的規模也在加速擴大,例如聯合太平洋鐵路公司的堪薩斯城貨場和伯靈頓北方聖達菲鐵路公司的巴斯托項目。這些設施需要能夠有效率地在鐵路車輛和卡車底盤之間轉移貨櫃的正面吊運機。這種針對特定應用的分類反映了供應鏈向分散式物流網路發展的更廣泛趨勢,既緩解了沿海港口的堵塞,又為以前服務不足的內陸市場創造了新的設備需求中心。
區域分析
到2025年,亞太地區將佔據正面吊運機42.08%的市佔率。這主要得益於中國八大港口2.24億標準箱的吞吐量,以及印尼、印度和越南港口吞吐能力的持續成長。該地區港口自動化技術的早期應用,尤其是上海港的堆場機器人,正在加速升級為配備豐富感測器、部分實現駕駛人的正面吊運機,使其能夠與從閘口到碼頭的數位化工作流程相協調。在日本港口,一項用於輪胎式高架起重機起重機的氫燃料電池試驗計畫已經啟動,這將推動亞洲更廣泛的生態系統向替代能源轉型。
預計中東和非洲將以8.73%的複合年成長率實現最高成長,這主要得益於沙烏地阿拉伯超過1066億美元的「2030願景」物流投資計畫以及杜拜環球港務集團(DP World)在非洲投資30億美元的港口擴建項目。諸如NEOM的全自動起重機部署以及吉達伊斯蘭港價值2.4億美元的物流園區等項目,清楚地表明該地區正在突破傳統的堆場設計模式,從規劃階段就指定使用高容量的電動或混合動力正面吊運機。儘管電力基礎設施不足和合格操作人員短缺可能會減緩部署速度,但政府的財政支持正在加速設備採購,即使面臨短期資金限制。
在北美,受多式聯運鐵路投資和日益嚴格的排放法規的推動,一個成熟且技術密集的市場環境正在形成。聯合太平洋鐵路公司和伯靈頓北方聖塔菲鐵路公司(BNSF)的巨型樞紐支撐著內陸運輸需求,而加州港務局則強制要求碼頭設施在2035年前實現零排放,預計屆時將出現大規模的電動正面正面吊運機更換需求。受「Fit-for-55」(適用於55歲以上人口)標準和港口自動化需求的影響,歐洲市場正轉向電池更換系統和遙控車輛,這促進了原始設備製造商(OEM)和軟體公司之間的合作,以滿足日益嚴格的性能標準。這些先進地區對規範標準的協同影響波及全球,並常塑造出延伸至新興市場的產品設計規範。
其他好處:
- Excel格式的市場預測(ME)表
- 3個月的分析師支持
目錄
第1章:引言
- 研究假設和市場定義
- 調查範圍
第2章:調查方法
第3章執行摘要
第4章 市場狀況
- 市場概覽
- 市場促進因素
- 海港貨櫃吞吐量快速成長
- 加速車輛電氣化進程,以實現國際海事組織2030年目標
- 內陸地區多式聯運鐵路的擴張
- 歐盟「Fit-for-55」一攬子計畫強制推行港口自動化。
- 透過人工智慧驅動的預測性維護降低總體擁有成本 (TCO)。
- 氫燃料電池動力傳動系統在大型運輸車輛的興起
- 市場限制因素
- 債務危機凍結了新興市場港口的資本投資。
- 大型充電樁電網容量瓶頸
- 鋼材價格的劇烈波動推高了整機製造商的成本。
- 非洲熟練操作人員短缺,導致部署速度放緩。
- 價值供應鏈分析
- 監理情勢
- 技術展望
- 波特五力模型
第5章 市場規模與成長預測
- 透過使用
- 港
- 內陸貨櫃存放場/陸港
- 雙層鐵路編組站
- 駁船和河運碼頭
- 工業用途(鋼鐵、木材、紙張等)
- 按噸位
- 少於30噸(低)
- 30-45噸(中型)
- 45-100噸(高)
- 超過100噸(超重型)
- 依動力傳動系統類型
- 內燃機
- 混合動力(柴油/電動)
- 純電動車
- 氫燃料電池
- 按地區
- 北美洲
- 美國
- 加拿大
- 其他北美國家
- 南美洲
- 巴西
- 阿根廷
- 其他南美國家
- 歐洲
- 德國
- 英國
- 法國
- 義大利
- 西班牙
- 荷蘭
- 其他歐洲國家
- 亞太地區
- 中國
- 印度
- 日本
- 韓國
- 其他亞太國家
- 中東和非洲
- 沙烏地阿拉伯
- 阿拉伯聯合大公國
- 埃及
- 土耳其
- 南非
- 其他中東和非洲國家
- 北美洲
第6章 競爭情勢
- 市場集中度
- 策略趨勢
- 市佔率分析
- 公司簡介
- Kalmar Corporation
- Konecranes Inc.
- Hyster-Yale, Inc.
- Liebherr Group
- SANY Group
- CVS FERRARI SPA
- Terex Corporation
- Toyota Material Handling International
- Shanghai Zhenhua Heavy Industries Company Limited(ZPMC)
- Dalian forklift Co., Ltd.
- Hoist Material Handling, Inc.
- Valla Cranes
- Taylor Group
- FTMH SPA
- SENNEBOGEN
- Linde Material Handling
- Anhui Heli Co., Ltd.
- SVETRUCK AB
- Komatsu Utility Co., Ltd.
第7章 市場機會與未來展望
According to Mordor Intelligence, the reach stacker market size was valued at USD 2.76 billion in 2025 and estimated to grow from USD 2.9 billion in 2026 to reach USD 3.74 billion by 2031, at a CAGR of 5.19% during the forecast period (2026-2031).
This report is Segmented by Application (Sea Ports, Inland Container Depots/Dry Ports, Intermodal Rail Yards, Industrial, and More), Tonnage (Less Than 30 Ton, 30 To 45 Ton, 45 To 100 Ton, and More), Powertrain Type (Internal-Combustion Engine, Hybrid, Full-Electric, and More) and Geography (North America, South America and More). The Market Forecasts are Provided in Terms of Value (USD).
Global Reach Stacker Market Trends and Insights
Rapid Container-Traffic Growth at Seaports
Global container volumes surged in 2024, with TEU-mile demand rising as Red Sea diversions extended shipping routes and intensified equipment utilization rates. Shanghai Port processed a record 5 million containers in January 2025, while China's top 8 container ports collectively handled 224 million TEU, representing 7% year-over-year growth that outpaced global averages. This traffic concentration creates equipment bottlenecks at major hubs, driving reach stacker demand as terminals seek flexible container handling solutions that operate independently of fixed crane infrastructure. The Asia-Europe trade lane's resilience despite geopolitical disruptions demonstrates sustained cargo flow momentum. At the same time, emerging markets like Africa show 66.71% growth in equipment demand as regional ports expand capacity to capture diverted volumes. Port congestion patterns suggest that reach stackers' mobility advantage becomes increasingly valuable as terminals optimize yard operations under constrained berth availability.
Accelerated Fleet Electrification to Meet IMO 2030 Targets
The International Maritime Organization's 40% CO2 reduction target by 2030 catalyzes port equipment electrification programs extending beyond ship emissions to encompass terminal operations. Zero Emission Port Alliance (ZEPA) research indicates that battery-electric container handling equipment will comprise over 94% of new purchases from 2031 to 2035, with terminal operators accelerating replacement cycles to meet decarbonization commitments. APM Terminals' deployment of 240 pieces of new container handling equipment, including electric terminal tractors for its first 100% electric terminal in South America, demonstrates the scale of infrastructure transformation underway. The Port of Los Angeles launched the nation's first commercial electric cargo top handlers in 2024, validating zero-emission technology for heavy-duty applications while California's emissions controls require vessel compliance by 2027. However, the transition timeline depends critically on grid infrastructure upgrades, as European transmission networks may require 20-50% capacity expansion by 2040 to support electrification demands.
Cap-ex Freeze at Emerging-Market Ports Amid Debt Distress
Emerging market ports face mounting capital expenditure constraints as debt servicing costs rise amid elevated interest rates, creating a significant headwind for equipment procurement cycles. The World Bank's infrastructure financing analysis for Egypt highlights complex institutional structures and regulatory barriers that impede private investment in transport sector modernization, patterns that extend across multiple emerging economies. Despite DP World's USD 3 billion African investment commitment through 2029, the company acknowledges high logistics costs and infrastructure gaps that require sustained capital deployment to achieve operational efficiency targets. Port operators in debt-distressed markets increasingly prioritize maintenance of existing equipment over new acquisitions, extending replacement cycles, and deferring technology upgrades that would otherwise drive reach stacker demand. The constraint particularly affects smaller regional ports that lack access to international capital markets, creating a bifurcated market where major hub ports continue investing while secondary facilities postpone modernization programs.
Other drivers and restraints analyzed in the detailed report include:
- Intermodal Rail Expansion in Land-locked Regions
- AI-driven Predictive Maintenance Lowering TCO
- Volatile Steel Prices Inflating OEM Costs
For complete list of drivers and restraints, kindly check the Table Of Contents.
Segment Analysis
Seaports command 67.92% market share of the reach stacker market in 2025, reflecting their role as primary container handling hubs where reach stackers provide essential flexibility for yard operations and vessel loading sequences. The segment's dominance stems from increasing vessel sizes that require versatile ground-based equipment to complement fixed crane infrastructure, particularly during peak berthing periods when container throughput demands exceed quay crane capacity. Barge and river terminals represent the fastest-growing application segment at 10.15% CAGR through 2031, driven by inland waterway development programs and intermodal transport expansion that connects coastal ports with interior distribution centers. Inland container depots and dry ports benefit from infrastructure investments like Utah's planned inland terminal and Virginia's port expansion programs, which create new equipment deployment opportunities in landlocked regions.
Industrial applications, including steel, timber, and paper handling, maintain steady demand as manufacturing facilities require specialized container handling capabilities for raw material logistics and finished goods distribution. Intermodal rail yards show accelerating growth as Union Pacific's Kansas City terminal and BNSF's Barstow project demonstrate the scale of inland infrastructure development, with these facilities requiring reach stackers that can efficiently transfer containers between rail cars and truck chassis. The application segmentation reflects broader supply chain evolution toward distributed logistics networks that reduce coastal port congestion while creating new equipment demand centers in previously underserved inland markets.
Complete Report Scope:
- By Application
- Sea Ports
- Inland Container Depots/Dry Ports
- Intermodal Rail Yards
- Barge and River Terminals
- Industrial (Steel, Timber, Paper, Etc.)
- By Tonnage
- Less Than 30 Ton (Low)
- 30 to 45 Ton (Medium)
- 45 to 100 Ton (High)
- More Than 100 Ton (Super-Heavy)
- By Powertrain Type
- Internal-Combustion Engine
- Hybrid (Diesel-Electric)
- Full-Electric
- Hydrogen Fuel Cell
- By Geography
- North America
- United States
- Canada
- Rest of North America
- South America
- Brazil
- Argentina
- Rest of South America
- Europe
- Germany
- United Kingdom
- France
- Italy
- Spain
- Netherlands
- Rest of Europe
- Asia-Pacific
- China
- India
- Japan
- South Korea
- Rest of Asia-Pacific
- Middle East and Africa
- Saudi Arabia
- United Arab Emirates
- Egypt
- Turkey
- South Africa
- Rest of Middle East and Africa
- North America
Geography Analysis
Asia-Pacific carried a 42.08% share of the reach stacker market in 2025, anchored by China's 224 million TEU throughput at its top eight ports and continuing capacity additions across Indonesia, India, and Vietnam. The region's early adoption of port automation, led by Shanghai's yard robots, accelerates upgrades toward sensor-rich and sometimes driver-optional reach stackers that harmonize with gate-to-quay digital workflows. Japanese ports have begun hydrogen fuel-cell pilot programs for rubber-tired gantries, reinforcing a broader ecosystem shift toward alternative power sources in Asia.
The Middle East and Africa will post the fastest 8.73% CAGR, underwritten by Saudi Arabia's Vision 2030 logistics outlay exceeding USD 106.6 billion and DP World's USD 3 billion African port expansion drive. Projects such as NEOM's fully automated crane installation and Jeddah Islamic Port's USD 240 million logistics park exemplify how the region is leap-frogging legacy yard designs and specifying high-capacity electric or hybrid reach stackers from inception. Capacity gaps in grid infrastructure and shortages of certified operators could temper the adoption slope, yet state-backed financing vehicles are helping expedite equipment procurement despite near-term fiscal constraints.
North America presents a mature yet tech-intensive landscape driven by intermodal rail spending and strict emissions regulations. Union Pacific's and BNSF's mega-hubs are set to anchor inland demand, while California's port authorities mandate zero-emission terminal equipment by 2035, foreshadowing large replacement orders for electric reach stackers. Europe's market, shaped by Fit-for-55 and port automation imperatives, is shifting toward battery swap systems and remote-driven fleets, fostering collaboration between OEMs and software firms to meet escalating performance benchmarks. The combined influence of these developed regions on specification standards reverberates globally, often dictating product design norms that cascade into emerging markets.
- Kalmar Corporation
- Konecranes Inc.
- Hyster-Yale, Inc.
- Liebherr Group
- SANY Group
- CVS FERRARI S.P.A.
- Terex Corporation
- Toyota Material Handling International
- Shanghai Zhenhua Heavy Industries Company Limited (ZPMC)
- Dalian forklift Co., Ltd.
- Hoist Material Handling, Inc.
- Valla Cranes
- Taylor Group
- FTMH S.P.A.
- SENNEBOGEN
- Linde Material Handling
- Anhui Heli Co., Ltd.
- SVETRUCK AB
- Komatsu Utility Co., Ltd.
Additional Benefits:
- The market estimate (ME) sheet in Excel format
- 3 months of analyst support
TABLE OF CONTENTS
1 Introduction
- 1.1 Study Assumptions and Market Definition
- 1.2 Scope of the Study
2 Research Methodology
3 Executive Summary
4 Market Landscape
- 4.1 Market Overview
- 4.2 Market Drivers
- 4.2.1 Rapid container-traffic growth at seaports
- 4.2.2 Accelerated fleet electrification to meet IMO 2030 targets
- 4.2.3 Intermodal rail expansion in land-locked regions
- 4.2.4 Port automation mandates in EU Fit-for-55 package
- 4.2.5 AI-driven predictive maintenance lowering TCO
- 4.2.6 Emergence of hydrogen fuel-cell powertrains in heavy-duty handling
- 4.3 Market Restraints
- 4.3.1 Cap-ex freeze at emerging-market ports amid debt distress
- 4.3.2 Grid-capacity bottlenecks for large-scale electric chargers
- 4.3.3 Volatile steel prices inflating OEM costs
- 4.3.4 Skilled-operator shortages slowing adoption in Africa
- 4.4 Value / Supply-Chain Analysis
- 4.5 Regulatory Landscape
- 4.6 Technological Outlook
- 4.7 Porter's Five Forces
- 4.7.1 Threat of New Entrants
- 4.7.2 Bargaining Power of Buyers
- 4.7.3 Bargaining Power of Suppliers
- 4.7.4 Threat of Substitutes
- 4.7.5 Intensity of Competitive Rivalry
5 Market Size and Growth Forecasts (Value (USD))
- 5.1 By Application
- 5.1.1 Sea Ports
- 5.1.2 Inland Container Depots/Dry Ports
- 5.1.3 Intermodal Rail Yards
- 5.1.4 Barge and River Terminals
- 5.1.5 Industrial (Steel, Timber, Paper, Etc.)
- 5.2 By Tonnage
- 5.2.1 Less Than 30 Ton (Low)
- 5.2.2 30 to 45 Ton (Medium)
- 5.2.3 45 to 100 Ton (High)
- 5.2.4 More Than 100 Ton (Super-Heavy)
- 5.3 By Powertrain Type
- 5.3.1 Internal-Combustion Engine
- 5.3.2 Hybrid (Diesel-Electric)
- 5.3.3 Full-Electric
- 5.3.4 Hydrogen Fuel Cell
- 5.4 By Geography
- 5.4.1 North America
- 5.4.1.1 United States
- 5.4.1.2 Canada
- 5.4.1.3 Rest of North America
- 5.4.2 South America
- 5.4.2.1 Brazil
- 5.4.2.2 Argentina
- 5.4.2.3 Rest of South America
- 5.4.3 Europe
- 5.4.3.1 Germany
- 5.4.3.2 United Kingdom
- 5.4.3.3 France
- 5.4.3.4 Italy
- 5.4.3.5 Spain
- 5.4.3.6 Netherlands
- 5.4.3.7 Rest of Europe
- 5.4.4 Asia-Pacific
- 5.4.4.1 China
- 5.4.4.2 India
- 5.4.4.3 Japan
- 5.4.4.4 South Korea
- 5.4.4.5 Rest of Asia-Pacific
- 5.4.5 Middle East and Africa
- 5.4.5.1 Saudi Arabia
- 5.4.5.2 United Arab Emirates
- 5.4.5.3 Egypt
- 5.4.5.4 Turkey
- 5.4.5.5 South Africa
- 5.4.5.6 Rest of Middle East and Africa
- 5.4.1 North America
6 Competitive Landscape
- 6.1 Market Concentration
- 6.2 Strategic Moves
- 6.3 Market Share Analysis
- 6.4 Company Profiles (Includes Global level Overview, Market level overview, Core Segments, Financials as available, Strategic Information, Market Rank/Share for key companies, Products and Services, and Recent Developments)
- 6.4.1 Kalmar Corporation
- 6.4.2 Konecranes Inc.
- 6.4.3 Hyster-Yale, Inc.
- 6.4.4 Liebherr Group
- 6.4.5 SANY Group
- 6.4.6 CVS FERRARI S.P.A.
- 6.4.7 Terex Corporation
- 6.4.8 Toyota Material Handling International
- 6.4.9 Shanghai Zhenhua Heavy Industries Company Limited (ZPMC)
- 6.4.10 Dalian forklift Co., Ltd.
- 6.4.11 Hoist Material Handling, Inc.
- 6.4.12 Valla Cranes
- 6.4.13 Taylor Group
- 6.4.14 FTMH S.P.A.
- 6.4.15 SENNEBOGEN
- 6.4.16 Linde Material Handling
- 6.4.17 Anhui Heli Co., Ltd.
- 6.4.18 SVETRUCK AB
- 6.4.19 Komatsu Utility Co., Ltd.
7 Market Opportunities and Future Outlook
- 7.1 White-space and Unmet-Need Assessment

 正面吊運機市場機會、成長促進因素、產業趨勢分析及2026-2035年預測。
 正面吊運機市場 - 全球產業規模、佔有率、趨勢、機會、預測:按應用、負載容量、動力傳動系統、地區和競爭格局分類,2021-2031年
 正面吊運機市場規模、佔有率和趨勢分析報告:按負載容量、動力傳動系統、應用、地區和細分市場預測(2026-2033 年)
 正面吊運機市場:按負載能力、驅動系統、銷售收入、應用、最終用戶和地區分類。
 2026年全球正面吊運機市場報告
 2026-2030年全球正面吊運機市場
 全球正面吊運機市場規模、佔有率、趨勢及成長分析報告(2026-2034)