


 |
市場調查報告書
商品編碼
2115225
蒸氣回收設備:市場佔有率分析、產業趨勢與統計、成長預測(2026-2031)Vapor Recovery Units - Market Share Analysis, Industry Trends & Statistics, Growth Forecasts (2026 - 2031) |
||||||

※ 本網頁內容可能與最新版本有所差異。詳細情況請與我們聯繫。
據 Mordor Intelligence 稱,2026 年蒸氣回收裝置 (VRU) 的市場規模估計為 10.1 億美元,高於 2025 年的 9.4 億美元,預計到 2031 年將達到 14.2 億美元。
預計 2026 年至 2031 年的複合年成長率為 6.98%。
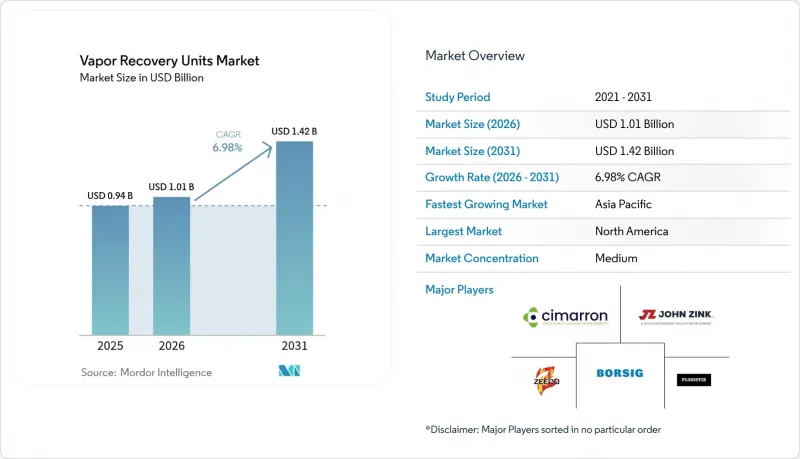
本報告按產品類型(壓縮式真空逆滲透裝置、膜分離式真空逆滲透裝置、其他)、製程儲存槽(吸附、膜分離、其他)、流量容量(50-200 Mscfd、200-500 Mscfd、其他)、安裝位置(陸上/海上)、應用(北美
全球蒸氣回收設備市場趨勢及洞察
加強甲烷排放和LDAR法規
美國環保署(EPA)的規定於2024年5月7日生效,該規定強制要求新建和維修油氣設施的排放量減少95%。此外,「超級發送器計畫」要求業者在指定的時間內修正排放量超過100公斤/小時的排放羽流。加拿大類似的框架於2025年3月26日生效,適用於434個石油設施,並將在2045年前減少48.8萬噸揮發性有機化合物(VOCs)的排放。加之甲烷排放附加費從2024年的每噸900美元提高到2026年的每噸1500美元,這些措施使得快速蒸氣回收在經濟上可行,即使對於獲利能力較低的油井也是如此。透過衛星、無人機和地面觀測(OGI)進行的第三方監測增加了違規風險,從而加速了對蒸氣回收設備的需求。
透過回收富氣獲得經濟投資回報
回收的蒸氣通常超過管道級熱值標準,並且往往含有利潤豐厚的天然氣凝液(NGL)成分。這使得在頁岩地層中,安裝成本為10萬美元的項目可獲得13.2萬美元的回報,投資回收期為9個月。現場研究表明,在保持獲利能力的情況下,天然氣處理設施中94.9%的甲烷損失可以減少,總價值每年可達840萬美元。現貨天然氣價格上漲、碳排放處罰更加嚴格以及誘人的液體排放信用額度,正在形成“三重效益”,從而推動蒸氣回收設備市場的發展。
壓縮式撬裝設備的高資本投資成本
預計到2024年,壓縮式採油系統將占到總收入的近一半,但每個站點的初始投資額超過10萬美元。這項高昂成本可能導致美國多達30萬口日產量低於15桶的邊際油井停產。供應商正透過租賃設備和租賃購買模式來減輕這一負擔,而噴射式採油系統則無需旋轉機械,從而降低了資本投資和維護成本。
細分市場分析
預計到2025年,壓縮式蒸汽回收裝置將佔蒸氣回收設備市場銷售額的45.55%,這反映了其在儲罐、管道和終端設施中的可靠性。同時,膜式蒸氣回收裝置(VRU)正以8.34%的複合年成長率成長,其優勢包括無需燃料運行和面積小,便於在空間受限的場地進行撬裝安裝。預計到2031年,膜式蒸氣回收裝置市場規模將達到2.81億美元,主要得益於石墨烯增強型組件的普及,可將能耗降低50%以上。噴射器/文丘里裝置正在氣壓動力;而低溫蒸汽回收裝置則在富含液化天然氣(NGL)的生產區域蓬勃發展,因為這些區域需要更深層次的冷卻循環。
從混合基質膜到變頻驅動(VFD)渦捲式壓縮機,材料技術的不斷進步正在縮小與傳統壓縮方式在營運成本(OPEX)方面的差距。數位孿生模型能夠即時最佳化設置,延長零件壽命,並將意外停機時間減少高達30%。這種技術變革正促使客戶評估標準從前期成本轉向生命週期經濟效益,加速薄膜技術在蒸氣回收市場的應用。
預計到2025年,活性碳吸附將佔銷售額的41.12%。這主要歸功於其接近100%的回收效率,能夠滿足95%的VOC排放法規要求。雖然目前採用薄膜分離技術的蒸氣回收系統的市佔率仍然較低,但其成長速度最快,年複合成長率高達12.15%,這主要得益於滲透率超過10,000 GPU的「固有細孔聚合物(POM)」薄膜。吸收塔在苯含量高的應用中仍發揮重要作用,但在相變冷卻經濟性較佳的場合,冷凝系統則得到了廣泛應用。
營運商正在權衡能耗與維護複雜性。吸附法需要定期進行活性碳再生,而膜分離法雖然避免了停機時間,但需要採取措施防止結垢。新興的人工智慧監控系統能夠及早發現供水品質偏差,從而提高系統運轉率,並允許營運商輪換使用撬裝設備而非關閉設備,進而推動蒸氣回收市場的進一步成長。
區域分析
北美地區在嚴格的環保署(EPA)法規和豐富的頁岩氣產量(可產生高價值的冷凝油蒸氣)的支持下,預計到2025年將以38.25%的市場佔有率引領蒸氣回收設備市場。加拿大2025年生效的揮發性有機化合物(VOC)法規涵蓋434個地區,進一步鞏固了其作為監管堡壘的地位,即使獲利能力較低的油井難以達到合規要求,也能確保資本流入。強大的服務網路、豐富的天然氣開採能力以及活躍的數位化技術試點項目,使該地區繼續保持創新中心的地位。
亞太地區是成長的主要驅動力,預計2031年複合年成長率將達到8.07%。 2022年,中國甲烷排放量激增至4 Tg,隨後實施了全國性的監測系統。同時,韓國的苯排放法規和印度的無污染燃料計畫正在擴大目標需求。隨著港口和碼頭在全球供應鏈中區域整合程度的提高,遵守國際標準也進一步推動了蒸氣回收設備市場的發展。
在歐洲,強勁的需求得益於脫碳目標和煉油廠維修。同時,中東和非洲的進展得益於國有石油公司(NOC)對「零常規燃燒」的承諾以及大規模陸上天然氣田酸性氣體蒸汽回收裝置(VRU)的維修。南美洲浮式生產儲油卸油設備(FPSO)的激增正在擴大海上油氣市場的前景,僅巴西一國就將在2028年佔據浮體式生產裝置訂單的大部分佔有率。總體而言,隨著甲烷應對措施的日益綜合,蒸氣回收作為一種通用的減排措施正受到越來越多的關注。
其他福利
- Excel格式的市場預測(ME)表
- 3個月的分析師支持
目錄
第1章:引言
- 研究假設和市場定義
- 調查範圍
第2章:調查方法
第3章執行摘要
第4章 市場狀況
- 市場概覽
- 市場促進因素
- 加強甲烷排放和LDAR法規
- 透過回收富氣獲得經濟投資回報
- 加強對汽油碼頭揮發性氣體的監管(亞洲)
- 上游作業中實現零常規火炬燃燒的目標
- 利用數位孿生最佳化運作
- 原油碳排放強度的自願評估
- 市場限制因素
- 壓縮撬裝設備的高額資本支出
- 與腐蝕性酸性氣體相關的操作挑戰
- 頁岩氣鑽井現場離網供電的限制
- 碳市場中價格低廉的燃燒排放額度
- 供應鏈分析
- 監理情勢
- 技術展望
- 波特五力模型
第5章 市場規模與成長預測
- 依產品類型
- 壓縮型VRU
- 噴射器/文丘里式VRU
- 膜分離型VRU
- 凝聚式/低溫VRU
- 吸收型(碳)VRU
- 透過工藝技術
- 吸附
- 吸收
- 濃縮版
- 膜分離
- 按流量容量
- 50Mscfd 或更少
- 50~200Mscfd
- 200~500Mscfd
- 500Mscfd 或以上
- 按安裝位置
- 陸上
- 離岸
- 透過使用
- 加工廠
- 儲存槽
- 裝卸
- 管道和收集
- 火炬氣回收
- 最終用戶
- 上游產業(石油和天然氣)
- 下游產業(煉油、碼頭)
- 化工/石油化工
- 其他(生質燃料、藥品)
- 按地區
- 北美洲
- 美國
- 加拿大
- 墨西哥
- 歐洲
- 德國
- 英國
- 法國
- 義大利
- 俄羅斯
- 其他歐洲國家
- 亞太地區
- 中國
- 印度
- 日本
- 韓國
- ASEAN
- 其他亞太國家
- 南美洲
- 巴西
- 阿根廷
- 其他南美國家
- 中東和非洲
- 沙烏地阿拉伯
- 阿拉伯聯合大公國
- 南非
- 埃及
- 其他中東和非洲國家
- 北美洲
第6章 競爭情勢
- 市場集中度
- 策略趨勢(併購、聯盟、購電協議)
- 市場佔有率分析(主要公司的市場排名和佔有率)
- 公司簡介
- ALMA Carbovac
- BORSIG Membrane Technology
- John Zink Company
- Symex GmbH & Co. KG
- Aereon
- Hy-Bon Engineering
- Cool Sorption A/S
- VOCZero Ltd.
- Zeeco
- Flogistix
- Kappa GI
- Kilburn Engineering
- Cimarron Energy Inc.
- Forum Energy Technologies
- DNOW/Power Service
- Blackmer(PSG Dover)
- GARO(Atlas Copco)
- LeROI Gas Compressors
- PESCO
- Gardner Denver
- Linde Engineering
第7章 市場機會與未來展望
According to Mordor Intelligence, vapor recovery units market size in 2026 is estimated at USD 1.01 billion, growing from 2025 value of USD 0.94 billion with 2031 projections showing USD 1.42 billion, growing at 6.98% CAGR over 2026-2031.
This report is Segmented by Product Type (Compression-Based VRU, Membrane Separation VRU, and More), Process Technology (Adsorption, Membrane Separation, and More), Flow-Rate Capacity (50 To 200 Mscfd, 200 To 500 Mscfd, and More), Installation Site (Onshore and Offshore), Application (Storage Tanks, and More), End-User (Downstream, and More), and Geography (North America, Asia-Pacific, and More).
Global Vapor Recovery Units Market Trends and Insights
Tightening Methane-Fee & LDAR Regulations
The EPA rule mandating 95% reductions for new and modified oil and gas sources took effect on May 7, 2024, and is reinforced by a Super Emitter Program that obliges operators to remediate plumes exceeding 100 kg/h within prescribed time windows. Canada's analogous framework, effective March 26, 2025, will apply to 434 petroleum facilities and reduce 488,000 tonnes of VOCs through 2045. Coupled with a Methane Waste Emissions Charge that rises from USD 900 per ton in 2024 to USD 1,500 per ton by 2026, these measures make prompt vapor capture financially rational even at marginal wells. Third-party satellite, drone, and OGI surveillance heightens non-compliance risk, thereby accelerating demand for vapor recovery units.
Economic Pay-Back from Recovered Rich Gas
Recovered vapors typically exceed pipeline-quality BTU specifications and often contain monetizable NGL fractions, delivering project revenues of USD 132,000 against installed costs of USD 100,000 with nine-month payouts in shale plays. Field studies indicate that 94.9% of methane losses at gas-processing facilities can be abated profitably, collectively valued at USD 8.4 million annually. Rising spot gas prices, escalating carbon penalties, and attractive liquids credits are forging a triple dividend that fortifies the vapor recovery units market.
High CAPEX for Compression Skids
Compression-dominant systems, which account for nearly half of 2024 revenue, require upfront expenditures exceeding USD 100,000 per site, a hurdle that could shut in up to 300,000 US marginal wells producing 15 bbl/day or less. Vendors ease the burden through rental fleets and lease-to-own structures, while ejector-based packages eliminate the need for rotating machinery, thereby curtailing capex and maintenance.
Other drivers and restraints analyzed in the detailed report include:
- Stricter Gasoline Terminal Vapor Rules (Asia)
- Up-Stream Zero-Routine Flaring Targets
- Corrosive Sour-Gas Service Issues
For complete list of drivers and restraints, kindly check the Table Of Contents.
Segment Analysis
Compression packages accounted for 45.55% of 2025 sales in the vapor recovery units market, reflecting reliability across tank, pipeline, and terminal sites. Membrane VRUs, however, are growing at an 8.34% CAGR and benefit from fuel-free operation and compact footprints that allow skid mounting on congested pads. The vapor recovery units market size for membrane systems is projected to reach USD 281 million by 2031, driven by graphene-enhanced modules that reduce energy consumption by more than 50%. Ejector/Venturi units are carving a niche at low-pressure remote leases where pneumatic power is readily available, and cryogenic VRUs thrive in NGL-rich plays that justify deeper cooling cycles.
Continued materials progress, ranging from mixed-matrix membranes to scroll compressors with variable-frequency drives, has narrowed OPEX gaps against legacy compression. Digital twin models optimize set points in real-time, extending component life and reducing unplanned downtime by up to 30%. These technology inflections shift customer evaluations toward life-cycle economics over first cost, accelerating membrane traction within the vapor recovery units market.
Activated-carbon adsorption accounted for 41.12% of 2025 revenue, thanks to near-unity recovery efficiencies that meet 95% VOC rules. The vapor recovery units market share for membrane separation remains lower today but is climbing fastest at a 12.15% CAGR, driven by polymer-of-intrinsic-microporosity films that post permeabilities above 10,000 GPU. Absorption towers remain relevant in benzene-rich service, while condensation units thrive where phase-change economics make chilling more attractive.
Operators weigh the energy draw against the complexity of maintenance. Adsorption demands periodic carbon regeneration, whereas membranes avoid cycle downtime but must contend with fouling. Emerging AI-enabled monitors flag feed-quality excursions early, allowing operators to rotate skids rather than shut down, thereby boosting system uptime and further driving the growth of the vapor recovery units market.
Complete Report Scope:
- By Product Type
- Compression-based VRU
- Ejector/Venturi VRU
- Membrane Separation VRU
- Condensation/Cryogenic VRU
- Absorption (Carbon) VRU
- By Process Technology
- Adsorption
- Absorption
- Condensation
- Membrane Separation
- By Flow-rate Capacity
- Below 50 Mscfd
- 50 to 200 Mscfd
- 200 to 500 Mscfd
- Above 500 Mscfd
- By Installation Site
- Onshore
- Offshore
- By Application
- Processing Plants
- Storage Tanks
- Loading and Unloading
- Pipelines and Gathering
- Flaring Gas Recovery
- By End-User
- Upstream Oil and Gas
- Downstream (Refining, Terminals)
- Chemical and Petrochemical
- Others (Biofuels, Pharma)
- By Geography
- North America
- United States
- Canada
- Mexico
- Europe
- Germany
- United Kingdom
- France
- Italy
- Russia
- Rest of Europe
- Asia-Pacific
- China
- India
- Japan
- South Korea
- ASEAN Countries
- Rest of Asia-Pacific
- South America
- Brazil
- Argentina
- Rest of South America
- Middle East and Africa
- Saudi Arabia
- United Arab Emirates
- South Africa
- Egypt
- Rest of Middle East and Africa
- North America
Geography Analysis
North America led the vapor recovery units market with 38.25% share in 2025, powered by rigorous EPA mandates and prolific shale output that yields high-value condensate vapors. Canada's 2025 VOC rule, covering 434 sites, reinforces a regulatory bulwark that sustains capital flows even as marginal wells wrestle with compliance economics. Robust service networks, abundant gas takeaway, and active digital-tech pilots keep the region at the center of innovation.
The Asia-Pacific region is the pace-setter, with an 8.07% CAGR projected to 2031. China's methane surge to 4 Tg in 2022 has triggered nationwide monitoring schemes, while South Korea's benzene controls and India's clean-fuel policies are expanding the addressable demand. Regional integration into global supply chains means ports and terminals must match international standards, further enlarging the vapor recovery units market.
Europe maintains solid demand through decarbonization targets and refinery revamps, whereas the Middle East & Africa progress is anchored by zero-routine-flaring pledges from NOCs and by Sour-Gas VRU retrofits on giant onshore fields. South America's FPSO wave amplifies offshore prospects, with Brazil alone accounting for the majority of floating production orders through 2028. Collectively, converging methane strategies spotlight vapor recovery as a universal mitigation lever.
- ALMA Carbovac
- BORSIG Membrane Technology
- John Zink Company
- Symex GmbH & Co. KG
- Aereon
- Hy-Bon Engineering
- Cool Sorption A/S
- VOCZero Ltd.
- Zeeco
- Flogistix
- Kappa GI
- Kilburn Engineering
- Cimarron Energy Inc.
- Forum Energy Technologies
- DNOW / Power Service
- Blackmer (PSG Dover)
- GARO (Atlas Copco)
- LeROI Gas Compressors
- PESCO
- Gardner Denver
- Linde Engineering
Additional Benefits:
- The market estimate (ME) sheet in Excel format
- 3 months of analyst support
TABLE OF CONTENTS
1 Introduction
- 1.1 Study Assumptions & Market Definition
- 1.2 Scope of the Study
2 Research Methodology
3 Executive Summary
4 Market Landscape
- 4.1 Market Overview
- 4.2 Market Drivers
- 4.2.1 Tightening methane-fee & LDAR regulations
- 4.2.2 Economic pay-back from recovered rich gas
- 4.2.3 Stricter gasoline terminal vapor rules (Asia)
- 4.2.4 Up-stream zero-routine flaring targets
- 4.2.5 Digital-twin uptime optimisation
- 4.2.6 Voluntary crude carbon-intensity scoring
- 4.3 Market Restraints
- 4.3.1 High CAPEX for compression skids
- 4.3.2 Corrosive sour-gas service issues
- 4.3.3 Off-grid power constraints at shale pads
- 4.3.4 Cheap flaring credits in carbon markets
- 4.4 Supply-Chain Analysis
- 4.5 Regulatory Landscape
- 4.6 Technological Outlook
- 4.7 Porter's Five Forces
- 4.7.1 Bargaining Power of Suppliers
- 4.7.2 Bargaining Power of Consumers
- 4.7.3 Threat of New Entrants
- 4.7.4 Threat of Substitute Products & Services
- 4.7.5 Intensity of Competitive Rivalry
5 Market Size & Growth Forecasts
- 5.1 By Product Type
- 5.1.1 Compression-based VRU
- 5.1.2 Ejector/Venturi VRU
- 5.1.3 Membrane Separation VRU
- 5.1.4 Condensation/Cryogenic VRU
- 5.1.5 Absorption (Carbon) VRU
- 5.2 By Process Technology
- 5.2.1 Adsorption
- 5.2.2 Absorption
- 5.2.3 Condensation
- 5.2.4 Membrane Separation
- 5.3 By Flow-rate Capacity
- 5.3.1 Below 50 Mscfd
- 5.3.2 50 to 200 Mscfd
- 5.3.3 200 to 500 Mscfd
- 5.3.4 Above 500 Mscfd
- 5.4 By Installation Site
- 5.4.1 Onshore
- 5.4.2 Offshore
- 5.5 By Application
- 5.5.1 Processing Plants
- 5.5.2 Storage Tanks
- 5.5.3 Loading and Unloading
- 5.5.4 Pipelines and Gathering
- 5.5.5 Flaring Gas Recovery
- 5.6 By End-User
- 5.6.1 Upstream Oil and Gas
- 5.6.2 Downstream (Refining, Terminals)
- 5.6.3 Chemical and Petrochemical
- 5.6.4 Others (Biofuels, Pharma)
- 5.7 By Geography
- 5.7.1 North America
- 5.7.1.1 United States
- 5.7.1.2 Canada
- 5.7.1.3 Mexico
- 5.7.2 Europe
- 5.7.2.1 Germany
- 5.7.2.2 United Kingdom
- 5.7.2.3 France
- 5.7.2.4 Italy
- 5.7.2.5 Russia
- 5.7.2.6 Rest of Europe
- 5.7.3 Asia-Pacific
- 5.7.3.1 China
- 5.7.3.2 India
- 5.7.3.3 Japan
- 5.7.3.4 South Korea
- 5.7.3.5 ASEAN Countries
- 5.7.3.6 Rest of Asia-Pacific
- 5.7.4 South America
- 5.7.4.1 Brazil
- 5.7.4.2 Argentina
- 5.7.4.3 Rest of South America
- 5.7.5 Middle East and Africa
- 5.7.5.1 Saudi Arabia
- 5.7.5.2 United Arab Emirates
- 5.7.5.3 South Africa
- 5.7.5.4 Egypt
- 5.7.5.5 Rest of Middle East and Africa
- 5.7.1 North America
6 Competitive Landscape
- 6.1 Market Concentration
- 6.2 Strategic Moves (M&A, Partnerships, PPAs)
- 6.3 Market Share Analysis (Market Rank/Share for key companies)
- 6.4 Company Profiles (includes Global level Overview, Market level overview, Core Segments, Financials as available, Strategic Information, Products & Services, and Recent Developments)
- 6.4.1 ALMA Carbovac
- 6.4.2 BORSIG Membrane Technology
- 6.4.3 John Zink Company
- 6.4.4 Symex GmbH & Co. KG
- 6.4.5 Aereon
- 6.4.6 Hy-Bon Engineering
- 6.4.7 Cool Sorption A/S
- 6.4.8 VOCZero Ltd.
- 6.4.9 Zeeco
- 6.4.10 Flogistix
- 6.4.11 Kappa GI
- 6.4.12 Kilburn Engineering
- 6.4.13 Cimarron Energy Inc.
- 6.4.14 Forum Energy Technologies
- 6.4.15 DNOW / Power Service
- 6.4.16 Blackmer (PSG Dover)
- 6.4.17 GARO (Atlas Copco)
- 6.4.18 LeROI Gas Compressors
- 6.4.19 PESCO
- 6.4.20 Gardner Denver
- 6.4.21 Linde Engineering
7 Market Opportunities & Future Outlook
- 7.1 White-space & Unmet-Need Assessment

 蒸氣回收服務市場:按製程、應用、營運模式和區域分類
 蒸氣回收適配器市場規模、佔有率和成長分析:按適配器類型、材質、應用、最終用戶、地區和行業預測,2026-2033年
 2026-2034年全球蒸氣回收裝置(VRU)市場規模、佔有率、趨勢和成長分析報告
 蒸氣回收裝置市場 - 全球產業規模、佔有率、趨勢、機會及預測(按應用、最終用途、技術、地區和競爭格局分類,2021-2031年)
 蒸氣回收裝置(VRU)市場規模、佔有率及成長分析(按類型、最終用途產業、技術、運作模式及地區分類)-2026-2033年產業預測
 儲油氣回收裝置市場機會、成長促進因素、產業趨勢分析及預測(2025-2034年)油氣蒸氣回收裝置市場機會、成長促進因素、產業趨勢分析及預測(2025-2034年)
 全球蒸氣回收服務市場蒸汽回收裝置市場機會、成長動力、產業趨勢分析及 2025 - 2034 年預測
 全球蒸氣回收設備市場(按類型、應用、最終用途行業和地區分類)- 預測至 2030 年