


 |
市場調查報告書
商品編碼
2115039
油液狀態監測:市場佔有率分析、產業趨勢與統計、成長預測(2026-2031)Oil Condition Monitoring - Market Share Analysis, Industry Trends & Statistics, Growth Forecasts (2026 - 2031) |
||||||

※ 本網頁內容可能與最新版本有所差異。詳細情況請與我們聯繫。
根據 Mordor Intelligence 預測,石油狀態監測市場規模將從 2025 年的 18.8 億美元成長到 2026 年的 19.9 億美元,然後在 2031 年達到 26.4 億美元,2026 年至 2031 年的複合年成長率為 5.78%。
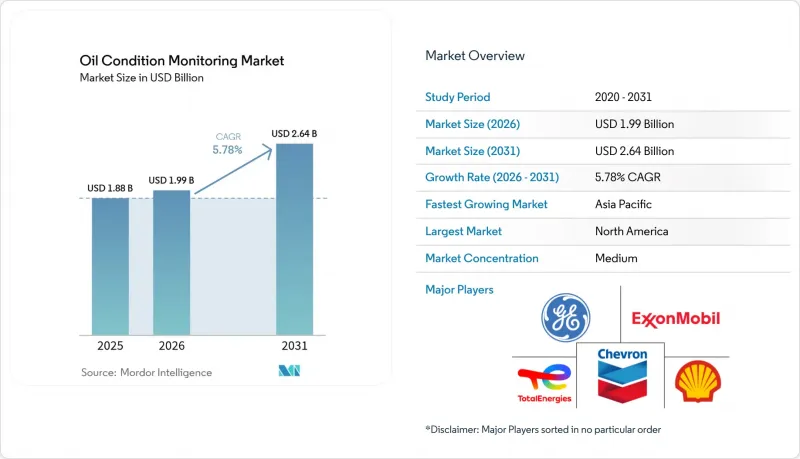
本報告按抽樣方法(現場、異地)、產品類型(渦輪機、引擎、齒輪系統等)、感測器/測量方法(黏度感測器、溫度感測器、壓力感測器等)、服務提供方式(硬體、軟體、實驗室測試服務)、最終用戶產業和地區進行細分。市場預測以美元計價。
全球油氣狀況監測市場趨勢及洞察
OEM保固要求
北美主要商用車原始設備製造商 (OEM) 目前正將延長引擎保固期與定期提交油液光譜分析報告掛鉤。這加速了經銷商網路對油液狀態監測技術的採用。該方案透過及早檢測污染和磨損來降低 OEM 的責任風險,同時幫助車輛營運商延長引擎壽命並最佳化換油週期。領先的 8 級卡車製造商現在將感測器套件與動力傳動系統服務合約捆綁銷售,這促使獨立維修店採用能夠捕獲 OEM 遠端資訊處理資料的雲端儀錶板。隨著保固帶來的成本節約透過預測模型量化,財務長們正在將原本用於被動維修的預算重新分配給預測分析服務的訂閱。擁有 300 輛或以上車輛的車隊採用率最高,因為在這些車隊中,感測器投資可以快速攤提。
離岸風力發電齒輪箱故障
在歐洲離岸風力發電領域,每颱風機齒輪箱更換成本超過20萬美元,這使得部署線上金屬顆粒監測器成為一項極具商業價值的舉措。營運商正利用即時金屬顆粒計數數據,將基於日曆的換油週期轉變為數據驅動的干預措施,從而減少了在嚴酷的北海環境中對起重船的需求。感測器改裝與SCADA平台整合,將數據傳輸到數位孿生模型中,該模型可同時模擬扭矩、振動和潤滑油污染。由於歐盟和英國的補貼計畫對運作不利,營運商更傾向於選擇能夠保證高服務係數的技術。提供預校準AI模型的供應商正日益受到歡迎,因為這些模型可以降低試運行的複雜性,並將投資回收期縮短至18個月以內。
東協中小企業線上感測器的資本投資負擔
儘管線上油品狀態監測系統具有明顯的營運優勢,但東協市場的中小企業仍面臨著巨大的資本投資限制,這阻礙了該系統的普及應用。根據《2024年東協中小企業政策指數》,中小企業佔區域就業的64.6%和GDP的38.3%,但它們在資金籌措卻持續面臨挑戰。線上感測器系統通常每個監測點需要5000至15000美元的初始投資,這對利潤微薄的製造型中小企業來說是一個巨大的財務障礙。該地區對石化燃料的高度依賴,加上預計到2035年石油需求將增加20%,以及預計每年進口成本將超過2000億美元,進一步加劇了成本壓力,限制了企業在技術投資方面的可支配支出。
細分市場分析
到2025年,異地實驗室分析將佔石油狀態監測市場59.30%的佔有率,因為重工業繼續依賴經認證的實驗室進行全面的元素和污染物分析。雖然這種模式能夠提供詳細的資料集,但採樣和決策之間的延遲有時會導致被動維護。大規模煉油廠和發電廠與區域實驗室簽訂年度契約,涵蓋ICP、FTIR和鐵密度測試。然而,宅配延遲和手動資料輸入仍然是挑戰。
現場檢測系統是成長最快的細分市場,年複合成長率高達 9.02%,這主要得益於物聯網賦能的微型實驗室減少了面積和成本。攜帶式黏度計和紅外線光譜儀現在都配備了防震外殼,使技術人員能夠將處理時間從幾天縮短到幾分鐘。對於採用連續生產製程的工廠而言,能夠即時調整負載曲線和過濾系統的封閉回路型回授系統尤其重要。訂閱模式提供校準服務和雲端儀錶板,可跨多個地點存檔歷史趨勢資料。到 2031 年,現場檢測系統的擴展可能會降低中型製造商在油品狀態監測方面對外部實驗室的市場佔有率,而實驗室則可能將其業務轉向資料科學服務。
引擎仍是潤滑油狀態監測領域最大的應用領域,預計到2025年將佔潤滑油狀態監測市場佔有率的31.80%。由於高速旋轉部件會產生金屬磨損、煙塵和酸性物質,因此早期檢測至關重要。在商船、礦用運輸卡車和備用發電機中,氣缸套磨損模型正擴大被納入企業維護計劃。低硫燃料和生質燃料混合燃料的普及延長了換油週期,這進一步凸顯了精確了解潤滑油化學特性的必要性。
隨著工廠自動化和移動設備的日益複雜化,液壓系統市場預計將以8.72%的複合年成長率成長。射出成型線和精密壓力機中使用的電液執行器依賴無污染的液壓油來維持微米級的精度。目前,原始設備製造商(OEM)正在預先安裝4-14µm的顆粒計數器和濕度感測器,並將即時警報發送到控制室的PLC。在汽車沖壓廠,一次計劃外的液壓系統故障預計每小時將造成12,000美元的損失,運營商只需預防一次事故,就能證明其在感測器方面的投資是值得的。隨著全球運動控制部署規模的擴大,液壓系統流體狀態監測的市場規模也將持續成長。
區域分析
至2025年,北美將以34.55%的市佔率引領油品狀態監測市場。嚴格的燃油經濟性標準(CAFE)和計劃於2027年生效的大型機油黏度標準,正迫使車隊採用即時黏度計,從而提升供應商的收入。儘管中游管道中老舊的SCADA系統阻礙了感測器的改造,但聯邦政府對關鍵基礎設施升級的撥款可能會刺激潛在的市場需求。
歐洲仍是科技中心,正利用離岸風力發電和循環經濟法規推動潤滑油壽命延長解決方案的發展。歐盟的《化學品永續性報告指令》(CSRD)強制要求製造商揭露潤滑油維護指標,使合規成為董事會層面的優先事項。斯堪地那維亞船東也在投資狀態監測,以確保替代燃料黏度保持在安全範圍內,為應對加拿大運輸部禁止在北極地區使用重質燃油的禁令做好準備。
亞太地區是成長最快的地區,複合年成長率達8.05%,主要得益於工業化、液化天然氣船隊的擴張以及採礦自動化。各國政府正在提高石化聯合企業的安全標準,這為雲端連接感測器創造了機會。然而,中小企業面臨資金限制,促使供應商採用租賃方案。在新興的東協市場,異地實驗室仍佔據主導地位,但隨著硬體成本的下降,市場佔有率預計將逐漸轉向廠內在線感測器,從而擴大整個油品狀態監測市場。
其他好處:
- Excel格式的市場預測(ME)表
- 3個月的分析師支持
目錄
第1章:引言
- 研究假設和市場定義
- 調查範圍
第2章:調查方法
第3章執行摘要
第4章 市場狀況
- 市場概覽
- 市場促進因素
- 在北美,OEM保固要求已擴大到包括油液分析。
- 離岸風力發電機齒輪箱故障加速了線上異物檢測感測器的採用(歐洲)。
- 隨著液化天然氣裝運船隻船隊的擴張,即時潤滑油分析(在亞洲和中東)變得必要起來。
- 利用數位孿生技術在加拿大油砂開展維護計劃
- 智利和秘魯為配備磨損計數器的礦業運輸卡車提供保險折扣
- 基於CSRD的歐盟工業裝置油品壽命延長目標
- 市場限制因素
- 東協中小企業線上感測器的資本投資負擔
- 美國中游管道中傳統SCADA系統整合面臨的挑戰。
- 非洲電力業摩擦學專家短缺
- 東歐鐵譜耗材供應中斷
- 價值供應鏈分析
- 監管和技術展望
- 波特五力分析
第5章 市場規模與成長預測
- 透過抽樣方法
- 現場(車載式、固定式連續監測)
- 異地(實驗室)
- 依產品類型
- 渦輪
- 引擎
- 齒輪系統
- 液壓系統
- 壓縮機
- 感測器/測量方法
- 黏度感測器
- 溫度感測器
- 壓力感測器
- 介電常數感測器
- 廢金屬計數器
- TAN/TBN分析儀
- 煙塵和氧化物測量裝置
- 水和燃料稀釋檢測器
- 透過提供服務
- 硬體和線上測量儀器
- 軟體和分析平台
- 實驗室檢測服務
- 按最終用戶行業分類
- 交通運輸(公路、鐵路、航空)
- 石油和天然氣
- 工業製造
- 礦業
- 發電
- 海上
- 航太/國防
- 可再生能源(風能、太陽能熱能)
- 按地區
- 北美洲
- 美國
- 加拿大
- 墨西哥
- 歐洲
- 英國
- 德國
- 法國
- 義大利
- 其他歐洲國家
- 亞太地區
- 中國
- 日本
- 印度
- 韓國
- 其他亞太國家
- 中東
- 以色列
- 沙烏地阿拉伯
- 阿拉伯聯合大公國
- 土耳其
- 其他中東國家
- 非洲
- 南非
- 埃及
- 其他非洲國家
- 南美洲
- 巴西
- 阿根廷
- 其他南美國家
- 北美洲
第6章 競爭情勢
- 市場集中度
- 策略趨勢
- 市佔率分析
- 公司簡介
- General Electric Company
- Shell plc
- Chevron Corporation
- BP plc(Castrol)
- Exxon Mobil Corporation
- TotalEnergies SE
- Parker-Hannifin Corporation
- Eaton Corporation plc
- Emerson Electric Co.
- SKF AB
- Spectro Scientific(AMETEK Inc.)
- Intertek Group plc
- SGS SA
- Bureau Veritas SA
- ALS Limited
- Techenomics International
- TestOil(Insight Services Inc.)
- CC Jensen A/S
- Poseidon Systems LLC
- WearCheck International
- Delta Services Industriels(DSi)
- Lubrication Engineers Inc.
- Hy-Pro Filtration
第7章 市場機會與未來展望
According to Mordor Intelligence, the oil condition monitoring market size is expected to grow from USD 1.88 billion in 2025 to USD 1.99 billion in 2026 and is forecast to reach USD 2.64 billion by 2031 at 5.78% CAGR over 2026-2031.
This report is Segmented by Sampling Type (On-Site, Off-Site), Product/Equipment Type (Turbines, Engines, Gear Systems, and More), Sensor/Measurement Type (Viscosity Sensors, Temperature Sensors, Pressure Sensors, and More), Service Offering (Hardware, Software, Laboratory Testing Services), End-User Industry, and Geography. The Market Forecasts are Provided in Terms of Value (USD).
Global Oil Condition Monitoring Market Trends and Insights
OEM warranty mandates
North American heavy-duty OEMs have started tying extended engine warranties to routine submission of oil spectrography reports, driving accelerated uptake of the oil condition monitoring market within dealer networks. The program reduces OEM liability by catching early contamination and wear, while fleet operators gain longer engine life and optimized drain intervals. Major Class-8 truck builders now bundle sensor kits with power-train service contracts, nudging independent maintenance shops toward cloud-based dashboards that can ingest OEM telematics feeds. As warranty cost avoidance is quantified in predictive models, CFOs reallocate budgets from reactive repairs to predictive analytics subscriptions. Adoption remains highest in fleets with 300-plus vehicles that amortize sensor investments quickly.
Offshore wind gearbox failures
Europe's offshore wind segment experiences gearbox replacement costs that exceed USD 200,000 per turbine, creating a robust business case for inline ferrous-debris monitors. Operators use real-time metal-particle counts to shift from calendar-based drains to data-dictated interventions, reducing crane-vessel deployments in harsh North Sea conditions. Sensor retrofits integrate with SCADA platforms and feed digital twins that model torque, vibration, and lubricant contamination concurrently. EU and UK subsidy structures penalize non-availability, so operators favor technologies that guarantee high service factors. Vendors offering pre-calibrated AI models gain traction because they reduce commissioning complexity, shrinking the payback period to under 18 months.
Capex Burden of Online Sensors for ASEAN SMEs
Small and medium enterprises across ASEAN markets face significant capital expenditure constraints that limit adoption of online oil condition monitoring systems, despite clear operational benefits. The ASEAN SME Policy Index 2024 highlights that SMEs contribute 64.6% of regional employment and 38.3% to GDP, yet face persistent challenges in accessing capital for technology investments. Online sensor systems typically require USD 5,000-15,000 initial investment per monitoring point, representing a substantial financial barrier for manufacturing SMEs operating on thin margins. The region's heavy reliance on fossil fuels, with oil demand expected to increase 20% by 2035 and annual import bills exceeding USD 200 billion, creates additional cost pressures that limit discretionary technology spending.
Other drivers and restraints analyzed in the detailed report include:
- LNG fleet expansion
- Digital-twin programs in Canadian oil sands
- Legacy SCADA Integration Issues in US Midstream Pipelines
For complete list of drivers and restraints, kindly check the Table Of Contents.
Segment Analysis
Off-site laboratory testing commanded 59.30% of the oil condition monitoring market in 2025 as heavy industry continued to rely on accredited labs for comprehensive elemental and contamination analyses. The model offers deep data sets but introduces lags between sampling and decision-making, sometimes leading to reactive maintenance. Large refineries and power plants maintain yearly contracts with regional labs covering ICP, FTIR, and ferrous density tests. However, courier delays and manual data entry remain pain points.
On-site systems are the fastest-growing segment, expanding at a 9.02% CAGR as IoT mini-labs shrink footprint and cost. Portable viscometers and infrared spectrometers now fit into ruggedized cases, allowing technicians to cut turnaround time from days to minutes. Plants with continuous processes appreciate the closed-loop feedback that lets them adjust load profiles or filtration regimes immediately. Subscription models offer calibration services and cloud dashboards that archive historic trends across multiple sites. By 2031, on-site deployments could erode the oil condition monitoring market share of external labs among mid-tier manufacturers while labs pivot toward data science services.
Engines remained the largest application, holding 31.80% of the oil condition monitoring market share in 2025. High-speed rotating parts create metal wear, soot, and acid that demand early detection. Commercial marine, mining haul trucks, and standby power gensets increasingly embed cylinder-liner wear models in enterprise maintenance planning. Extended drain intervals driven by low-sulfur and bio-blend fuels further underline the need for precise lubricant chemistry insights.
Hydraulic systems are projected to grow at 8.72% CAGR as factory automation and mobile equipment sophistication rise. Electrohydraulic actuators in injection-molding lines and precision presses rely on contaminant-free fluids to sustain micron-level tolerances. OEMs now pre-install 4-14 µm particle counters and moisture sensors that alert control-room PLCs in real time. With every unscheduled hydraulic failure reputed to cost USD 12,000 per hour in automotive stamping plants, operators justify sensor investments within a single incident avoidance. The oil condition monitoring market size for hydraulics will expand further as the global motion-control base broadens.
Complete Report Scope:
- By Sampling Type
- On-Site (On-board, Fixed Continuous Monitoring)
- Off-Site (Laboratory-based)
- By Product / Equipment Type
- Turbines
- Engines
- Gear Systems
- Hydraulic Systems
- Compressors
- By Sensor / Measurement Type
- Viscosity Sensors
- Temperature Sensors
- Pressure Sensors
- Dielectric Constant Sensors
- Ferrous Debris Counters
- TAN/TBN Analyzers
- Soot and Oxidation Meters
- Water and Fuel Dilution Detectors
- By Service Offering
- Hardware and Inline Instrumentation
- Software and Analytics Platforms
- Laboratory Testing Services
- By End-user Industry
- Transportation (Road, Rail, Aviation)
- Oil and Gas
- Industrial Manufacturing
- Mining
- Power Generation
- Marine
- Aerospace and Defense
- Renewable Energy (Wind, Solar Thermal)
- By Geography
- North America
- United States
- Canada
- Mexico
- Europe
- United Kingdom
- Germany
- France
- Italy
- Rest of Europe
- Asia-Pacific
- China
- Japan
- India
- South Korea
- Rest of Asia-Pacific
- Middle East
- Israel
- Saudi Arabia
- United Arab Emirates
- Turkey
- Rest of Middle East
- Africa
- South Africa
- Egypt
- Rest of Africa
- South America
- Brazil
- Argentina
- Rest of South America
- North America
Geography Analysis
North America led the oil condition monitoring market with 34.55% revenue share in 2025. Stringent CAFE fuel-efficiency targets and forthcoming 2027 heavy-duty engine oil viscosity standards compel fleets to adopt real-time viscometers, bolstering supplier revenue. Legacy SCADA in midstream pipelines restrains sensor retrofits, yet federal funding for critical-infrastructure upgrades may unlock latent demand.
Europe remains the technology incubator, leveraging offshore wind deployment and circular-economy regulations to push oil-life-extension solutions. The EU CSRD forces manufacturers to disclose lubricant conservation metrics, turning compliance into a board-level priority. Scandinavian shipowners also prepare for the Arctic heavy-fuel-oil ban by Transport Canada, investing in condition monitoring to ensure alternative fuels maintain viscosity within safe ranges.
Asia-Pacific is the fastest-growing region at 8.05% CAGR as industrialization, LNG fleet growth, and mining automation converge. Governments raise safety standards in petrochemical complexes, creating opportunities for cloud-linked sensors. Yet small and mid-size enterprises face capital constraints, prompting vendors to roll out leasing schemes. In emerging ASEAN markets, off-site labs still dominate, although falling hardware costs will slowly tilt share toward in-plant online sensors, expanding the overall oil condition monitoring market.
- General Electric Company
- Shell plc
- Chevron Corporation
- BP plc (Castrol)
- Exxon Mobil Corporation
- TotalEnergies SE
- Parker-Hannifin Corporation
- Eaton Corporation plc
- Emerson Electric Co.
- SKF AB
- Spectro Scientific (AMETEK Inc.)
- Intertek Group plc
- SGS SA
- Bureau Veritas SA
- ALS Limited
- Techenomics International
- TestOil (Insight Services Inc.)
- C.C. Jensen A/S
- Poseidon Systems LLC
- WearCheck International
- Delta Services Industriels (DSi)
- Lubrication Engineers Inc.
- Hy-Pro Filtration
Additional Benefits:
- The market estimate (ME) sheet in Excel format
- 3 months of analyst support
TABLE OF CONTENTS
1 INTRODUCTION
- 1.1 Study Assumptions and Market Definition
- 1.2 Scope of the Study
2 RESEARCH METHODOLOGY
3 EXECUTIVE SUMMARY
4 MARKET LANDSCAPE
- 4.1 Market Overview
- 4.2 Market Drivers
- 4.2.1 OEM Warranty Mandates Extending to Oil Analytics in North America
- 4.2.2 Offshore-Wind Gearbox Failures Accelerating Inline Debris Sensors (Europe)
- 4.2.3 LNG Carrier Fleet Growth Necessitating Real-time Lube Analytics (Asia and ME)
- 4.2.4 Digital-Twin Maintenance Programs in Canadian Oil Sands
- 4.2.5 Insurance Discounts for Mining Haul Trucks with Wear Counters (Chile and Peru)
- 4.2.6 EU CSRD-Driven Oil-Life Extension Targets in Industrial Plants
- 4.3 Market Restraints
- 4.3.1 Capex Burden of Online Sensors for ASEAN SMEs
- 4.3.2 Legacy SCADA Integration Issues in US Midstream Pipelines
- 4.3.3 Shortage of Tribologists in African Power Utilities
- 4.3.4 Ferrography Consumable Supply Disruptions in Eastern Europe
- 4.4 Value / Supply-Chain Analysis
- 4.5 Regulatory and Technological Outlook
- 4.6 Porter's Five Forces Analysis
- 4.6.1 Threat of New Entrants
- 4.6.2 Bargaining Power of Buyers
- 4.6.3 Bargaining Power of Suppliers
- 4.6.4 Threat of Substitutes
- 4.6.5 Competitive Rivalry
5 MARKET SIZE AND GROWTH FORECASTS (VALUE)
- 5.1 By Sampling Type
- 5.1.1 On-Site (On-board, Fixed Continuous Monitoring)
- 5.1.2 Off-Site (Laboratory-based)
- 5.2 By Product / Equipment Type
- 5.2.1 Turbines
- 5.2.2 Engines
- 5.2.3 Gear Systems
- 5.2.4 Hydraulic Systems
- 5.2.5 Compressors
- 5.3 By Sensor / Measurement Type
- 5.3.1 Viscosity Sensors
- 5.3.2 Temperature Sensors
- 5.3.3 Pressure Sensors
- 5.3.4 Dielectric Constant Sensors
- 5.3.5 Ferrous Debris Counters
- 5.3.6 TAN/TBN Analyzers
- 5.3.7 Soot and Oxidation Meters
- 5.3.8 Water and Fuel Dilution Detectors
- 5.4 By Service Offering
- 5.4.1 Hardware and Inline Instrumentation
- 5.4.2 Software and Analytics Platforms
- 5.4.3 Laboratory Testing Services
- 5.5 By End-user Industry
- 5.5.1 Transportation (Road, Rail, Aviation)
- 5.5.2 Oil and Gas
- 5.5.3 Industrial Manufacturing
- 5.5.4 Mining
- 5.5.5 Power Generation
- 5.5.6 Marine
- 5.5.7 Aerospace and Defense
- 5.5.8 Renewable Energy (Wind, Solar Thermal)
- 5.6 By Geography
- 5.6.1 North America
- 5.6.1.1 United States
- 5.6.1.2 Canada
- 5.6.1.3 Mexico
- 5.6.2 Europe
- 5.6.2.1 United Kingdom
- 5.6.2.2 Germany
- 5.6.2.3 France
- 5.6.2.4 Italy
- 5.6.2.5 Rest of Europe
- 5.6.3 Asia-Pacific
- 5.6.3.1 China
- 5.6.3.2 Japan
- 5.6.3.3 India
- 5.6.3.4 South Korea
- 5.6.3.5 Rest of Asia-Pacific
- 5.6.4 Middle East
- 5.6.4.1 Israel
- 5.6.4.2 Saudi Arabia
- 5.6.4.3 United Arab Emirates
- 5.6.4.4 Turkey
- 5.6.4.5 Rest of Middle East
- 5.6.5 Africa
- 5.6.5.1 South Africa
- 5.6.5.2 Egypt
- 5.6.5.3 Rest of Africa
- 5.6.6 South America
- 5.6.6.1 Brazil
- 5.6.6.2 Argentina
- 5.6.6.3 Rest of South America
- 5.6.1 North America
6 COMPETITIVE LANDSCAPE
- 6.1 Market Concentration
- 6.2 Strategic Moves
- 6.3 Market Share Analysis
- 6.4 Company Profiles (includes Global Overview, Market Overview, Core Segments, Financials as available, Strategic Information, Market Rank/Share, Products and Services, Recent Developments)
- 6.4.1 General Electric Company
- 6.4.2 Shell plc
- 6.4.3 Chevron Corporation
- 6.4.4 BP plc (Castrol)
- 6.4.5 Exxon Mobil Corporation
- 6.4.6 TotalEnergies SE
- 6.4.7 Parker-Hannifin Corporation
- 6.4.8 Eaton Corporation plc
- 6.4.9 Emerson Electric Co.
- 6.4.10 SKF AB
- 6.4.11 Spectro Scientific (AMETEK Inc.)
- 6.4.12 Intertek Group plc
- 6.4.13 SGS SA
- 6.4.14 Bureau Veritas SA
- 6.4.15 ALS Limited
- 6.4.16 Techenomics International
- 6.4.17 TestOil (Insight Services Inc.)
- 6.4.18 C.C. Jensen A/S
- 6.4.19 Poseidon Systems LLC
- 6.4.20 WearCheck International
- 6.4.21 Delta Services Industriels (DSi)
- 6.4.22 Lubrication Engineers Inc.
- 6.4.23 Hy-Pro Filtration
7 MARKET OPPORTUNITIES AND FUTURE OUTLOOK
- 7.1 White-space and Unmet-need Assessment

 油品狀態分析設備市場:全球市場預測,2026-2032年
 潤滑油狀態監測市場:商機、成長要素、產業趨勢分析及2026-2035年預測油液狀態監測市場-2026-2032年全球市場預測
 油液狀態監測市場規模、佔有率和趨勢分析報告:按產品、監測方法、最終用途、地區和細分市場分類(2026-2033 年)
 線上油品質量監測市場:按產品類型、系統組件、測量方法、最終用戶產業和地區分類即時油品狀態監測市場:依技術、終端用戶產業、設備、油品類型及感測器類型分類-2026-2032年全球市場預測變壓器鐵心接地電流線上監測系統市場:依感測器技術、監測參數、部署模式、安裝類型和最終用戶產業分類,全球預測,2026-2032年
 油液狀態監測市場分析及預測(至2035年):依類型、產品類型、服務、技術、組件、應用、部署類型、最終用戶及設備分類
 全球油品狀態監測市場規模、佔有率、趨勢及成長分析報告(2026-2034年)
 2026年全球油品狀態監測市場報告