


 |
市場調查報告書
商品編碼
2109184
潤滑油狀態監測市場:商機、成長要素、產業趨勢分析及2026-2035年預測Oil Condition Monitoring Market Opportunity, Growth Drivers, Industry Trend Analysis, and Forecast 2026 - 2035 |
||||||

全球油品狀態監測市場預計到 2025 年價值 15 億美元,年複合成長率為 8.8%,到 2035 年將達到 34 億美元。
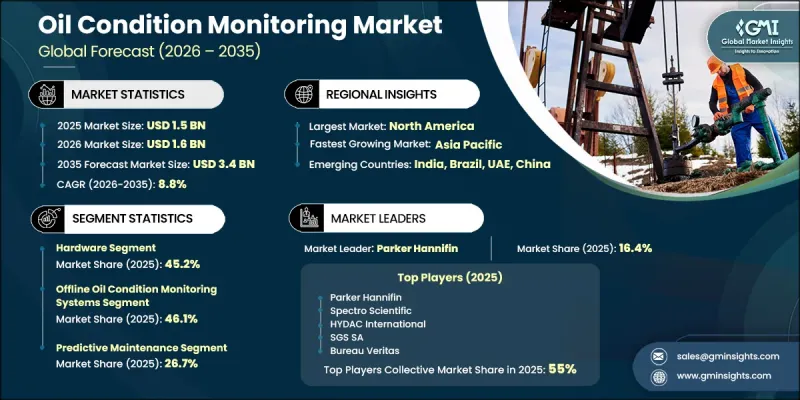
隨著設備可靠性、運作效率和預測性維護策略在資產密集型產業中變得日益重要,油品狀態監測產業正在蓬勃發展。製造業、能源業和製程工業中工業自動化程度的提高以及先進機械設備的廣泛應用,顯著推動了對潤滑油狀態監控解決方案的需求。企業正擴大採用油品狀態監測技術,以最大限度地減少意外設備故障、降低維護成本並延長資產運作。智慧感測器、數位平台和先進分析技術等連網技術的日益普及,使得潤滑油性能的監測更加精準,並正在革新傳統的維護方式。數據驅動的維護方法使工業運營商能夠及早發現潛在的設備問題,並改善其整體資產管理策略。隨著企業尋求提高生產力和減少停機時間,轉向基於狀態的維護模式的正成為市場擴張的關鍵驅動力。隨著預測性技術在工業應用中的不斷融合,預計全球對潤滑油狀態監測解決方案的需求將持續成長。
| 市場範圍 | |
|---|---|
| 開始年份 | 2025 |
| 預測期 | 2026-2035 |
| 初始市場規模 | 15億美元 |
| 預測金額 | 34億美元 |
| 複合年成長率 | 8.8% |
潤滑油狀態監測市場的成長主要得益於工業業者對預防性維護重要性的認知不斷提高。由於潤滑油劣化導致的設備性能問題會造成重大營運損失,企業正積極投資於能夠提高可靠性並降低維護風險的監控技術。互聯監控系統、雲端分析工具和先進資料處理能力的結合,正在增強企業更有效管理潤滑油狀態的能力。這些技術進步正在加速其在各行各業的應用,並鞏固了油品狀態監控作為現代維護計畫關鍵要素的地位。
預計到2025年,硬體細分市場將佔據45.2%的市場。此細分市場持續保持主導地位,因為硬體組件是收集潤滑油性能數據的主要基礎。安裝在工業設備中的感測器、監控設備和檢測裝置能夠持續評估油品品質和設備狀況。硬體解決方案在各種工業系統中的廣泛應用持續支撐著穩定的需求。此外,不斷發展的監控技術,以及設備升級、感測器更換和校準等日常需求,也為該細分市場的持續產生收入做出了貢獻。
預計到2025年,離線潤滑油狀態監測系統市佔率將達到46.1%。由於其價格實惠、易於實施以及能夠進行詳細的潤滑油分析,該細分市場正持續成長。離線監測解決方案透過從運作中設備中收集油樣本並使用測試方法進行評估,來確定潤滑油品質和機器狀態。這些系統分析關鍵的油品特性,幫助操作人員辨識與污染、劣化和磨損相關的問題。其柔軟性和成本效益使其適用於不需要或不經濟地採用連續監測解決方案的行業。
預計到2025年,北美油液狀態監測市場佔有率將達到36.3%,主要得益於資產密集產業的強勁需求和成熟的維護實踐。美國是該地區成長的最大貢獻者,這主要歸功於先進監測技術在各工業領域的廣泛應用。法律規範的完善以及對設備可靠性日益重視,促使各組織將油液分析程序納入其維護策略。這些因素正推動油液狀態監測從一種可選的維護技術,轉變為眾多工業設施的關鍵運作要求。
目錄
第1章:調查方法和範圍
第2章執行摘要
第3章 行業洞察
- 產業生態系分析
- 供應商情況
- 利潤率
- 成本結構
- 每個階段增加的價值
- 影響價值鏈的因素
- 中斷
- 影響產業的因素
- 促進因素
- 工業自動化和機器使用量的增加
- 人們越來越關注如何減少設備停機時間和維護成本。
- 石油天然氣、發電和製造業的擴張。
- 人們越來越重視延長設備的使用壽命和提高其可靠性。
- 更嚴格的監管合規性以及環境和安全標準
- 產業潛在風險與挑戰
- 先進監測系統和實驗室檢測高成本
- 數據整合和標準化的複雜性
- 市場機遇
- 在新興市場和中小企業擴大應用
- 人工智慧驅動的預測診斷和雲端分析
- 促進因素
- 成長潛力分析
- 價格分析
- 對過去價格趨勢的分析
- 依球員類型分類的定價策略(高級球員、超值球員、成本加成球員)
- 監理情勢
- 波特的分析
- PESTLE分析
- 貿易數據分析
- 進出口量及進口額趨勢
- 主要貿易路線及關稅的影響
- 人工智慧和生成式人工智慧對市場的影響
- 利用人工智慧改造現有經營模式
- 按細分市場分類的生成式人工智慧用例和部署藍圖
- 生產能力和生產情況
- 主要生產商的生產能力
- 運轉率和擴張計劃
第4章 競爭情勢
- 企業市佔率分析
- 按地區
- 北美洲
- 歐洲
- 亞太地區
- 拉丁美洲
- 中東和非洲
- 市場集中度分析
- 按地區
- 主要市場公司的競爭分析
- 競爭定位矩陣
- 主要進展
- 併購
- 夥伴關係和聯盟
- 新產品發布
- 業務拓展計劃及資金籌措
- 按公司規模進行基準測試
- 排名分類標準與遴選標準
- 按銷售額、地區和創新能力分類的層級定位矩陣。
第5章 市場估算與預測:以交付方式分類,2022-2035年
- 硬體
- 軟體
- 服務
第6章 市場估算與預測:依產品類型分類,2022-2035年
- 攜帶式油液狀態監測系統
- 線上油品狀態監測系統
- 離線油品狀態監測系統
第7章 市場估計與預測:依設備類型分類,2022-2035年
- 渦輪
- 壓縮機
- 引擎
- 齒輪系統
- 液壓系統
- 變壓器
- 其他
第8章 市場估計與預測:依應用領域分類,2022-2035年
- 預測性保護
- 設備健康監測
- 污染物檢測
- 潤滑劑性能評價
- 磨損顆粒分析
- 故障檢測與診斷
- 其他
第9章 市場估計與預測:依最終用途產業分類,2022-2035年
- 石油和天然氣
- 發電
- 製造業
- 礦業
- 海上
- 交通運輸及鐵路
- 航太/國防
- 風能和可再生能源
- 工程機械
- 其他
第10章 市場估價與預測:依地區分類,2022-2035年
- 北美洲
- 美國
- 加拿大
- 歐洲
- 德國
- 英國
- 法國
- 西班牙
- 義大利
- 亞太地區
- 中國
- 印度
- 日本
- 澳洲
- 韓國
- 拉丁美洲
- 巴西
- 墨西哥
- 阿根廷
- 中東和非洲
- 南非
- 沙烏地阿拉伯
- UAE
第11章:公司簡介
- 全球主要公司
- Parker Hannifin Corporation
- HYDAC International
- SGS SA
- Bureau Veritas
- Intertek Group
- Shell
- ExxonMobil
- 該地區的主要公司
- 北美洲
- Spectro Scientific
- GasTOPS
- Eurofins TestOil
- 歐洲
- Tan Delta Systems
- eralytics
- ifm electronic
- Veritas Petroleum Services(VPS)
- 北美洲
- 小眾玩家/顛覆者
- WearCheck International
- Poseidon Systems
- Rheonics
The Global Oil Condition Monitoring Market was valued at USD 1.5 billion in 2025 and is estimated to grow at a CAGR of 8.8% to reach USD 3.4 billion by 2035.
The oil condition monitoring industry is witnessing growth as asset-intensive sectors increasingly prioritize equipment reliability, operational efficiency, and predictive maintenance strategies. Growing industrial automation and expanding deployment of advanced machinery across manufacturing, energy, and process industries are creating significant demand for lubricant monitoring solutions. Organizations are increasingly adopting oil condition monitoring technologies to minimize unexpected equipment failures, lower maintenance expenses, and extend asset operating life. The rising adoption of connected technologies, including smart sensors, digital platforms, and advanced analytics, is transforming traditional maintenance practices by enabling more accurate monitoring of lubricant performance. Data-driven maintenance approaches are allowing industrial operators to identify potential equipment issues earlier and improve overall asset management strategies. The shift toward condition-based maintenance is becoming a key factor supporting market expansion as companies seek greater productivity and reduced operational disruptions. Increasing integration of predictive technologies across industrial applications is expected to continue driving demand for oil condition monitoring solutions worldwide.
| Market Scope | |
|---|---|
| Start Year | 2025 |
| Forecast Year | 2026-2035 |
| Start Value | $1.5 Billion |
| Forecast Value | $3.4 Billion |
| CAGR | 8.8% |
The growth of the oil condition monitoring market is strongly supported by increasing awareness among industrial operators regarding the importance of proactive maintenance practices. Equipment performance issues associated with lubricant deterioration can result in significant operational losses, encouraging companies to invest in monitoring technologies that improve reliability and reduce maintenance risks. The combination of connected monitoring systems, cloud-based analytical tools, and advanced data processing capabilities is enhancing the ability of organizations to manage lubricant conditions more effectively. These technological advancements are accelerating adoption across multiple industries and strengthening the role of oil condition monitoring as an essential component of modern maintenance programs.
The hardware segment held a 45.2% share in 2025. This segment maintains its leading position because hardware components serve as the primary foundation for collecting lubricant performance data. Sensors, monitoring devices, and detection equipment installed within industrial assets enable continuous evaluation of oil quality and equipment conditions. The broad application of hardware solutions across various industrial systems continues to support steady demand. Additionally, recurring requirements related to equipment upgrades, sensor replacement, and calibration activities contribute to sustained revenue generation within this segment as monitoring technologies continue to evolve.
The offline oil condition monitoring systems segment captured a 46.1% share in 2025. This segment continues to gain adoption due to its affordability, straightforward implementation process, and ability to deliver detailed lubricant analysis. Offline monitoring solutions involve collecting oil samples from operating equipment and evaluating them through testing methods to assess lubricant quality and machine health. These systems analyze important oil characteristics, helping operators identify contamination, degradation, and wear-related issues. Their flexibility and cost advantages make them suitable for industries where continuous monitoring solutions may not be necessary or economically practical.
North America Oil Condition Monitoring Market accounted for a 36.3% share in 2025, supported by strong demand from asset-intensive industries and the presence of established maintenance management practices. The United States represents the largest contributor to regional growth due to widespread adoption of advanced monitoring technologies across industrial sectors. Regulatory frameworks and increasing emphasis on equipment reliability are encouraging organizations to integrate oil analysis programs into maintenance strategies. These factors are elevating oil condition monitoring from an optional maintenance approach to an important operational requirement across numerous industrial facilities.
Prominent players operating in the global oil condition monitoring market include Bureau Veritas, eralytics, Eurofins TestOil, ExxonMobil, GasTOPS, HYDAC International, ifm electronic, Intertek Group, Parker Hannifin, Poseidon Systems, Rheonics, SGS SA, Shell, Spectro Scientific, Tan Delta Systems, Veritas Petroleum Services (VPS), and WearCheck International. Companies operating in the oil condition monitoring market are strengthening their market presence by expanding technology portfolios, improving sensor capabilities, and developing advanced analytical solutions for predictive maintenance applications. Market participants are investing in research and development to enhance monitoring accuracy, data processing capabilities, and integration with digital industrial platforms. Strategic partnerships with equipment manufacturers, industrial operators, and technology providers are helping companies expand their customer base and improve solution offerings. Businesses are also focusing on cloud-based monitoring services, automation, and customized solutions to meet evolving industry requirements. Expansion into emerging markets, stronger service networks, and continuous innovation in diagnostics technologies remain key strategies for improving competitiveness, increasing customer adoption, and reinforcing long-term market positioning within the global oil condition monitoring industry.
Table of Contents
Chapter 1 Methodology and Scope
- 1.1 Market scope and definition
- 1.2 Research design
- 1.2.1 Research approach
- 1.2.2 Data collection methods
- 1.3 Data mining sources
- 1.3.1 Global
- 1.3.2 Regional/Country
- 1.4 Base estimates and calculations
- 1.4.1 Base year calculation
- 1.4.2 Key trends for market estimation
- 1.5 Primary research and validation
- 1.5.1 Primary sources
- 1.6 Forecast model
- 1.7 Research assumptions and limitations
Chapter 2 Executive Summary
- 2.1 Industry 360° synopsis, 2022 – 2035
- 2.2 Key market trends
- 2.2.1 Offering trends
- 2.2.2 Product Type trends
- 2.2.3 Equipment Type trends
- 2.2.4 Application trends
- 2.2.5 Regional trends
- 2.3 TAM Analysis, 2026-2035
- 2.4 CXO perspectives: Strategic imperatives
Chapter 3 Industry Insights
- 3.1 Industry ecosystem analysis
- 3.1.1 Supplier Landscape
- 3.1.2 Profit Margin
- 3.1.3 Cost structure
- 3.1.4 Value addition at each stage
- 3.1.5 Factor affecting the value chain
- 3.1.6 Disruptions
- 3.2 Industry impact forces
- 3.2.1 Growth drivers
- 3.2.1.1 Rising Industrial Automation and Machinery Usage
- 3.2.1.2 Increasing Focus on Reducing Equipment Downtime and Maintenance Costs
- 3.2.1.3 Expansion of Oil & Gas, Power Generation, and Manufacturing Operations
- 3.2.1.4 Growing Emphasis on Equipment Life Extension and Reliability
- 3.2.1.5 Stricter Regulatory Compliance and Environmental/Safety Standards
- 3.2.2 Industry pitfalls and challenges
- 3.2.2.1 High Costs of Advanced Monitoring Systems and Lab Testing
- 3.2.2.2 Complexity in Data Integration and Standardization
- 3.2.3 Market opportunities
- 3.2.3.1 Growing Adoption in Emerging Economies and SMEs
- 3.2.3.2 AI-Based Predictive Diagnostics and Cloud Analytics
- 3.2.1 Growth drivers
- 3.3 Growth potential analysis
- 3.4 Pricing Analysis (Driven by Primary Research)
- 3.4.1 Historical Price Trend Analysis
- 3.4.2 Pricing Strategy by Player Type (Premium / Value / Cost-plus)
- 3.5 Regulatory landscape
- 3.5.1 North America
- 3.5.2 Europe
- 3.5.3 Asia Pacific
- 3.5.4 Latin America
- 3.5.5 Middle East & Africa
- 3.6 Porter’s analysis
- 3.7 PESTEL analysis
- 3.8 Trade Data Analysis (Based on Paid Database)
- 3.8.1 Import/Export Volume & Value Trends
- 3.8.2 Key Trade Corridors & Tariff Impact
- 3.9 Impact of AI & Generative AI on the Market (Driven by Primary Research)
- 3.9.1 AI-Driven Disruption of Existing Business Models
- 3.9.2 GenAI Use Cases & Adoption Roadmap by Segment
- 3.10 Capacity & Production Landscape (Driven by Primary Research)
- 3.10.1 Production Capacity by Key Producer
- 3.10.2 Capacity Utilization Rates & Expansion Pipelines
Chapter 4 Competitive Landscape, 2025
- 4.1 Company market share analysis, 2025
- 4.1.1 By Region
- 4.1.1.1 North America
- 4.1.1.2 Europe
- 4.1.1.3 Asia-Pacific
- 4.1.1.4 Latin America
- 4.1.1.5 Middle East and Africa
- 4.1.2 Market Concentration Analysis
- 4.1.1 By Region
- 4.2 Competitive analysis of major market players
- 4.3 Competitive positioning matrix
- 4.4 Key developments
- 4.4.1 Mergers & acquisitions
- 4.4.2 Partnerships & collaborations
- 4.4.3 New product launches
- 4.4.4 Expansion plans and funding
- 4.5 Company tier benchmarking
- 4.5.1 Tier classification criteria & qualifying thresholds
- 4.5.2 Tier positioning matrix by revenue, geography & innovation
Chapter 5 Market Estimates and Forecast, By Offering, 2022 – 2035 (USD Million)
- 5.1 Key trends
- 5.2 Hardware
- 5.3 Software
- 5.4 Services
Chapter 6 Market Estimates and Forecast, By Product Type, 2022 – 2035 (USD Million)
- 6.1 Key trends
- 6.2 Portable Oil Condition Monitoring Systems
- 6.3 Online Oil Condition Monitoring Systems
- 6.4 Off-line Oil Condition Monitoring Systems
Chapter 7 Market Estimates and Forecast, By Equipment Type, 2022 – 2035 (USD Million)
- 7.1 Key trends
- 7.2 Turbines
- 7.3 Compressors
- 7.4 Engines
- 7.5 Gear Systems
- 7.6 Hydraulic Systems
- 7.7 Transformers
- 7.8 Others
Chapter 8 Market Estimates and Forecast, By Application, 2022 – 2035 (USD Million)
- 8.1 Key trends
- 8.2 Predictive Maintenance
- 8.3 Equipment Health Monitoring
- 8.4 Contamination Detection
- 8.5 Lubricant Performance Assessment
- 8.6 Wear Particle Analysis
- 8.7 Fault Detection & Diagnostics
- 8.8 Others
Chapter 9 Market Estimates and Forecast, By End-use Industry, 2022 – 2035 (USD Million)
- 9.1 Key trends
- 9.2 Oil & Gas
- 9.3 Power Generation
- 9.4 Manufacturing
- 9.5 Mining
- 9.6 Marine
- 9.7 Transportation & Railways
- 9.8 Aerospace & Defense
- 9.9 Wind & Renewable Energy
- 9.10 Construction Equipment
- 9.11 Others
Chapter 10 Market Estimates and Forecast, By Region, 2022 – 2035 (USD Million)
- 10.1 Key trends
- 10.2 North America
- 10.2.1 U.S.
- 10.2.2 Canada
- 10.3 Europe
- 10.3.1 Germany
- 10.3.2 UK
- 10.3.3 France
- 10.3.4 Spain
- 10.3.5 Italy
- 10.4 Asia Pacific
- 10.4.1 China
- 10.4.2 India
- 10.4.3 Japan
- 10.4.4 Australia
- 10.4.5 South Korea
- 10.5 Latin America
- 10.5.1 Brazil
- 10.5.2 Mexico
- 10.5.3 Argentina
- 10.6 Middle East and Africa
- 10.6.1 South Africa
- 10.6.2 Saudi Arabia
- 10.6.3 UAE
Chapter 11 Company Profiles
- 11.1 Global Key Players
- 11.1.1 Parker Hannifin Corporation
- 11.1.2 HYDAC International
- 11.1.3 SGS SA
- 11.1.4 Bureau Veritas
- 11.1.5 Intertek Group
- 11.1.6 Shell
- 11.1.7 ExxonMobil
- 11.2 Regional key players
- 11.2.1 North America
- 11.2.1.1 Spectro Scientific
- 11.2.1.2 GasTOPS
- 11.2.1.3 Eurofins TestOil
- 11.2.2 Europe
- 11.2.2.1 Tan Delta Systems
- 11.2.2.2 eralytics
- 11.2.2.3 ifm electronic
- 11.2.2.4 Veritas Petroleum Services (VPS)
- 11.2.1 North America
- 11.3 Niche Players/Disruptors
- 11.3.1 WearCheck International
- 11.3.2 Poseidon Systems
- 11.3.3 Rheonics

 油品狀態分析設備市場:全球市場預測,2026-2032年
 油液狀態監測:市場佔有率分析、產業趨勢與統計、成長預測(2026-2031)油液狀態監測市場-2026-2032年全球市場預測
 油液狀態監測市場規模、佔有率和趨勢分析報告:按產品、監測方法、最終用途、地區和細分市場分類(2026-2033 年)
 線上油品質量監測市場:按產品類型、系統組件、測量方法、最終用戶產業和地區分類即時油品狀態監測市場:依技術、終端用戶產業、設備、油品類型及感測器類型分類-2026-2032年全球市場預測變壓器鐵心接地電流線上監測系統市場:依感測器技術、監測參數、部署模式、安裝類型和最終用戶產業分類,全球預測,2026-2032年
 油液狀態監測市場分析及預測(至2035年):依類型、產品類型、服務、技術、組件、應用、部署類型、最終用戶及設備分類
 全球油品狀態監測市場規模、佔有率、趨勢及成長分析報告(2026-2034年)
 2026年全球油品狀態監測市場報告