


 |
市場調查報告書
商品編碼
2114868
鋼筋:市場佔有率分析、產業趨勢與統計、成長預測(2026-2031)Steel Rebar - Market Share Analysis, Industry Trends & Statistics, Growth Forecasts (2026 - 2031) |
||||||

※ 本網頁內容可能與最新版本有所差異。詳細情況請與我們聯繫。
據 Mordor Intelligence 稱,2025 年鋼筋市場價值為 1.4475 億噸,預計到 2031 年將達到 2.0156 億噸,而 2026 年為 1.5296 億噸,預測期(2026-2031 年)複合年成長率為 5.67%。
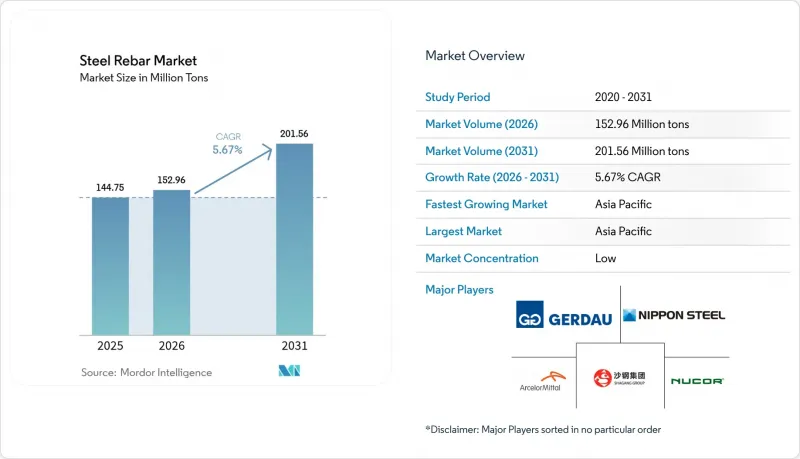
本報告按類型(變形鋼筋、普通鋼筋)、直徑(≤10mm、10-20mm、20-32mm、>32mm)、製造程序(電弧爐、鹼性氧氣轉爐、感應爐)、終端用戶行業(住宅、非住宅)和地區(亞太地區、北美地區、歐洲地區、南美地區、中東和非洲地區)進行細分。市場預測以噸為單位。
全球鋼筋市場趨勢及洞察
住宅建設導致需求激增
人口壓力和支持住宅的財政政策正在推動主要經濟體鋼筋消費量的成長。 2024年4月,美國住宅支出年增10.9%,這主要得益於與《住房和工業政策法案》(CHIPS Act)和《通貨膨脹控制法案》(Inflation Control Act)相關的聯邦激勵措施,這些措施刺激了獨棟住宅的開工量。巴西的「我的家,我的生活」(Minha Casa Minha Vida)計畫預計將在2025年第一季使水泥用量增加5.9%,這意味著高強度鋼筋混凝土的澆築量也將出現類似的成長。在印度,受政府補貼的住宅建設和都市區地鐵建設的推動,2024年鋼鐵使用量將達到1.125億噸。地震多發地區的建築規範要求使用更高強度的鋼筋,從而增加了住宅的鋼筋用量。此外,自2019年以來,製造業工廠的建設成長了156%,由於新建工人住宅集中在工業區附近,間接創造了住宅需求。
維修工程期間重組工作量增加
在歐洲和北美,為實現淨零排放和安全目標,抗震維修正在加速。英國需要將其抗震維修率提高三倍,達到每年3%,以符合其2050年的氣候目標,這將鞏固鋼筋的長期需求。在加州和日本,用於抗震維修的資金正在增加,這些改造項目指定使用不銹鋼或環氧塗層鋼筋以提高耐久性,導致每個項目的鋼筋噸位增加。 2022年《建築安全法》中關於格倫費爾大廈火災後消防法規的實施,正在推動英國中層住宅存量的結構維修。特殊合金和客製化直徑鋼筋價格較高,可以保護鋼鐵廠的利潤免受成熟市場波動的影響。
鐵礦石和廢鋼價格的波動給鋼鐵廠的利潤率帶來了壓力。
由於中國生鐵產量放緩,鐵礦石現貨價格從2024年1月的每噸144美元跌至9月的每噸91.28美元,給綜合鋼鐵企業帶來壓力。隨著島戶鐵礦產能擴大至每年1.2億噸,長期預測顯示,到2034年鐵礦石價格將進一步下跌至每噸78美元。廢鋼溢價因地區而異,優質工業廢鋼短缺可能推高電爐(EAF)投入成本並降低運轉率。中國的補貼(是經合組織平均的10倍)進一步扭曲了全球利潤率,對補貼較少的鋼鐵廠構成挑戰。
細分市場分析
2025年,變形鋼筋憑藉其卓越的黏結性能和強制性抗震標準,持續維持70.10%的鋼筋市場佔有率。高風險地區的建築規範要求使用變形截面以提高荷載傳遞效率,鞏固了其作為主要結構構件的地位。低碳鋼的年複合成長率(CAGR)為5.96%。這主要歸功於維修和造船行業的承包商優先考慮鋼筋的可彎曲性和防腐蝕塗層,從而簡化了鋼筋的密集排列。數位化建模正在改變變形鋼筋的統一使用方式,使得在應力可接受的情況下可以使用低碳鋼,從而重新分配生產資源。 JSW鋼鐵公司計劃在2030年將長條類產品的產量提高到35%,這反映了其與這一細分市場成長的策略契合。
在碼頭、棧橋和老舊橋樑的維修中,對鍍鋅和環氧塗層低碳鋼筋的需求日益成長。表面處理延長了鋼筋的使用壽命,彌補了其與不銹鋼產品相比的初始成本差異。微量合金化技術的進步提高了鋼筋的屈服強度,縮小了其與變形鋼筋在機械性能上的差距。因此,擁有塗層生產線和小批量生產經驗的製造商正在利潤豐厚的維修項目中擴大市場佔有率。
到2025年,直徑10-20毫米的鋼筋將佔鋼筋市場的45.30%,這主要得益於住宅樓板和中高層商業建築框架的需求。建築公司之所以青睞這一直徑的鋼筋,是因為它與標準箍筋和混凝土覆層規範高度相容。使用直徑超過32毫米鋼筋的項目正以6.05%的複合年成長率成長。這主要由離岸風力發電單樁和超長跨度橋樑項目推動,在這些項目中,更高的截面模數可以減少組裝鋼筋的數量。同樣,「一帶一路」鐵路沿線巨型基礎的建設也增加了對大直徑鋼筋的使用,並最佳化了單位鋼材的人工時間。
直徑小於10毫米的小直徑鋼筋廣泛應用於預鑄面板和建築外觀,隨著模組化住宅檢查制度的逐步推行,其需求保持穩定。而直徑20-32毫米的鋼筋在醫院、機場等公共基礎設施領域需求不斷成長,因為這些場所的活載標準高於住宅建築。供應各種直徑鋼筋的鋼廠正在提高生產計畫的柔軟性,並確保各領域的訂單。
區域分析
預計到2025年,亞太地區將佔全球鋼鐵消費量的38.90%,並將在2031年之前保持領先地位,年複合成長率(CAGR)為5.86%。 2023年,中國粗鋼需求量為9.11億噸,需求用途從住宅高層高層建築轉向鐵路、機械和可再生能源設備,導致鋼材等級和直徑組成改變。在印度,年需求量增加了14.5%,預計到2025年,隨著地鐵、機場和高速公路項目的逐步完善,需求量將增加8%至10%。外國直接投資(FDI)正湧入東協主要城市(尤其是馬來西亞)的資料中心園區,這些園區需要直徑20至32毫米的鋼筋籠。
北美正受惠於製造業的復甦,美國建築業佔國內鋼鐵消費量的一半以上。受《晶片與工業產品法案》(CHIPS Act)的推動,半導體工廠以及可再生能源組件工廠的建設,都支撐了高強度鋼筋的訂單。在加拿大,2024年非住宅房屋開工量增加了5.8%,抵銷了住宅市場的放緩。在墨西哥,價值8590億墨西哥披索的能源和交通基礎設施項目正在拓展北美大陸的鋼鐵分銷管道。
在歐洲,由於能源成本和地緣政治風險抑制了新計畫,需求正在放緩,導致2024年表觀鋼鐵消費量下降2.3%。然而,特種鋼筋的消費受到維修義務和離岸風力發電投資的支撐。中東地區的需求正在激增,預計到2028年,沙烏地阿拉伯的建築支出將超過1,815億美元,長條類產品進口預計將持續到當地鋼廠能夠擴建以滿足需求為止。南美洲的成長並不均衡。在巴西,房地產獎勵策略增加了水泥需求,導致鋼筋出貨量增加,但基礎設施短缺表明未來仍有大型企劃正在籌備中。
其他福利
- Excel格式的市場預測(ME)表
- 3個月的分析師支持
目錄
第1章:引言
- 研究假設和市場定義
- 調查範圍
第2章:調查方法
第3章執行摘要
第4章 市場狀況
- 市場概覽
- 市場促進因素
- 住宅建設導致需求激增
- 維修工程期間重組工作量增加
- 「一帶一路」大型基礎建設計畫的重啟
- 鋼筋混凝土在建築業的普及
- 離岸風力發電電場基礎對耐腐蝕鋼筋的需求
- 市場限制因素
- 鐵礦石和廢鋼價格的波動給鋼鐵廠的利潤率帶來了壓力。
- 加快海岸工程採用纖維增強聚合物桿件
- 使用水泥混凝土的 3D 列印技術的興起,消除了對傳統鋼筋的需求。
- 價值鏈分析
- 波特五力模型
第5章 市場規模與成長預測
- 按類型
- 變形鋼筋
- 普通鋼筋
- 依直徑
- 10毫米或更小
- 10~20mm
- 20~32mm
- 超過 32 毫米
- 透過製造程序
- 電弧爐(EAF)
- 鹼性氧氣轉爐(BOF)
- 感應爐
- 按最終用戶行業分類
- 住宅
- 非住宅
- 商業
- 基礎設施
- 公共設施
- 按地區
- 亞太地區
- 中國
- 日本
- 印度
- 韓國
- ASEAN
- 其他亞太國家
- 北美洲
- 美國
- 加拿大
- 墨西哥
- 歐洲
- 德國
- 英國
- 法國
- 義大利
- 西班牙
- 俄羅斯
- 北歐國家
- 其他歐洲國家
- 南美洲
- 巴西
- 阿根廷
- 其他南美國家
- 中東和非洲
- 沙烏地阿拉伯
- 南非
- 其他中東和非洲國家
- 亞太地區
第6章 競爭情勢
- 市場集中度
- 策略趨勢
- 市佔率和排名分析
- 公司簡介
- ArcelorMittal
- CMC(Commercial Metals Company)
- Daido Steel Co., Ltd.
- EMSTEEL
- Gerdau S/A
- Hybar LLC
- Hyundai Steel
- JFE Steel Corporation
- Jiangsu Shagang Group Su
- JSW
- Kobe Steel, Ltd.
- NIPPON STEEL CORPORATION
- Nucor Corporation
- POSCO
- SAIL
- Sohar Steel LLC
- Stecol International Pvt. Ltd.
- Steel Dynamics
- Tata Steel
第7章 市場機會與未來展望
According to Mordor Intelligence, the steel rebar market size was valued at 144.75 Million tons in 2025 and estimated to grow from 152.96 Million tons in 2026 to reach 201.56 Million tons by 2031, at a CAGR of 5.67% during the forecast period (2026-2031).
This report is Segmented by Type (Deformed, Mild), Diameter (Less Than Equal To 10 Mm, 10-20 Mm, 20-32 Mm, Greater Than 32 Mm), Production Process (Electric-Arc Furnace, Basic Oxygen Furnace, Induction Furnace), End-User Industry (Residential, Non-Residential), and Geography (Asia-Pacific, North America, Europe, South America, Middle East and Africa). The Market Forecasts are Provided in Terms of Volume (Tons).
Global Steel Rebar Market Trends and Insights
Rapid Demand from Residential Construction
Demographic pressure and pro-housing fiscal programs heighten rebar consumption across key economies. US residential spending rose 10.9% year-on-year in April 2024 as federal incentives linked to the CHIPS and Inflation Reduction Acts spurred single-family starts. Brazil's Minha Casa Minha Vida scheme lifted cement sales 5.9% in Q1 2025, signaling a parallel uptick in rebar-rich concrete pours. India's steel use reached 112.5 million tons in 2024 on the back of state-subsidized housing and urban metro construction. Seismic-zone building codes now request higher-strength bar, boosting tonnage per dwelling. Manufacturing plant construction-up 156% since 2019-adds indirect residential demand as new workforce housing clusters around industrial corridors.
Increasing Reconstruction in Retrofitting Activities
Europe and North America accelerate retrofits to meet net-zero and safety targets. The UK must triple retrofit rates to 3% annually to align with 2050 climate goals, locking in long-run rebar demand. California and Japan fund seismic upgrades that specify stainless or epoxy-coated bar for longevity, raising per-project tonnage. Post-Grenfell rules under the 2022 Building Safety Act fuel structural overhauls across the UK's mid-rise housing stock. Specialized alloys and customized diameters command premiums that cushion mills from volume volatility in mature markets.
Volatile Iron-Ore and Scrap Prices Squeezing Mills' Margins
Spot iron-ore fell from USD 144/ton in January 2024 to USD 91.28 by September as Chinese pig-iron output weakened, pressuring integrated producers. Long-range forecasts point to USD 78/ton by 2034 as Simandou ramps up 120 million tons annually. Scrap premiums vary by region; shortages of clean industrial scrap can spike EAF input costs and curb run rates. Chinese subsidies-ten times OECD averages-further distort global margins, challenging less-subsidized mills.
Other drivers and restraints analyzed in the detailed report include:
- Belt-and-Road Mega-Infrastructure Pipeline Revival
- Prevalence of Reinforced Concrete in Construction
- Accelerating Adoption of Fibre-Reinforced Polymer Bars in Coastal Projects
For complete list of drivers and restraints, kindly check the Table Of Contents.
Segment Analysis
Deformed bar held a commanding 70.10% of steel rebar market share in 2025 thanks to superior bond performance and seismic code mandates. Building codes in high-risk geographies stipulate deformed profiles for load-transfer efficiency, anchoring their role in primary structural elements. Mild-steel grades expand at a 5.96% CAGR as retrofit and marine contractors prize bendability and corrosion coatings that simplify congested reinforcement zones. Digital modeling tempers blanket deformed use, specifying mild grades where stresses allow, thus reallocating tonnage. JSW Steel's plan to lift long-product output to 35% by 2030 illustrates strategic alignment with specialized segment growth.
Demand for galvanized and epoxy-coated mild bar rises in piers, quays, and refurbishment of aging bridges. Surface treatments extend service life and offset initial cost gaps versus stainless options. Advances in micro-alloying elevate yield strength, closing mechanical gaps with deformed varieties. As a result, producers that master coating lines and small heat batches gain share in higher-margin retrofitting contracts.
Bar in the 10-20 mm range represented 45.30% of steel rebar market size in 2025, fueled by residential slabs and mid-rise commercial frames. Contractors favor this diameter for ready compatibility with standard stirrup cages and concrete cover guidelines. Projects exceeding 32 mm bar accelerate at 6.05% CAGR, propelled by offshore wind monopiles and extra-long span bridges where higher section modulus curbs assembly count. Mega-foundation pours on Belt-and-Road rail corridors likewise lift large-bar tonnage and optimize labor hours per unit steel.
Lower diameters <=10 mm cater to precast panels and architectural fascias; demand stays stable amid modular housing trials. The 20-32 mm bracket grows in civic infrastructure such as hospitals and airports where live-load criteria surpass residential norms. Mills that supply wider diameter mixes enhance mill scheduling flexibility and capture cross-segment orders.
Complete Report Scope:
- By Type
- Deformed
- Mild
- By Diameter
- Less than equal to10 mm
- 10-20 mm
- 20-32 mm
- Geater than 32 mm
- By Production Process
- Electric-Arc Furnace (EAF)
- Basic Oxygen Furnace (BOF)
- Induction Furnace
- By End-user Industry
- Residential
- Non-Residential
- Commercial
- Infrastructure
- Institutional
- By Geography
- Asia-Pacific
- China
- Japan
- India
- South Korea
- ASEAN Countries
- Rest of Asia-Pacific
- North America
- United States
- Canada
- Mexico
- Europe
- Germany
- United Kingdom
- France
- Italy
- Spain
- Russia
- NORDIC Countries
- Rest of Europe
- South America
- Brazil
- Argentina
- Rest of South America
- Middle East and Africa
- Saudi Arabia
- South Africa
- Rest of Middle East and Africa
- Asia-Pacific
Geography Analysis
Asia-Pacific retained 38.90% of global consumption in 2025 and is poised for a leading 5.86% CAGR through 2031. China's crude-steel pull of 911 million tons in 2023 centered on rail, machinery, and renewable capacity rather than residential high-rise, altering grade and diameter mix. India recorded 14.5% yearly demand growth and expects 8-10% gains in 2025 as metro, airport, and highway schemes mature. ASEAN hubs, led by Malaysia, channel FDI into data-center campuses that favor 20-32 mm bar cages.
North America benefits from reshored manufacturing, with the US construction sector accounting for more than half of domestic steel uptake. CHIPS-driven semiconductor plants, plus renewable component factories, sustain high-strength bar orders. Canada posted a 5.8% rise in non-residential starts during 2024, offsetting a slowdown in housing. Mexico's MXN 859 billion infrastructure program across energy and mobility widens continental steel corridors.
Europe faces tempered demand as energy costs and geopolitical risk curb fresh projects; apparent steel use slipped 2.3% in 2024. Yet retrofit mandates and offshore wind investments uphold specialty bar consumption. The Middle East surges, with Saudi Arabia projected to eclipse USD 181.5 billion in construction outlays by 2028, funneling long-product imports until local melt-shop expansions catch up. South America shows patchy growth; Brazil's real-estate stimulus lifted cement and by extension rebar volumes, while infrastructural deficits hint at future mega-project pipelines.
- ArcelorMittal
- CMC (Commercial Metals Company )
- Daido Steel Co., Ltd.
- EMSTEEL
- Gerdau S/A
- Hybar LLC
- Hyundai Steel
- JFE Steel Corporation
- Jiangsu Shagang Group Su
- JSW
- Kobe Steel, Ltd.
- NIPPON STEEL CORPORATION
- Nucor Corporation
- POSCO
- SAIL
- Sohar Steel LLC
- Stecol International Pvt. Ltd.
- Steel Dynamics
- Tata Steel
Additional Benefits:
- The market estimate (ME) sheet in Excel format
- 3 months of analyst support
TABLE OF CONTENTS
1 Introduction
- 1.1 Study Assumptions and Market Definition
- 1.2 Scope of the Study
2 Research Methodology
3 Executive Summary
4 Market Landscape
- 4.1 Market Overview
- 4.2 Market Drivers
- 4.2.1 Rapid demand from residentional construction
- 4.2.2 Increasing reconstruction in retrofitting activities
- 4.2.3 Belt-and-Road mega-infrastructure pipeline revival
- 4.2.4 Prevalence of Reinforced Concrete in Construction
- 4.2.5 Maritime wind-farm foundations demanding corrosion-resistant rebar
- 4.3 Market Restraints
- 4.3.1 Volatile iron-ore and scrap prices squeezing mills' margins
- 4.3.2 Accelerating adoption of fibre-reinforced polymer bars in coastal projects
- 4.3.3 Rising cement-concrete 3-D printing that bypasses traditional rebar
- 4.4 Value Chain Analysis
- 4.5 Porter's Five Forces
- 4.5.1 Bargaining Power of Suppliers
- 4.5.2 Bargaining Power of Buyers
- 4.5.3 Threat of New Entrants
- 4.5.4 Threat of Substitute Products and Services
- 4.5.5 Degree of Competition
5 Market Size and Growth Forecasts (Volume)
- 5.1 By Type
- 5.1.1 Deformed
- 5.1.2 Mild
- 5.2 By Diameter
- 5.2.1 Less than equal to10 mm
- 5.2.2 10-20 mm
- 5.2.3 20-32 mm
- 5.2.4 Geater than 32 mm
- 5.3 By Production Process
- 5.3.1 Electric-Arc Furnace (EAF)
- 5.3.2 Basic Oxygen Furnace (BOF)
- 5.3.3 Induction Furnace
- 5.4 By End-user Industry
- 5.4.1 Residential
- 5.4.2 Non-Residential
- 5.4.2.1 Commercial
- 5.4.2.2 Infrastructure
- 5.4.2.3 Institutional
- 5.5 By Geography
- 5.5.1 Asia-Pacific
- 5.5.1.1 China
- 5.5.1.2 Japan
- 5.5.1.3 India
- 5.5.1.4 South Korea
- 5.5.1.5 ASEAN Countries
- 5.5.1.6 Rest of Asia-Pacific
- 5.5.2 North America
- 5.5.2.1 United States
- 5.5.2.2 Canada
- 5.5.2.3 Mexico
- 5.5.3 Europe
- 5.5.3.1 Germany
- 5.5.3.2 United Kingdom
- 5.5.3.3 France
- 5.5.3.4 Italy
- 5.5.3.5 Spain
- 5.5.3.6 Russia
- 5.5.3.7 NORDIC Countries
- 5.5.3.8 Rest of Europe
- 5.5.4 South America
- 5.5.4.1 Brazil
- 5.5.4.2 Argentina
- 5.5.4.3 Rest of South America
- 5.5.5 Middle East and Africa
- 5.5.5.1 Saudi Arabia
- 5.5.5.2 South Africa
- 5.5.5.3 Rest of Middle East and Africa
- 5.5.1 Asia-Pacific
6 Competitive Landscape
- 6.1 Market Concentration
- 6.2 Strategic Moves
- 6.3 Market Share(%)/Ranking Analysis
- 6.4 Company Profiles (includes Global level overview, market level overview, core segments, financials, strategic information, market rank/share, products and services, recent developments)
- 6.4.1 ArcelorMittal
- 6.4.2 CMC (Commercial Metals Company )
- 6.4.3 Daido Steel Co., Ltd.
- 6.4.4 EMSTEEL
- 6.4.5 Gerdau S/A
- 6.4.6 Hybar LLC
- 6.4.7 Hyundai Steel
- 6.4.8 JFE Steel Corporation
- 6.4.9 Jiangsu Shagang Group Su
- 6.4.10 JSW
- 6.4.11 Kobe Steel, Ltd.
- 6.4.12 NIPPON STEEL CORPORATION
- 6.4.13 Nucor Corporation
- 6.4.14 POSCO
- 6.4.15 SAIL
- 6.4.16 Sohar Steel LLC
- 6.4.17 Stecol International Pvt. Ltd.
- 6.4.18 Steel Dynamics
- 6.4.19 Tata Steel
7 Market Opportunities and Future Outlook
- 7.1 White-space and Unmet-Need Assessment

 全球鋼筋市場:按類型、製程、塗佈類型、鋼筋直徑、最終用途產業和地區分類-預測至2031年
 2026年全球光亮鋼棒市場報告
 2026-2030年全球TMT鋼筋市場
 鋼筋市場-2026-2032年全球市場預測熱機械處理鋼筋市場:2026-2032年全球市場預測(依產品類型、等級、尺寸範圍、產品形態、表面處理、最終用戶和通路分類)
 鋼筋市場規模、佔有率和趨勢分析報告:按應用、地區和細分市場預測(2026-2033 年)
 圓鋼市場:依材料類型、直徑範圍、製造流程、最終用途產業、應用、分銷通路及地區分類。
 2026-2030年全球鋼筋市場2026年全球鋼筋市場報告特種不鏽鋼棒材市場:依產品類型、製造流程、等級、應用和通路分類,全球預測(2026-2032年)