

 |
市場調查報告書
商品編碼
2114662
壓縮天然氣(CNG)加氣機:市場佔有率分析、產業趨勢與統計、成長預測(2026-2031)Compressed Natural Gas (CNG) Dispenser - Market Share Analysis, Industry Trends & Statistics, Growth Forecasts (2026 - 2031) |
||||||

※ 本網頁內容可能與最新版本有所差異。詳細情況請與我們聯繫。
預計壓縮天然氣 (CNG) 加氣機市場將從 2025 年的 2.9075 億美元成長到 2026 年的 3.1743 億美元,到 2031 年將達到 4.9261 億美元,2026 年至 2031 年的複合年成長率為 9.18%。
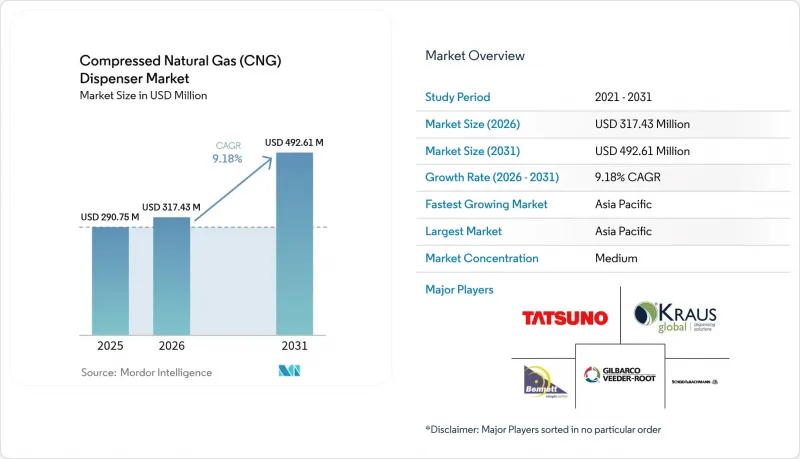
本報告按加油機配置(單管、雙管、多管)、加油站類型(快速加註、定時加註、移動/可攜式)、最終用戶(公共零售加油站、私家車停車場、公共交通和公共汽車、工業和採礦設施)以及地區(北美、歐洲、亞太地區、南美、中東和非洲)進行分類。
全球壓縮天然氣(CNG)加氣機市場趨勢及洞察
政府獎勵和CNG加氣站的快速發展
聯邦政府的支持正在重建壓縮天然氣(CNG)加氣機市場的經濟基礎。美國將在2025年前提供27個州6.35億美元的津貼,直接補貼貨運走廊加氣機的安裝。 《基礎建設投資與就業法案》將在五年內累計25億美元用於替代燃料走廊建設,提供多層次的資金支持以降低資本風險。加州透過其清潔交通計畫額外投入9,520萬美元,並提供30%的聯邦稅額扣抵硬體購置成本。加拿大各省也提供類似的獎勵,猶他州和喬治亞也提供轉換補貼,這些都在擴大支持網路。專案成本的降低縮短了投資回收期,鼓勵營運商將高容量、相容氫氣的加氣機作為面向未來的設備。
降低車隊營運商的總擁有成本
天然氣價格持續優於柴油,預計2025年,其平均價格將比柴油價格低1.17美元/加侖。諸如康明斯X15N等大型引擎可提供1850磅英尺的扭矩,同時無需使用柴油廢氣處理液(DEF),從而降低運行成本和維護停機時間。輕型雙燃料皮卡的綜合續航里程約為650英里,排放氣體汽油車降低13%至40%。使用專用加氣站的車隊營運商可以透過簽訂多年天然氣供應合約來規避原油價格波動帶來的預算風險。這些經濟優勢的綜合作用正在推動採購計畫的實施,並持續推動CNG加氣機市場的發展。
快速加油站的初始資本支出(CAPEX)較高
一座四車道快速加油站的承包安裝成本可能超過180萬美元,大約是同等柴油加油站成本的兩倍。在客流量預測不確定的農村地區,資金籌措難度較大,銀行往往不願放貸,利率也較高。小規模業者通常會推遲大規模加油站的建設,轉而選擇按時段計費的加油方式或移動式加油拖車。雖然美國聯邦政府提供的30%稅額扣抵可以緩解資金需求,但許多項目仍需等待與主要租戶簽訂契約,確保最低使用量後才能啟動。
細分市場分析
即使到了2025年,由於入門成本低,單管系統仍將維持44.15%的銷售佔有率。同時,隨著營運商致力於提高高峰時段的排隊周轉率,多管型號預計將以12.7%的複合年成長率成長。雙管裝置面積小於四車道滑橇式裝置,適用於冗餘性至關重要的中型車隊。 Wayne Helix 6000 II 具備雲端遙測功能,可實現遠端流量檢驗和預測性零件更換,進而降低生命週期成本。更短的加氣時間可提高每個噴嘴每日的交易量,從而提高投資回報率 (ROI),並活性化CNG 加氣機市場對先進加氣頭的資本投資,尤其是在配置升級方面。
在維修工程中,加油站業主正在用雙管擺臂式加氣機替換單管加氣機,這種加氣機可同時滿足3000 psig和3600 psig車輛的加氣需求,同時保留現有的加氣島。這項改造計畫正在大都會圈公車場站加速推進,這些公車場站每晚需要為多達300輛公車加氣。由於氣體管網壓縮能力的提升,入口壓力增加了15 psi,而多管加氣機的升級使得儲氣罐能夠更快地達到其額定切斷壓力,從而在相同的服務時間內為更多用戶提供服務。
區域分析
亞太地區是全球市場的驅動力,預計到2025年將佔全球銷售額的47.95%,並在2031年之前維持10.4%的複合年成長率。印度的加氣站預計到2025年將超過7,400個,這將為區域基礎建設奠定基礎。中國2023年的CNG消費量將達到389億立方米,充分展現了其龐大的市場規模,而城市空氣品質法規的訂定也進一步加速了CNG在公車上的應用。日本和韓國正在出口閥門、感測器和支付終端等技術,形成垂直整合的供應鏈,從而促進先進加氣設備的本地化組裝。
在北美,一項25億美元的走廊發展基金以及6.35億美元的自由支配撥款正被用於在27個州擴大壓縮天然氣(CNG)的部署。加州30%的稅額扣抵和9,520萬美元的清潔交通預算正在推動新建加氣站。該地區擁有約15.6萬輛天然氣汽車(NGV),其中許多集中在垃圾收集、小包裹遞送和市政交通領域。這為營運商提供了可預測的吞吐量,並且在CNG加氣站市場已經形成了一個穩定的升級套件售後市場。
在南美洲,已有超過500萬輛天然氣汽車運作,這主要得益於阿根廷的售後改裝市場以及玻利維亞52%的普及率。巴西石油公司(Petrobras)正在開發一條日產120萬立方公尺的生物甲烷生產線,以供應現有的天然氣供應網路,確保加油站的穩定供應。政策主導的燃油價格折扣以及擴大對歐盟III柴油引擎卡車的禁令預計將在中期內提振需求。
儘管歐洲在天然氣汽車數量上落後於其他國家,但它正透過制定氫燃料相容的加氣站標準來展現技術發展方向。在德國,預計第1,000台可使用氫氣(H2)和壓縮天然氣(CNG)的香腸式加氣機將於2025年投入運作,這標誌著雙燃料加氣站的發展進程。歐洲對通過RED II認證的可再生氣體的重視,正在推動計量表的升級和可追溯性模組的引入,而這些又反過來促使服務合約的簽訂,並最終提升了歐洲CNG加氣機市場的佔有率。
其他好處:
- Excel格式的市場預測(ME)表
- 3個月的分析師支持
目錄
第1章:引言
- 研究假設和市場定義
- 調查範圍
第2章:調查方法
第3章執行摘要
第4章 市場狀況
- 市場概覽
- 市場促進因素
- 政府激勵措施和CNG加氣站的快速發展
- 降低車隊營運商的總擁有成本
- 亞洲和南美洲的天然氣汽車銷售成長
- 利用物聯網進行預測性維護,可減少加油機運作。
- 適用於多能源加氣站的氫氣相容型模組化燃料分配器
- 甲烷洩漏監測標準的日益嚴格正在推動計量表的更換。
- 市場限制因素
- 高速加油站需要大量的初始資本支出(CAPEX)。
- 電動車充電基礎設施的建設給基礎設施預算帶來了壓力。
- 由於氣體品質變化而導致的校準和品質保證問題
- 缺乏超過 300 巴高壓連接器的國際標準。
- 供應鏈分析
- 監理情勢
- 技術展望
- 波特五力模型
第5章 市場規模與成長預測
- 分配器配置
- 單管
- 雙管
- 多管
- 依站點類型
- 快速填充
- 時間填充
- 行動/可攜式
- 最終用戶
- 公共零售站
- 私家車停車場
- 公共交通和公共汽車
- 工業和採礦設施
- 按地區
- 北美洲
- 美國
- 加拿大
- 墨西哥
- 歐洲
- 德國
- 英國
- 法國
- 義大利
- 北歐國家
- 俄羅斯
- 其他歐洲國家
- 亞太地區
- 中國
- 印度
- 日本
- 韓國
- 東南亞國協
- 其他亞太國家
- 南美洲
- 巴西
- 阿根廷
- 其他南美國家
- 中東和非洲
- 沙烏地阿拉伯
- 阿拉伯聯合大公國
- 南非
- 埃及
- 其他中東和非洲國家
- 北美洲
第6章 競爭情勢
- 市場集中度
- 策略趨勢(併購、聯盟、購電協議)
- 市場佔有率分析(主要公司的市場排名和市場佔有率)
- 公司簡介
- Gilbarco Veeder-Root(ANGI)
- Tatsuno Corporation
- Kraus Global
- Bennett Pump Company
- Scheidt & Bachmann
- Sanki Industry Group
- Censtar Science & Technology
- Parker Hannifin
- Tulsa Gas Technologies
- Greka Engineering
- OPW(Dover)
- Chart Industries
- FTI International Group
- Bosch Rexroth
- WEH GmbH
- Primo Gas Mobility
- IDEX Corporation(Banjo)
- NIHON SEIKI
- Compac Industries
- Gilmore Valve
第7章 市場機會與未來展望
According to Mordor Intelligence, the compressed natural gas dispenser market size is expected to grow from USD 290.75 million in 2025 to USD 317.43 million in 2026 and is forecast to reach USD 492.61 million by 2031 at 9.18% CAGR over 2026-2031.
This report is Segmented by Dispenser Configuration (Single-Hose, Dual-Hose, and Multi-Hose), Station Type (Fast-Fill, Time-Fill, and Mobile/Portable), End-User (Public Retail Stations, Private Fleet Depots, Transit and Bus Fleets, and Industrial and Mining Sites), and Geography (North America, Europe, Asia-Pacific, South America, and Middle East and Africa).
Global Compressed Natural Gas (CNG) Dispenser Market Trends and Insights
Government incentives & rapid CNG station build-outs
Federal backing reshapes economic fundamentals for the CNG dispenser market. The United States awarded USD 635 million in 2025 grants covering 27 states, directly subsidizing dispenser installations for freight corridors. The Infrastructure Investment and Jobs Act earmarks USD 2.5 billion over five years for alternative-fuel corridors, providing multi-layered funding that reduces capital risk. California adds USD 95.2 million through its Clean Transportation Program, while a 30% federal tax credit lowers out-of-pocket hardware costs. Similar provincial incentives in Canada and conversion credits in Utah and Georgia expand the support network. Reduced effective project costs shorten payback periods and encourage operators to specify higher-throughput, hydrogen-compatible dispensers that future-proof installations.
Lower total-cost-of-ownership for fleet operators
Natural gas maintains a durable price discount to diesel, averaging USD 1.17 per diesel gallon equivalent in 2025. Heavy-duty engines, such as Cummins' X15N, provide 1,850 lb-ft of torque while eliminating the need for diesel exhaust fluid, thereby cutting running expenses and maintenance downtime. Light-duty bi-fuel pickups achieve combined ranges of nearly 650 miles and realize emission reductions of 13-40% compared to gasoline alternatives. Fleet operators leveraging private time-fill depots lock in multiyear gas contracts, insulating budgets from oil-price volatility. Collectively, these economics bolster procurement plans and funnel recurring demand into the CNG dispenser market.
High up-front CAPEX for fast-fill stations
Turn-key installation for a four-lane fast-fill site can exceed USD 1.8 million, roughly double the outlay of a comparable diesel facility. Financing hurdles rise in rural corridors where throughput forecasts remain uncertain, leading to bank reluctance or higher interest rates. Smaller operators often pivot to time-fill or mobile trailers, postponing large-scale station construction. Although a 30% U.S. federal credit softens cash demands, many projects stall until anchor-tenant agreements guarantee baseline volume.
Other drivers and restraints analyzed in the detailed report include:
- Rising NGV sales in Asia & South America
- IoT-enabled predictive maintenance
- EV-charging roll-out diverting infrastructure budgets
For complete list of drivers and restraints, kindly check the Table Of Contents.
Segment Analysis
The single-hose format retained a 44.15% revenue share in 2025 due to its low entry cost, while multi-hose models are slated for a 12.7% CAGR as operators pursue faster queue turnover during peak hours. Dual-hose units serve midsize fleets that value redundancy without the footprint of four-lane skids. The Wayne Helix 6000 II features cloud telemetry, enabling remote flow validation and predictive part replacement, which reduces life-cycle costs. Shorter fill times translate into higher daily transactions per nozzle, improving return on investment and intensifying capital expenditure for advanced heads in the CNG dispenser market, particularly for configuration upgrades.
Across retrofit programs, station owners replace single hoses with two-hose swing arms that accommodate both 3,000 psig and 3,600 psig vehicles while retaining the original island. Adoption accelerates at metropolitan bus depots that must refuel up to 300 units nightly. Multi-hose up-ratings also dovetail with 15 psi inlet-pressure boosts stemming from grid-compression expansions, which allow tanks to reach nominal cut-out faster and cycle more customers during the same service window.
Complete Report Scope:
- By Dispenser Configuration
- Single-Hose
- Dual-Hose
- Multi-Hose
- By Station Type
- Fast-Fill
- Time-Fill
- Mobile/Portable
- By End-User
- Public Retail Stations
- Private Fleet Depots
- Transit and Bus Fleets
- Industrial and Mining Sites
- By Geography
- North America
- United States
- Canada
- Mexico
- Europe
- Germany
- United Kingdom
- France
- Italy
- NORDIC Countries
- Russia
- Rest of Europe
- Asia-Pacific
- China
- India
- Japan
- South Korea
- ASEAN Countries
- Rest of Asia-Pacific
- South America
- Brazil
- Argentina
- Rest of South America
- Middle East and Africa
- Saudi Arabia
- United Arab Emirates
- South Africa
- Egypt
- Rest of Middle East and Africa
- North America
Geography Analysis
The Asia-Pacific region dominates the global landscape, accounting for a 47.95% revenue share in 2025 and is projected to grow at a 10.4% CAGR through 2031. India's station count is on track to surpass 7,400 by FY 2025, anchoring regional infrastructure depth. China's 38.9 billion m3 CNG consumption in 2023 underscores the massive scale, and municipal air-quality rules are pushing additional bus fleet conversions. Japan and South Korea contribute technology exports-valves, sensors, and payment terminals-creating a vertically integrated supply chain that favors local assembly of advanced dispensers.
North America leverages USD 2.5 billion in corridor funding plus USD 635 million in discretionary awards to extend coverage across 27 states. California's 30% tax credit and 95.2 million clean-transport budget catalyze incremental forecourt builds. The region hosts about 156,000 NGVs-concentrated in trash collection, parcel delivery, and municipal fleets-providing predictable throughput for operators and a stable aftermarket for upgrade kits within the CNG dispenser market.
South America sustains over 5 million NGVs, spearheaded by Argentina's aftermarket conversion market and Bolivia's 52% penetration. Petrobras is installing 1.2 million m3/d biomethane capacity that will feed existing gas grids, ensuring a stable supply for dispensers. Policy-driven pump-price discounts and widening trucking bans on Euro III diesel engines are expected to bolster medium-term demand.
Europe lags in NGV volumes but sets the technical direction through hydrogen-ready forecourt standards. Germany's 1,000th combined H2/CNG sausage-type dispenser came online in 2025, marking the evolution of dual-fuel sites. The continent's focus on renewable gas certificated via RED II drives meter upgrades and traceability modules, compelling service contracts that enrich the European slice of the CNG dispenser market.
- Gilbarco Veeder-Root (ANGI)
- Tatsuno Corporation
- Kraus Global
- Bennett Pump Company
- Scheidt & Bachmann
- Sanki Industry Group
- Censtar Science & Technology
- Parker Hannifin
- Tulsa Gas Technologies
- Greka Engineering
- OPW (Dover)
- Chart Industries
- FTI International Group
- Bosch Rexroth
- WEH GmbH
- Primo Gas Mobility
- IDEX Corporation (Banjo)
- NIHON SEIKI
- Compac Industries
- Gilmore Valve
Additional Benefits:
- The market estimate (ME) sheet in Excel format
- 3 months of analyst support
TABLE OF CONTENTS
1 Introduction
- 1.1 Study Assumptions & Market Definition
- 1.2 Scope of the Study
2 Research Methodology
3 Executive Summary
4 Market Landscape
- 4.1 Market Overview
- 4.2 Market Drivers
- 4.2.1 Government incentives & rapid CNG station build-outs
- 4.2.2 Lower total-cost-of-ownership for fleet operators
- 4.2.3 Rising NGV sales in Asia & South America
- 4.2.4 IoT-enabled predictive maintenance cutting dispenser downtime
- 4.2.5 Hydrogen-ready modular dispensers for multi-energy forecourts
- 4.2.6 Stricter methane-slip monitoring driving meter upgrades
- 4.3 Market Restraints
- 4.3.1 High up-front CAPEX for fast-fill stations
- 4.3.2 EV-charging roll-out diverting infrastructure budgets
- 4.3.3 Gas-quality variability causing calibration/warranty issues
- 4.3.4 Lack of global standards for >300 bar heavy-duty connectors
- 4.4 Supply-Chain Analysis
- 4.5 Regulatory Landscape
- 4.6 Technological Outlook
- 4.7 Porter's Five Forces
- 4.7.1 Bargaining Power of Suppliers
- 4.7.2 Bargaining Power of Consumers
- 4.7.3 Threat of New Entrants
- 4.7.4 Threat of Substitutes
- 4.7.5 Intensity of Competitive Rivalry
5 Market Size & Growth Forecasts
- 5.1 By Dispenser Configuration
- 5.1.1 Single-Hose
- 5.1.2 Dual-Hose
- 5.1.3 Multi-Hose
- 5.2 By Station Type
- 5.2.1 Fast-Fill
- 5.2.2 Time-Fill
- 5.2.3 Mobile/Portable
- 5.3 By End-User
- 5.3.1 Public Retail Stations
- 5.3.2 Private Fleet Depots
- 5.3.3 Transit and Bus Fleets
- 5.3.4 Industrial and Mining Sites
- 5.4 By Geography
- 5.4.1 North America
- 5.4.1.1 United States
- 5.4.1.2 Canada
- 5.4.1.3 Mexico
- 5.4.2 Europe
- 5.4.2.1 Germany
- 5.4.2.2 United Kingdom
- 5.4.2.3 France
- 5.4.2.4 Italy
- 5.4.2.5 NORDIC Countries
- 5.4.2.6 Russia
- 5.4.2.7 Rest of Europe
- 5.4.3 Asia-Pacific
- 5.4.3.1 China
- 5.4.3.2 India
- 5.4.3.3 Japan
- 5.4.3.4 South Korea
- 5.4.3.5 ASEAN Countries
- 5.4.3.6 Rest of Asia-Pacific
- 5.4.4 South America
- 5.4.4.1 Brazil
- 5.4.4.2 Argentina
- 5.4.4.3 Rest of South America
- 5.4.5 Middle East and Africa
- 5.4.5.1 Saudi Arabia
- 5.4.5.2 United Arab Emirates
- 5.4.5.3 South Africa
- 5.4.5.4 Egypt
- 5.4.5.5 Rest of Middle East and Africa
- 5.4.1 North America
6 Competitive Landscape
- 6.1 Market Concentration
- 6.2 Strategic Moves (M&A, Partnerships, PPAs)
- 6.3 Market Share Analysis (Market Rank/Share for key companies)
- 6.4 Company Profiles (includes Global level Overview, Market level overview, Core Segments, Financials as available, Strategic Information, Products & Services, and Recent Developments)
- 6.4.1 Gilbarco Veeder-Root (ANGI)
- 6.4.2 Tatsuno Corporation
- 6.4.3 Kraus Global
- 6.4.4 Bennett Pump Company
- 6.4.5 Scheidt & Bachmann
- 6.4.6 Sanki Industry Group
- 6.4.7 Censtar Science & Technology
- 6.4.8 Parker Hannifin
- 6.4.9 Tulsa Gas Technologies
- 6.4.10 Greka Engineering
- 6.4.11 OPW (Dover)
- 6.4.12 Chart Industries
- 6.4.13 FTI International Group
- 6.4.14 Bosch Rexroth
- 6.4.15 WEH GmbH
- 6.4.16 Primo Gas Mobility
- 6.4.17 IDEX Corporation (Banjo)
- 6.4.18 NIHON SEIKI
- 6.4.19 Compac Industries
- 6.4.20 Gilmore Valve
7 Market Opportunities & Future Outlook
- 7.1 White-Space & Unmet-Need Assessment

 CNG加氣機市場:按加氣方式、技術、流量、壓力、安裝方式、運作模式和最終用戶分類-全球市場預測(2026-2032年)
 CNG灌裝機全球市場規模、佔有率、趨勢及成長分析報告(2026-2034年)
 CNG加氣機市場 - 全球產業規模、佔有率、趨勢、機會及預測(按類型、銷售、分銷、地區和競爭格局分類,2021-2031年)
 CNG加氣機市場規模、佔有率和成長分析(按類型、分銷、銷售和地區分類)-產業預測(2026-2033年)壓縮天然氣分配器市場-全球產業規模、佔有率、趨勢、機會與預測(細分、按類型、按分佈、按地區、按競爭,2020-2030 年)全球 CNG 加氣機市場規模(依加氣機類型、流量、分佈、區域範圍、預測)
 中東和非洲壓縮天然氣加氣機:市場佔有率分析、產業趨勢和成長預測(2025-2030)東南亞壓縮天然氣加氣機:市場佔有率分析、產業趨勢與成長預測(2025-2030 年)歐洲壓縮天然氣加氣機:市場佔有率分析、產業趨勢、成長預測(2025-2030)