


 |
市場調查報告書
商品編碼
2114485
熔接機:市場佔有率分析、產業趨勢與統計、成長預測(2026-2031)Fusion Splicer - Market Share Analysis, Industry Trends & Statistics, Growth Forecasts (2026 - 2031) |
||||||

※ 本網頁內容可能與最新版本有所差異。詳細情況請與我們聯繫。
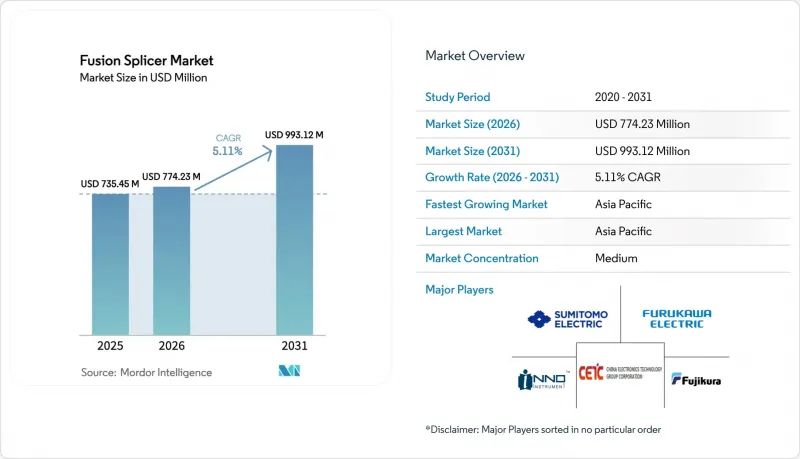
根據 Mordor Intelligence 預測,熔接機市場規模將從 2025 年的 7.3545 億美元成長到 2026 年的 7.7423 億美元,到 2031 年將達到 9.9312 億美元,2026 年至 2031 年的複合成長率為 5.11%。
本報告按對準類型(纖芯對準、包層對準)、產品類型(單芯光纖、帶狀光纖、特種光纖)、最終用戶(電信運營商、資料中心、承包商和系統整合商、航太和國防)、應用領域(電信、有線電視、企業/本地部署、研究/特殊應用)以及地區進行細分。市場預測以美元(USD)為單位。
全球熔接機市場趨勢與洞察
超大規模資料中心建設激增
超大規模營運商的伺服器容量成長速度遠超傳統企業的建設週期。每個資料連接埠需要數萬個低損耗光纖端接點,而400G-800G光收發器則需要並行光纖帶,這導致熔接數量顯著增加。 2024年,超大規模容量成長了18%,這主要得益於120座新設施的建設,進而推高了全球對光纖熔接的需求。承包商目前採用12芯和24芯光纖帶單元,將熔接時間縮短至90秒以內,從而提高勞動生產率,並確保高光纖互連的穩定光性能。
加速5G回程傳輸傳光纖的部署。
行動電信商持續提升中頻段和毫米波頻段的基地台密度,每個小型基地台節點都需要多條專用光纖。中國計畫在2024年鋪設超過300萬個5G基地台的光纖,這項建設工程預計將產生遠超傳統宏架構所能處理的熔接點數量。隨著現場工作人員爭分奪秒地完成部署,市場對能夠承受空中和地下惡劣環境的電池供電可攜式熔接機的需求日益成長。
合格光纖連接技術人員短缺
光是在美國,預計到2029年將出現70萬名合格光纖技術人員的缺口,這將導致計畫工期延長和人事費用上升。歐洲也出現了類似的招聘延誤情況,安裝工人的職位空缺持續時間是普通建築工人的兩倍。雖然人工智慧設備可以縮短培訓時間,但複雜的帶狀光纖和特種光纖作業仍然需要經驗豐富的專業人員,這限制了在農村和偏遠地區的部署速度。
細分市場分析
預計到2025年,纖芯對準系統將佔熔接機市場收入的63%,凸顯其在長途和城域骨幹網路中的重要性,因為在這些網路中,超低損耗至關重要。高精度成像技術可將光纖纖芯對準至亞微米級精度,從而將衰減降低至0.02–0.05 dB。隨著電信業者將現有設備升級為人工智慧輔助系統,纖芯對準熔接機可望繼續維持其市場領先地位。
同時,由於量子感測和航太專案中非標準光纖形狀的使用(在這些專案中,基於纖芯的對準方式無法實現),對包層對準的需求也在不斷成長,年複合成長率高達5.87%。由於包層對準設備的價格通常比纖芯對準設備低15-20%,承包商可以在不超出預算的情況下承接特殊專案。製造商目前正在推出具有可切換模式的混合平台,使單一底盤可滿足主流和特定領域的需求。
由於單纖型號在接入線路和企業級線路中的多功能性,預計到2025年,單纖型號仍將佔58%的銷售額。同時,帶狀熔接機的成長速度更快,達到6.12%,因為它們可以將12根光纖一次性熔接,從而將工作時間縮短高達85%。隨著400G和800G收發器在超大規模資料中心的普及,帶狀熔接機的市場佔有率預計將進一步擴大。
儘管專用光纖設備的出貨量不高,但其價格卻很高,佔供應商總出貨量的8%,卻貢獻了18%的供應商收入。用於國防、量子和雷射系統的光子晶體光纖和保偏光纖是這一細分市場的主要驅動力,供應商透過可程式設計電弧曲線和滿足關鍵任務可靠性標準的延長保固期來脫穎而出。
區域分析
預計到2025年,亞太地區將佔總收入的42.1%。中國電信業者在2024年新增了6,500萬條光纖到府(FTTH)線路,而印度的BharatNet計畫在2026年實現村級網路連線。日本、韓國和新加坡正致力於升級到Gigabit無源光纖網路,這需要在分發樞紐實現低損耗重連。東南亞新興經濟體,例如印尼和越南,正在擴展其行動回程,並傾向於使用耐環境的可攜式設備進行架空和地下佈線。
北美是最大的區域市場,這主要得益於農村地區的基礎設施建設和資料中心的持續擴張。 BEAD 的資金支持確保了承包商向服務欠缺地區擴展光纖網路的多年設備訂單,而超大規模營運商在阿什本、鳳凰城和哥倫布等叢集對帶狀光纖熔接機的需求也居高不下。加拿大的通用寬頻基金也呈現類似的趨勢,尤其是在冬季嚴寒、需要更耐用現場硬體的省份。
歐洲各地的情況不盡相同。在斯堪地那維亞,光纖普及率已接近100%,供應商正將重心轉向資料中心的設備更新和扁平電纜升級。南歐和東歐市場發展落後,但「歐盟數位十年」計畫旨在2030年為所有家庭提供Gigabit連接,隨著國家津貼的陸續發放,預計採購量將加速成長。中東和非洲的絕對數量雖然落後,但成長速度卻位居前列。這主要得益於沿岸地區的大型大型企劃以及非洲部分大都會圈的5G回程傳輸,營運商正在將流量從擁擠的微波鏈路轉移到光纖網路。
其他好處:
- Excel格式的市場預測(ME)表
- 3個月的分析師支持
目錄
第1章:引言
- 研究假設和市場定義
- 調查範圍
第2章:調查方法
第3章執行摘要
第4章 市場狀況
- 市場概覽
- 市場促進因素
- 5G回程傳輸傳光纖的部署正在加速。
- 增加對北美和亞太地區農村地區的寬頻資金投入
- 超大規模資料中心的建設正在蓬勃發展。
- 從機械融合剪接過渡到自動化融合剪接
- 引進人工智慧驅動的自動對準拼接器
- 特種光纖在量子技術和感測應用的廣泛應用
- 市場限制因素
- 承包商初始設備成本高
- 合格光纖技術人員短缺
- 來自低成本中國新參與企業的價格壓力
- 稀土元素電極材料價格波動
- 宏觀經濟因素對市場的影響
- 產業價值鏈分析
- 監理情勢
- 技術展望
- 波特五力分析
第5章 市場規模與成長預測
- 對齊類型
- 核心對齊
- 覆層層對齊
- 依產品類型
- 單纖熔接機
- 帶狀光纖熔接機
- 特種光纖熔接機
- 最終用戶
- 電信營運商
- 資料中心
- 承包商和系統整合商
- 航太/國防
- 透過使用
- 電訊
- 有線電視
- 設施和企業
- 研究和特殊用途
- 按地區
- 北美洲
- 美國
- 加拿大
- 墨西哥
- 南美洲
- 巴西
- 其他南美國家
- 歐洲
- 德國
- 法國
- 英國
- 其他歐洲國家
- 亞太地區
- 中國
- 日本
- 印度
- 其他亞太國家
- 中東
- 波灣合作理事會
- 其他中東國家
- 非洲
- 南非
- 其他非洲國家
- 北美洲
第6章 競爭情勢
- 市場集中度
- 策略趨勢
- 市佔率分析
- 公司簡介
- Fujikura Ltd.
- Sumitomo Electric Industries, Ltd.
- Furukawa Electric Co., Ltd.
- INNO Instrument Inc.
- Ilsintech Co., Ltd.
- AFL Telecommunications LLC
- Corning Incorporated
- 3SAE Technologies, Inc.
- UCL Swift Co., Ltd.
- Darkhorsechina(Beijing)Telecom Technology Co., Ltd.
- Nanjing Jilong Optical Communication Co., Ltd.
- Shenzhen Ruiyan Communication Equipment Co., Ltd.
- Signal Fire Technology Co., Ltd.
- Shanghai Xianghe Optical Communication Co., Ltd.
- COMWAY Technology LLC
- Skycom Fibre Ltd.
- GAO Tek Inc.
- Thorlabs, Inc.
- Viavi Solutions Inc.
- EXFO Inc.
第7章 市場機會與未來展望
According to Mordor Intelligence, the fusion splicer market size is expected to grow from USD 735.45 million in 2025 to USD 774.23 million in 2026 and is forecast to reach USD 993.12 million by 2031 at 5.11% CAGR over 2026-2031.
This report is Segmented by Alignment Type (Core Alignment, Cladding Alignment), Product Type (Single-Fiber, Ribbon-Fiber, Specialty-Fiber), End-User (Telecom Operators, Data Centers, Contractors and System Integrators, Aerospace and Defense), Application (Telecommunications, Cable TV, Premises and Enterprise, Research and Specialty), and Geography. The Market Forecasts are Provided in Terms of Value (USD).
Global Fusion Splicer Market Trends and Insights
Surge in Hyperscale Data Center Construction
Hyperscale operators are adding server capacity at a pace that eclipses traditional enterprise build cycles. Each data hall requires tens of thousands of low-loss fiber terminations, and 400 G to 800 G optical transceivers demand parallel fiber ribbons that magnify splice counts. In 2024 hyperscale capacity grew 18%, underpinned by 120 new facilities that collectively stretched global splice demand. Contractors now specify 12- and 24-fiber ribbon units that cut per-splice time to under 90 seconds, improving labor productivity and ensuring consistent optical performance across high-fiber-count interconnects.
Accelerating 5G Backhaul Fiber Deployment
Mobile operators continue to densify mid-band and millimeter-wave cells, with each small-cell node requiring several dedicated fibers. China plans to install fiber to more than 3 million 5G base stations by 2024, a build that will multiply splice points well beyond legacy macro architectures. Portable, battery-driven splicers that withstand aerial and underground conditions are in high demand as field crews race to meet rollout deadlines.
Shortage of Certified Fiber-Splicing Technicians
The United States alone faces a projected deficit of 700,000 qualified fiber technicians through 2029, a gap that prolongs project timelines and inflates labor rates. Europe reports similar hiring delays, with vacancies for installers remaining open twice as long as general construction trades. Although AI-enabled units reduce the learning curve, complex ribbon or specialty fiber tasks still require experienced personnel, limiting deployment velocity in rural and remote builds.
Other drivers and restraints analyzed in the detailed report include:
- Rising Rural Broadband Funds
- Transition From Mechanical to Automated Fusion Splicing
- High Up-Front Equipment Costs for Contractors
For complete list of drivers and restraints, kindly check the Table Of Contents.
Segment Analysis
Core-alignment systems delivered 63% of fusion splicer market revenue in 2025, underscoring their role in long-haul and metro backbones where ultralow loss is mandatory. Precise imaging aligns fiber cores within sub-micron tolerances, holding attenuation to 0.02-0.05 dB. The fusion splicer market size for core-alignment units is projected to stay ahead as telecom operators refresh existing fleets for AI-assisted versions.
Cladding-alignment demand is nevertheless climbing, expanding at a 5.87% CAGR as quantum sensing and aerospace programs rely on non-standard fiber geometries that preclude core-based alignment. Lower equipment prices, typically 15-20% below core units, help contractors address specialty projects without straining budgets. Manufacturers are now introducing hybrid platforms that toggle between modes, ensuring one chassis covers both mainstream and niche requirements.
Single-fiber models retained 58% of 2025 revenue owing to their versatility across access and enterprise links. Yet ribbon splicers are on a faster 6.12% trajectory because a single 12-fiber splice replaces a dozen sequential terminations, cutting labor time by up to 85%. The fusion splicer market share for ribbon equipment is poised to widen further as 400 G and 800 G transceivers proliferate across hyperscale sites.
Specialty-fiber units occupy a small volume yet command premium pricing, capturing 18% of vendor revenue on just 8% of shipments. Photonic crystal and polarization-maintaining fibers used in defense, quantum, and laser systems drive this niche, and vendors differentiate through programmable arc profiles and extended warranties that align with mission-critical reliability standards.
Complete Report Scope:
- By Alignment Type
- Core Alignment
- Cladding Alignment
- By Product Type
- Single-Fiber Fusion Splicer
- Ribbon-Fiber Fusion Splicer
- Specialty-Fiber Fusion Splicer
- By End-User
- Telecom Operators
- Data Centers
- Contractors and System Integrators
- Aerospace and Defense
- By Application
- Telecommunications
- Cable TV
- Premises and Enterprise
- Research and Specialty Applications
- By Geography
- North America
- United States
- Canada
- Mexico
- South America
- Brazil
- Rest of South America
- Europe
- Germany
- France
- United Kingdom
- Rest of Europe
- Asia-Pacific
- China
- Japan
- India
- Rest of Asia-Pacific
- Middle East
- Gulf Cooperation Council
- Rest of Middle East
- Africa
- South Africa
- Rest of Africa
- North America
Geography Analysis
the Asia-Pacific accounted for 42.1% of 2025 revenue. China's operators added 65 million new fiber-to-the-home lines in 2024, while India's BharatNet targets village-level connectivity by 2026. Japan, South Korea, and Singapore focus on 10-gigabit passive optical network upgrades that require low-loss re-splicing at distribution hubs. Emerging Southeast Asian economies such as Indonesia and Vietnam are scaling mobile backhaul, favoring ruggedized portable units for aerial and underground cable runs.
North America is the largest regional market, coupling rural buildouts with relentless data-center additions. BEAD funding ensures multi-year equipment orders from contractors expanding fiber to unserved communities, and hyperscale operators keep ribbon splicer demand elevated around Ashburn, Phoenix, and Columbus clusters. Canada's Universal Broadband Fund mirrors this pattern, especially in provinces with harsh winters that require durable field hardware.
Europe presents a patchwork. Scandinavia approaches universal fiber penetration, shifting vendor focus to replacement cycles and ribbon upgrades in data centers. Southern and Eastern European markets lag, but EU Digital Decade targets gigabit coverage for all households by 2030, translating into accelerated purchases as national programs unlock grants. The Middle East and Africa trail in absolute volume yet post one of the steepest growth slopes, propelled by smart-city mega-projects in the Gulf and 5G backhaul across select African metros where operators migrate traffic from congested microwave links to fiber.
- Fujikura Ltd.
- Sumitomo Electric Industries, Ltd.
- Furukawa Electric Co., Ltd.
- INNO Instrument Inc.
- Ilsintech Co., Ltd.
- AFL Telecommunications LLC
- Corning Incorporated
- 3SAE Technologies, Inc.
- UCL Swift Co., Ltd.
- Darkhorsechina (Beijing) Telecom Technology Co., Ltd.
- Nanjing Jilong Optical Communication Co., Ltd.
- Shenzhen Ruiyan Communication Equipment Co., Ltd.
- Signal Fire Technology Co., Ltd.
- Shanghai Xianghe Optical Communication Co., Ltd.
- COMWAY Technology LLC
- Skycom Fibre Ltd.
- GAO Tek Inc.
- Thorlabs, Inc.
- Viavi Solutions Inc.
- EXFO Inc.
Additional Benefits:
- The market estimate (ME) sheet in Excel format
- 3 months of analyst support
TABLE OF CONTENTS
1 INTRODUCTION
- 1.1 Study Assumptions and Market Definition
- 1.2 Scope of the Study
2 RESEARCH METHODOLOGY
3 EXECUTIVE SUMMARY
4 MARKET LANDSCAPE
- 4.1 Market Overview
- 4.2 Market Drivers
- 4.2.1 Accelerating 5G Backhaul Fiber Deployment
- 4.2.2 Rising Rural Broadband Funds in North America and Asia-Pacific
- 4.2.3 Surge in Hyperscale Data Center Construction
- 4.2.4 Transition From Mechanical to Automated Fusion Splicing
- 4.2.5 Adoption of AI-Enabled Self-Aligning Splicers
- 4.2.6 Growing Use of Specialty Fibers in Quantum and Sensing Applications
- 4.3 Market Restraints
- 4.3.1 High Up-Front Equipment Costs for Contractors
- 4.3.2 Shortage of Certified Fiber-Splicing Technicians
- 4.3.3 Price Pressure From Low-Cost Chinese Entrants
- 4.3.4 Volatility in Rare-Earth Electrode Materials
- 4.4 Impact of Macroeconomic Factors on the Market
- 4.5 Industry Value Chain Analysis
- 4.6 Regulatory Landscape
- 4.7 Technological Outlook
- 4.8 Porter's Five Forces Analysis
- 4.8.1 Threat of New Entrants
- 4.8.2 Bargaining Power of Suppliers
- 4.8.3 Bargaining Power of Buyers
- 4.8.4 Threat of Substitutes
- 4.8.5 Intensity of Competitive Rivalry
5 MARKET SIZE AND GROWTH FORECASTS (VALUE)
- 5.1 By Alignment Type
- 5.1.1 Core Alignment
- 5.1.2 Cladding Alignment
- 5.2 By Product Type
- 5.2.1 Single-Fiber Fusion Splicer
- 5.2.2 Ribbon-Fiber Fusion Splicer
- 5.2.3 Specialty-Fiber Fusion Splicer
- 5.3 By End-User
- 5.3.1 Telecom Operators
- 5.3.2 Data Centers
- 5.3.3 Contractors and System Integrators
- 5.3.4 Aerospace and Defense
- 5.4 By Application
- 5.4.1 Telecommunications
- 5.4.2 Cable TV
- 5.4.3 Premises and Enterprise
- 5.4.4 Research and Specialty Applications
- 5.5 By Geography
- 5.5.1 North America
- 5.5.1.1 United States
- 5.5.1.2 Canada
- 5.5.1.3 Mexico
- 5.5.2 South America
- 5.5.2.1 Brazil
- 5.5.2.2 Rest of South America
- 5.5.3 Europe
- 5.5.3.1 Germany
- 5.5.3.2 France
- 5.5.3.3 United Kingdom
- 5.5.3.4 Rest of Europe
- 5.5.4 Asia-Pacific
- 5.5.4.1 China
- 5.5.4.2 Japan
- 5.5.4.3 India
- 5.5.4.4 Rest of Asia-Pacific
- 5.5.5 Middle East
- 5.5.5.1 Gulf Cooperation Council
- 5.5.5.2 Rest of Middle East
- 5.5.6 Africa
- 5.5.6.1 South Africa
- 5.5.6.2 Rest of Africa
- 5.5.1 North America
6 COMPETITIVE LANDSCAPE
- 6.1 Market Concentration
- 6.2 Strategic Moves
- 6.3 Market Share Analysis
- 6.4 Company Profiles (includes Global Level Overview, Market Level Overview, Core Segments, Financials as available, Strategic Information, Market Rank/Share, Products and Services, and Recent Developments)
- 6.4.1 Fujikura Ltd.
- 6.4.2 Sumitomo Electric Industries, Ltd.
- 6.4.3 Furukawa Electric Co., Ltd.
- 6.4.4 INNO Instrument Inc.
- 6.4.5 Ilsintech Co., Ltd.
- 6.4.6 AFL Telecommunications LLC
- 6.4.7 Corning Incorporated
- 6.4.8 3SAE Technologies, Inc.
- 6.4.9 UCL Swift Co., Ltd.
- 6.4.10 Darkhorsechina (Beijing) Telecom Technology Co., Ltd.
- 6.4.11 Nanjing Jilong Optical Communication Co., Ltd.
- 6.4.12 Shenzhen Ruiyan Communication Equipment Co., Ltd.
- 6.4.13 Signal Fire Technology Co., Ltd.
- 6.4.14 Shanghai Xianghe Optical Communication Co., Ltd.
- 6.4.15 COMWAY Technology LLC
- 6.4.16 Skycom Fibre Ltd.
- 6.4.17 GAO Tek Inc.
- 6.4.18 Thorlabs, Inc.
- 6.4.19 Viavi Solutions Inc.
- 6.4.20 EXFO Inc.
7 MARKET OPPORTUNITIES AND FUTURE OUTLOOK
- 7.1 White-Space and Unmet-Need Assessment


