


 |
市場調查報告書
商品編碼
2114446
園藝照明:市場佔有率分析、產業趨勢與統計、成長預測(2026-2031)Horticulture Lighting - Market Share Analysis, Industry Trends & Statistics, Growth Forecasts (2026 - 2031) |
||||||

※ 本網頁內容可能與最新版本有所差異。詳細情況請與我們聯繫。
根據 Mordor Intelligence 預測,園藝照明市場規模將從 2025 年的 98 億美元和 2026 年的 110.2 億美元成長到 2031 年的 196.2 億美元,2026 年至 2031 年的複合年成長率為 12.23%。
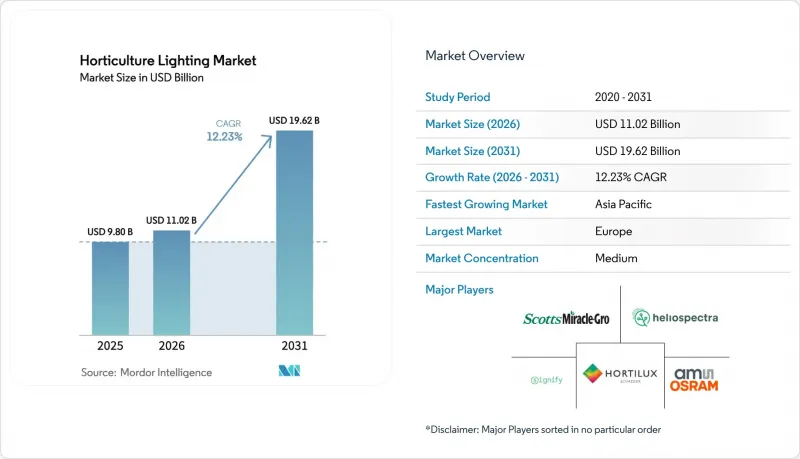
本報告依照明技術(LED、HID、螢光、等離子燈等)、產品(硬體、軟體、服務)、安裝類型(新安裝、維修)、種植類型(蔬果、綠葉類、莓果、番茄辣椒、花卉、大麻等)、應用領域(溫室等)及地區進行細分。市場預測以美元計價。
全球園藝照明市場趨勢與洞察
在北美的大麻種植中,經過精確調整的 LED頻譜正在提高大麻素的產量。
大麻種植者正從寬頻金屬鹵素燈轉向發射波長在 680–730nm 範圍內的遠紅外光的 LED 照明燈具,這可使 THC 和 CBD 的濃度提高 12–18%,並減少 40–50% 的廢熱。預計到 2025 年,該細分市場的規模將達到 15 億美元,隨著美國更多州將醫用和成人用大麻合法化,其年成長率將達到 15%。照明燈具供應商 Fluence 和 California LightWorks 主導著大型設施市場,而 Black Dog LED 的模組化系統則在注重預算的小規模種植者中越來越受歡迎。聯邦大麻監管分類的修訂可能會從 2028 年起加速跨州市場的擴張。
亞洲特大城市的都市區糧食安全計畫正在加速推動對垂直農場照明的需求。
作為「30 by 30」計畫的一部分,新加坡在2024年累計2億新元(約1.48億美元),用於加強糧食安全並減少對進口的依賴。同時,東京在2025年累計50億新元(約3,300萬美元),用於津貼旨在促進城市永續農業實踐的都市農業計畫。首爾智慧農場研發中心已投入運作佔地12公頃的全封閉式農場,該農場採用三星LM301H LED燈,其光效高達3.1微米J⁻¹。這些先進的農業系統配備了每平方公尺成本150至250美元的照明設備,每年可實現10至15次收成。如此高的生產力意味著照明設備的投資回收期不到四年,使得這項技術的投資在經濟上可行且有效率。
鋁和稀土元素價格的急劇上漲給高功率LED照明燈具的利潤率帶來了壓力。
預計到2025年,鋁的平均價格將上漲至每噸2,580美元,這一顯著漲幅將使每個LED照明燈具的組件成本增加6至10美元。成本的激增將給製造商帶來巨大壓力,可能導致其毛利率下降高達12個百分點。此外,中國嚴格的出口配額制度也對稀土元素市場產生了重大影響。這些規定已使氧化銪和鋱铽的價格上漲了30%,進一步加劇了LED磷光體供應商的壓力,並使其業務運作更加複雜。
細分市場分析
到2025年,LED系統將佔據園藝照明市場86.13%的佔有率,這反映出其與高強度氣體放電燈(HID燈)相比,節能效果持續維持在40-50%。受等離子體和其他替代技術的推動,園藝照明市場預計將以12.41%的複合年成長率成長,因為研究機構高度重視380至780奈米的連續頻譜。 LED照明燈具的成本已降至每平方公尺80-150美元,根據矽基氮化鎵(GaN-on-Si)技術藍圖,預計到2028年基板還將進一步下降。
LED技術正朝著10通道可調陣列的方向發展。 Heliospectra公司將於2024年發布的MITRA X平台就是一個典型的例子,它能夠以1%的頻譜解析度模擬從日出到日落的過渡。等離子系統雖然初始投資較高,但每個售價在800到1200美元之間,在高利潤的大麻和鮮切花種植產業中越來越受歡迎。 HID燈在老舊溫室中仍保持著8-10%的市場佔有率,但由於歐盟生態設計法規導致燈泡供應緊張,其受歡迎程度正在下降。
預計到2025年,硬體銷售額將佔總銷售額的71.52%,但由於LED封裝成本下降,平均售價將以每年6-8%的速度下降。軟體和服務則以12.53%的複合年成長率快速成長,例如LumiGrow的smartPAR Cloud等平台,每年每平方公尺收費2-5美元,用於最佳化光子效率。這些SaaS使用費在新垂直農場項目中已占到項目總價值的12-18%。
驅動電子設備現已整合藍牙低功耗 (Bluetooth LE) 和 Zigbee 無線功能,無需有線 DALI 基礎設施,每米安裝成本可降低 8 至 12 美元。由 Deere Infinite Vertical 首創的「節能即服務」模式,雖然無需在製造商的資產負債表中累計照明設備成本,但由於測量和檢驗的法律複雜性,該模式的應用僅限於年銷售額超過 1000 萬美元的企業。
區域分析
預計到2025年,歐洲將以32.94%的市佔率佔據主導地位。這主要得益於德國和法國等國的「Fit-for-55」補貼計劃,涵蓋了LED維修所需資本投資的40%。在荷蘭,2024年1萬公頃的溫室棚耗電4.5太瓦時,因此LED節能40-50%的優勢在經濟上極具吸引力。在西班牙阿爾梅里亞,由於全年自然光照充足,塑膠溫室種植領域的LED技術應用進展緩慢,但一項結合LED和氣候控制的試點方案已在18個月內實現了投資回報。
亞太地區預計將成為成長最快的地區,年複合成長率達13.42%。在中國,LED照明正被推廣應用,以彌補120萬公頃保護性園藝種植面積的土地限制;新加坡則計劃從2024年起投資2億新元(約1.48億美元)發展垂直農業。日本的城市農場每年可獲得50億新元(約3,300萬美元)的補貼;而印度25%的關稅推高了成本,使其高於關稅稅率在0-5%之間的鄰近東協國家。澳洲對中國汽車零件徵收的反傾銷稅導致訂單轉向韓國供應商,這些供應商面臨12-18%的價格溢價。
到2025年,北美將佔據約30%的市場佔有率。同年,美國大麻種植照明市場規模達15億美元;在加拿大,為因應天然氣價格波動,2,800公頃的溫室正迅速升級為LED照明。在墨西哥,2024年至2025年間,1,800公頃的番茄溫室採用了間作照明技術,產量提高了18%至25%。沙烏地阿拉伯、阿拉伯聯合大公國和卡達已累計投資3.2億美元用於建造太陽能LED農場,以減少85%至90%的進口依賴。
其他好處
- Excel格式的市場預測(ME)表
- 3個月的分析師支持
目錄
第1章:引言
- 研究假設和市場定義
- 調查範圍
第2章:調查方法
第3章執行摘要
第4章 市場狀況
- 市場概覽
- 市場促進因素
- 透過精確調節 LED頻譜來提高北美大麻種植中的大麻素產量。
- 亞洲特大城市推行的都市區糧食安全計劃,加速了垂直農場照明的需求。
- 歐盟「適用於55歲族群」能源指令促進加熱玻璃溫室採用LED維修
- 海灣合作理事會(GCC)國家沙漠農業離網微型電力供應解決方案激增。
- 透過企業發行與環境、社會及公司治理 (ESG) 掛鉤的綠色債券,為大型園藝溫室引入 LED 照明提供資金。
- 利用雲端基礎頻譜最佳化受控環境設施中的光合作用光子利用效率。
- 市場限制因素
- 鋁和稀土元素成本的急劇上漲給高功率LED照明燈具的利潤率帶來了壓力。
- 由於亞太地區不同地區的進口關稅各不相同,因此該地區的燈俱生產商難以統一制定燈具價格。
- 由於與光生物安全相關的合規成本,頻譜改質產品在歐盟的上市有所延遲。
- DALI 和 KNX 之間互通性阻礙了智慧照明在老舊溫室中的應用。
- 產業價值鏈分析
- 監理情勢
- 技術展望
- 波特五力分析
第5章 市場規模與成長預測
- 透過照明技術
- LED
- HID
- 螢光
- 電漿及其他
- 透過提供
- 硬體(照明燈具、驅動器、控制設備)
- 軟體服務
- 按安裝類型
- 新安裝
- 維修和安裝
- 透過耕作
- 蔬菜和水果
- 綠葉蔬菜和微型菜苗
- 莓果
- 番茄和甜椒
- 開花植物和觀賞植物
- 大麻/特種作物
- 其他
- 透過使用
- 溫室
- 室內/垂直農場
- 研究和學術設施
- 水耕貨櫃農場
- 按地區
- 北美洲
- 美國
- 加拿大
- 墨西哥
- 南美洲
- 巴西
- 阿根廷
- 其他南美國家
- 歐洲
- 德國
- 英國
- 法國
- 義大利
- 西班牙
- 其他歐洲國家
- 亞太地區
- 中國
- 日本
- 韓國
- 印度
- 澳洲
- 紐西蘭
- 其他亞太國家
- 中東和非洲
- 中東
- 阿拉伯聯合大公國
- 沙烏地阿拉伯
- 土耳其
- 其他中東國家
- 非洲
- 南非
- 奈及利亞
- 肯亞
- 其他非洲地區
- 中東
- 北美洲
第6章 競爭情勢
- 市場集中度
- 策略趨勢
- 市佔率分析
- 公司簡介
- Signify Holding
- ams OSRAM AG
- Fluence Bioengineering(Scotts Miracle-Gro)
- Heliospectra AB
- Hortilux Schreder
- Gavita International BV
- Valoya Oy
- LumiGrow Inc.
- Samsung Electronics Co. Ltd.
- LG Innotek
- Cree LED(SMART Global)
- Current Lighting Solutions
- Everlight Electronics
- Hort Americas LLC
- B-Light Group
- California LightWorks
- Agrolux Nederland BV
- Illumitex Inc.
- Deere and Co.(Infinite Vertical)
- Nanolux Technology
第7章 市場機會與未來展望
According to Mordor Intelligence, the horticultural lighting market size is projected to expand from USD 9.80 billion in 2025 and USD 11.02 billion in 2026 to USD 19.62 billion by 2031, registering a 12.23% CAGR between 2026 and 2031.
This report is Segmented by Lighting Technology (LED, HID, Fluorescent, Plasma, and More), Offering (Hardware, Software and Services), Installation Type (New, and Retrofit), Cultivation (Vegetables and Fruits, Leafy Greens, Berries, Tomatoes and Peppers, Flowers, Cannabis, and More), Application (Greenhouses, and More), and Geography. Market Forecasts are Provided in Terms of Value (USD).
Global Horticulture Lighting Market Trends and Insights
Precision-Tuned LED Spectra Raising Cannabinoid Yield In North American Cannabis Grows
Cannabis growers are shifting from broad-spectrum metal-halide lamps to LED fixtures emitting 680-730 nm far-red wavelengths, boosting THC and CBD concentrations by 12-18 percent and cutting waste heat by 40-50 percent. The segment, valued at USD 1.5 billion in 2025, is growing at 15% annually as additional U.S. states legalize medical and adult-use sales. Fixture vendors Fluence and California LightWorks dominate large facilities, while modular systems from Black Dog LED are winning budget-sensitive craft operators. Federal rescheduling could accelerate multi-state expansion beyond 2028.
Urban Food-Security Programs Accelerating Vertical-Farm Lighting Demand Across Asian Megacities
Under its "30 by 30" plan, Singapore allocated SGD 200 million (USD 148 million) in 2024 to enhance its food security and reduce reliance on imports. Meanwhile, in 2025, Tokyo set aside JPY 5 billion (USD 33 million) to subsidize urban agriculture initiatives, aiming to promote sustainable farming practices within the city. Seoul's Smart Farm Innovation Center rolled out 12 hectares of fully enclosed farms, utilizing Samsung's LM301H LEDs, which boast an impressive efficacy of 3.1 µmol J-1. These advanced farming systems, equipped with lighting fixtures priced between USD 150-250 m2, achieve 10-15 harvests annually. This high productivity ensures a lighting payback period of under four years, making the investment in such technology economically viable and efficient.
Acute Aluminium And Rare-Earth Cost Inflation Squeezing High-Power LED Fixture Margins
In 2025, average aluminium prices climbed to USD 2,580 per tonne, marking a significant increase that led to a rise of USD 6-10 in fixture bills of materials per unit. This surge in costs resulted in a notable compression of manufacturers' gross margins, reducing them by as much as 12 percentage points. Furthermore, the implementation of stringent export quotas by China significantly impacted the market for rare earth elements. These restrictions drove prices of europium and terbium oxides up by 30 percent, thereby exerting additional pressure on suppliers of LED phosphors and further complicating their operational dynamics.
Other drivers and restraints analyzed in the detailed report include:
- EU Fit-for-55 Energy Directives Incentivising LED Retrofits In Heated Glass Greenhouses
- Surge In Off-Grid Micro-Powered CEA Solutions For Desert Farming In GCC Countries
- Fragmented Regional Import Tariffs Complicating Fixture Price Parity For Asia-Pacific Growers
For complete list of drivers and restraints, kindly check the Table Of Contents.
Segment Analysis
LED systems held 86.13% of horticultural lighting market share in 2025, reflecting sustained 40-50 percent energy savings versus HID lamps. The horticultural lighting market size for plasma and other alternatives is projected to advance at a 12.41% CAGR as research facilities value their continuous 380-780 nm spectra. LED fixture costs have declined to USD 80-150 m-2, and gallium-nitride-on-silicon roadmaps suggest further price drops by 2028.
LED innovation is shifting toward 10-channel tunable arrays, typified by Heliospectra's MITRA X platform released in 2024, which recreates sunrise-to-sunset transitions with 1 percent spectral granularity. Plasma systems priced at USD 800-1 200 per unit are penetrating high-margin cannabis and cut-flower operations despite higher capex. HID lamps, still clinging to 8-10 percent share in older greenhouses, are falling out of favor as bulb supply tightens under EU Ecodesign rules.
Hardware contributed 71.52% of 2025 revenue, yet falling LED package prices are shrinking average selling prices by 6-8 percent yearly. Software and services are expanding at 12.53% CAGR as platforms such as LumiGrow smartPAR Cloud charge USD 2-5 m-2 yr-1 for photon efficacy optimization. These SaaS fees already represent 12-18 percent of total project value in new vertical farms.
Driver electronics now embed Bluetooth LE and Zigbee radios, eliminating hard-wired DALI infrastructure and reducing installation labor USD 8-12 per linear meter. Energy-savings-as-a-service models pioneered by Deere Infinite Vertical keep fixtures off growers' balance sheets, although legal complexities around measurement and verification confine adoption to operators above USD 10 million annual revenue.
Complete Report Scope:
- By Lighting Technology
- LED
- HID
- Fluorescent
- Plasma and Others
- By Offering
- Hardware (Fixtures, Drivers, Controls)
- Software and Services
- By Installation Type
- New Installations
- Retrofit Installations
- By Cultivation
- Vegetables and Fruits
- Leafy Greens and Micro-Greens
- Berries
- Tomatoes and Peppers
- Flowers and Ornamentals
- Cannabis and Specialty Crops
- Other Crops
- By Application
- Greenhouses
- Indoor and Vertical Farms
- Research/Academic Facilities
- Aquaponics and Container Farms
- By Geography
- North America
- United States
- Canada
- Mexico
- South America
- Brazil
- Argentina
- Rest of South America
- Europe
- Germany
- United Kingdom
- France
- Italy
- Spain
- Rest of Europe
- Asia Pacific
- China
- Japan
- South Korea
- India
- Australia
- New Zealand
- Rest of Asia-Pacific
- Middle East and Africa
- Middle East
- United Arab Emirates
- Saudi Arabia
- Turkey
- Rest of Middle East
- Africa
- South Africa
- Nigeria
- Kenya
- Rest of Africa
- Middle East
- North America
Geography Analysis
Europe dominated with 32.94 percent share in 2025 as Fit-for-55 subsidies cover 40 percent of LED retrofit capex in countries such as Germany and France. Netherlands' 10 000 ha of heated glasshouses consumed 4.5 TWh in 2024, making energy savings of 40-50 percent through LEDs financially compelling. Spain's Almeria plastics sector is less aggressive because natural light suffices most of the year, but pilot LED-climate algorithms delivered 18-month paybacks.
Asia-Pacific will be the fastest-growing region at 13.42% CAGR. China's 1.2 million ha of protected horticulture is scaling LEDs to offset land limits, while Singapore pumped SGD 200 million (USD 148 million) into vertical farms since 2024. Japanese urban farms receive JPY 5 billion (USD 33 million) in annual subsidies, and India's 25 percent tariff raises costs versus ASEAN neighbors with 0-5 percent duties. Australia's anti-dumping tariffs on Chinese drivers divert orders to Korean suppliers at 12-18 percent mark-ups.
North America accounted for roughly 30 percent share in 2025. United States cannabis lighting reached USD 1.5 billion that year, and Canada's 2 800 ha of glasshouses are rapidly retrofitting LEDs under volatile natural-gas prices. Mexico's 1 800 ha of tomato greenhouses fitted interlighting in 2024-2025, gaining 18-25 percent yield bumps. Saudi Arabia, UAE, and Qatar together invested USD 320 million in solar-powered LED farms to cut 85-90 percent import dependence.
- Signify Holding
- ams OSRAM AG
- Fluence Bioengineering (Scotts Miracle-Gro)
- Heliospectra AB
- Hortilux Schreder
- Gavita International BV
- Valoya Oy
- LumiGrow Inc.
- Samsung Electronics Co. Ltd.
- LG Innotek
- Cree LED (SMART Global)
- Current Lighting Solutions
- Everlight Electronics
- Hort Americas LLC
- B-Light Group
- California LightWorks
- Agrolux Nederland BV
- Illumitex Inc.
- Deere and Co. (Infinite Vertical)
- Nanolux Technology
Additional Benefits:
- The market estimate (ME) sheet in Excel format
- 3 months of analyst support
TABLE OF CONTENTS
1 INTRODUCTION
- 1.1 Study Assumptions and Market Definition
- 1.2 Scope of the Study
2 RESEARCH METHODOLOGY
3 EXECUTIVE SUMMARY
4 MARKET LANDSCAPE
- 4.1 Market Overview
- 4.2 Market Drivers
- 4.2.1 Precision-tuned LED Spectra Raising Cannabinoid Yield in North American Cannabis Grows
- 4.2.2 Urban Food-Security Programs Accelerating Vertical-Farm Lighting Demand Across Asian Megacities
- 4.2.3 EU "Fit-for-55" Energy Directives Incentivising LED Retrofits in Heated Glass Greenhouses
- 4.2.4 Surge in Off-Grid Micro-Powered CEA Solutions for Desert Farming in Gulf Cooperation Council Countries
- 4.2.5 Corporate ESG-Linked Green Bonds Funding Large-Scale Horticultural Greenhouse LED Roll-Outs
- 4.2.6 Cloud-Based Spectral Analytics Optimising Photosynthetic Photon Efficacy in Controlled-Environment Facilities
- 4.3 Market Restraints
- 4.3.1 Acute Aluminium and Rare-Earth Cost Inflation Squeezing High-Power LED Fixture Margins
- 4.3.2 Fragmented Regional Import Tariffs Complicating Fixture Price Parity for Asia-Pacific Growers
- 4.3.3 Photobiological Safety Compliance Costs Delaying Spectrum-Tuning Product Launches in EU
- 4.3.4 Limited DALI/KNX Interoperability Curbing Smart-Lighting Adoption in Legacy Greenhouses
- 4.4 Industry Value-Chain Analysis
- 4.5 Regulatory Landscape
- 4.6 Technological Outlook
- 4.7 Porter's Five Forces Analysis
- 4.7.1 Bargaining Power of Buyers
- 4.7.2 Bargaining Power of Suppliers
- 4.7.3 Threat of New Entrants
- 4.7.4 Threat of Substitutes
- 4.7.5 Competitive Rivalry
5 MARKET SIZE AND GROWTH FORECASTS (VALUE)
- 5.1 By Lighting Technology
- 5.1.1 LED
- 5.1.2 HID
- 5.1.3 Fluorescent
- 5.1.4 Plasma and Others
- 5.2 By Offering
- 5.2.1 Hardware (Fixtures, Drivers, Controls)
- 5.2.2 Software and Services
- 5.3 By Installation Type
- 5.3.1 New Installations
- 5.3.2 Retrofit Installations
- 5.4 By Cultivation
- 5.4.1 Vegetables and Fruits
- 5.4.2 Leafy Greens and Micro-Greens
- 5.4.3 Berries
- 5.4.4 Tomatoes and Peppers
- 5.4.5 Flowers and Ornamentals
- 5.4.6 Cannabis and Specialty Crops
- 5.4.7 Other Crops
- 5.5 By Application
- 5.5.1 Greenhouses
- 5.5.2 Indoor and Vertical Farms
- 5.5.3 Research/Academic Facilities
- 5.5.4 Aquaponics and Container Farms
- 5.6 By Geography
- 5.6.1 North America
- 5.6.1.1 United States
- 5.6.1.2 Canada
- 5.6.1.3 Mexico
- 5.6.2 South America
- 5.6.2.1 Brazil
- 5.6.2.2 Argentina
- 5.6.2.3 Rest of South America
- 5.6.3 Europe
- 5.6.3.1 Germany
- 5.6.3.2 United Kingdom
- 5.6.3.3 France
- 5.6.3.4 Italy
- 5.6.3.5 Spain
- 5.6.3.6 Rest of Europe
- 5.6.4 Asia Pacific
- 5.6.4.1 China
- 5.6.4.2 Japan
- 5.6.4.3 South Korea
- 5.6.4.4 India
- 5.6.4.5 Australia
- 5.6.4.6 New Zealand
- 5.6.4.7 Rest of Asia-Pacific
- 5.6.5 Middle East and Africa
- 5.6.5.1 Middle East
- 5.6.5.1.1 United Arab Emirates
- 5.6.5.1.2 Saudi Arabia
- 5.6.5.1.3 Turkey
- 5.6.5.1.4 Rest of Middle East
- 5.6.5.2 Africa
- 5.6.5.2.1 South Africa
- 5.6.5.2.2 Nigeria
- 5.6.5.2.3 Kenya
- 5.6.5.2.4 Rest of Africa
- 5.6.5.1 Middle East
- 5.6.1 North America
6 COMPETITIVE LANDSCAPE
- 6.1 Market Concentration
- 6.2 Strategic Moves
- 6.3 Market Share Analysis
- 6.4 Company Profiles (includes Global Level Overview, Market Level Overview, Core Segments, Financials as available, Strategic Information, Market Rank/Share, Products and Services, Recent Developments)
- 6.4.1 Signify Holding
- 6.4.2 ams OSRAM AG
- 6.4.3 Fluence Bioengineering (Scotts Miracle-Gro)
- 6.4.4 Heliospectra AB
- 6.4.5 Hortilux Schreder
- 6.4.6 Gavita International BV
- 6.4.7 Valoya Oy
- 6.4.8 LumiGrow Inc.
- 6.4.9 Samsung Electronics Co. Ltd.
- 6.4.10 LG Innotek
- 6.4.11 Cree LED (SMART Global)
- 6.4.12 Current Lighting Solutions
- 6.4.13 Everlight Electronics
- 6.4.14 Hort Americas LLC
- 6.4.15 B-Light Group
- 6.4.16 California LightWorks
- 6.4.17 Agrolux Nederland BV
- 6.4.18 Illumitex Inc.
- 6.4.19 Deere and Co. (Infinite Vertical)
- 6.4.20 Nanolux Technology
7 MARKET OPPORTUNITIES AND FUTURE OUTLOOK
- 7.1 White-Space and Unmet-Need Assessment

 園藝照明市場-2026-2032年全球市場預測
 UVC LED:市場佔有率分析、行業趨勢和統計數據、成長預測(2026-2031)
 園藝LED照明市場:按應用、技術、最終用戶和地區分類
 2025-2029年全球園藝照明市場UVC LED消毒模組市場:按模組配置、分銷管道、應用和最終用戶分類 - 全球預測(2026-2032)園藝照明感測器市場:按感測器類型、技術、應用、最終用途和分銷管道分類-2026-2032年全球預測
 園藝照明市場規模、佔有率和成長分析(按安裝類型、照明類型、產品、種植類型、技術、應用和地區分類)-2026-2033年產業預測
 園藝照明市場規模、佔有率和趨勢分析報告,按產品、技術、照明類型、安裝類型、最終用途、地區和細分趨勢分類:2025 年至 2033 年
 UVC LED 市場規模:依技術、應用、地區分類,2026-2032 年水產養殖和園藝照明,全球市場 2024-2030