


 |
市場調查報告書
商品編碼
2114304
AIOps:市場佔有率分析、產業趨勢與統計、成長預測(2026-2031)AIOps - Market Share Analysis, Industry Trends & Statistics, Growth Forecasts (2026 - 2031) |
||||||

※ 本網頁內容可能與最新版本有所差異。詳細情況請與我們聯繫。
根據 Mordor Intelligence 預測,AIOps 市場規模預計將在 2026 年達到 189.5 億美元,到 2031 年達到 377.9 億美元,複合年成長率為 14.8%。
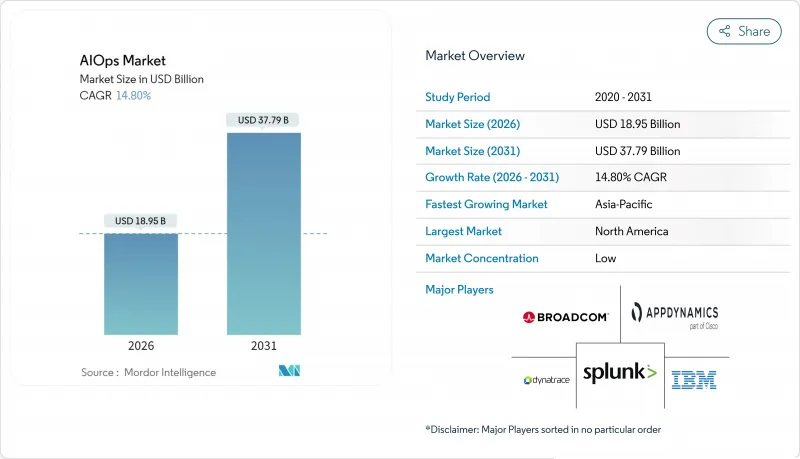
本報告按元件(平台和服務)、部署模式(本地部署和雲端部署)、企業規模(中小企業和大型企業)、最終用戶產業(IT和電信、銀行、金融服務和保險等)以及地區進行細分。市場預測以美元計價。
全球AIOps市場趨勢與洞察
對人工智慧驅動的可觀測性的需求正在迅速成長。
由於微服務產生的遙測資料量是單體架構的十倍,人工智慧監控的採用率在2024年至2025年間從42%上升至54%。傳統的基於規則的告警機制已不足以應對,導致告警氾濫,並使值班團隊逐漸失去耐心。如今,基於機器學習的基準能夠過濾基礎設施噪音,識別影響使用者的事件,從而縮短故障排查時間。 Datadog 於2025年推出的LLM可觀測性功能,能夠追蹤生成人工智慧工作負載時的令牌消耗和延遲——這往往是大型語言模型整合到面向客戶的應用程式中時容易被忽視的盲點。金融業的領導者正在將監控預算翻倍,因為一小時的停機時間可能造成高達200萬美元的交易損失和合規罰款。如此巨大的損失解釋了AIOps市場為何持續加速發展。
向混合雲和多重雲端架構遷移
隨著企業供應商多元化並遵守資料居住要求,混合雲和多重雲端工作負載預計將從 2023 年的 76% 成長到 2025 年的 87%。每個超大規模資料中心業者都採用不同的遙測模型,例如 AWS CloudWatch、Azure Monitor 和 Google Cloud Operations,這迫使團隊在進行關聯分析之前對資料進行規範化處理。雖然 OpenTelemetry 在雲端原生專案中的採用率已達到 64%,但舊有系統仍然輸出 syslog 和 SNMP 數據,需要基於閘道器的轉換。思科收購並整合 AppDynamics 和 Splunk 後,形成了一個統一的管理介面,可對本機和雲端環境進行統一的可見性監控。歐盟和印度的主權雲法規要求 AIOps 實例進行區域鎖定,這導致監控結構分散,同時也增加了對聯合分析的需求。
工具的激增和投資報酬率的不確定性
許多公司仍同時使用多種監控工具,導致遙測資料分散,授權成本居高不下。儘管2025年整合工作力度活性化,但整合的複雜性可能會使投資回報期延遲超過18個月。只有少數組織在實施的第一年就實現了三位數的投資回報率,而四分之一的組織由於功能利用率不足而報告了負回報。應用程式、日誌和網路監控功能的重複會導致冗餘警報,使負責人不堪負荷。中小企業面臨的挑戰更為嚴峻,因為許多AIOps平台都假定擁有7x24小時的站點可靠性團隊,而他們往往缺乏這樣的團隊。託管服務供應商可以幫助彌補這一差距,但通常會帶來額外的利潤,從而稀釋投資報酬率。
細分市場分析
2025年,平台訂閱佔總支出的67.42%,成為當年AIOps市場最大的佔有率。然而,隨著企業越來越依賴外部專家來整合異質資料、統一基準以及自動化修復,預計到2031年,服務領域的複合年成長率將達到16.04%。這種向服務的轉變凸顯了在黑盒子演算法能夠創造價值之前,需要進行情境調整。
專業服務公司正在客戶團隊內部部署站點可靠性工程師,以加速部署進程;而託管服務供應商根據預付費協議提供「全天候」事件回應服務。供應商認證計畫不僅是額外的收入來源,也是拓展人才庫的有效途徑。平台開發正轉向生成式人工智慧介面和邊緣推理,DPU 和 FPGA 能夠在工業IoT環境中實現亞毫秒異常檢測。環境、社會和管治(ESG) 指標也被整合到儀錶板中,並排顯示營運和永續性的優先事項。
到 2025 年,本地部署將佔已部署環境的 56.66%,因為銀行、醫院和政府機構都在其自身的資料中心內保護敏感的遙測資料。預計到 2031 年,雲端採用率將以 15.66% 的複合年成長率成長,因為超大規模資料中心業者將原生 AIOps 整合到雲端環境中,並提供符合資料居住法規的獨立區域。這種分階段的轉型值得關注,因為雲端訂閱無需資本支出,並且可以隨著工作負載的成長而彈性擴展,從而使成本與使用量相符。
混合架構正逐漸成為一種可行的折衷方案,它允許敏感日誌保留在本地,而監管較少的資料則串流到雲端進行分析。像Datadog和New Relic這樣的雲端原生供應商在數位化優先型公司中佔據主導地位,Datadog預計到2025年其年度經常性收入將超過20億美元。歐盟GDPR下的罰款以及新型主權雲的出現表明,法律規範直接影響企業的採用選擇。在五年內,由於補丁、擴展和硬體更新周期等因素,本地託管堆疊的營運成本通常遠高於訂閱服務。
區域分析
北美地區憑藉著成熟的IT營運能力和早期採用生成式人工智慧輔助駕駛技術,預計到2025年將佔全球收入的42.54%。美國金融機構每小時服務中斷成本中位數已達200萬美元,凸顯了投資的迫切性。該地區的供應商整合最為顯著,大型企業正在將全端套件標準化,以滿足審計和容錯要求。
預計到2031年,亞太地區將以16.22%的複合年成長率實現最高成長,這主要得益於公共部門數位化專案和資料在地化法律迫使跨國公司採用區域特定的可觀測性架構。印度的「數位印度」舉措、中國的「十四五」規劃以及日本的「社會5.0」概念都在雲端基礎設施和物聯網領域投入數十億美元,由此產生的新型遙測數據需要進行自動化關聯分析。阿里雲和騰訊雲等區域供應商正在將AIOps整合到其服務中,以減少對西方軟體的依賴。
歐洲仍然是重要的貢獻者,但由於嚴格的隱私和人工智慧管治結構,其成長速度較為緩慢。歐盟人工智慧法將應用於關鍵基礎設施的AIOps歸類為“高風險”,強制要求透明度和人工監督。此外,GDPR的實施意味著,如果遙測資料未經許可跨境傳輸,仍將面臨巨額罰款。拉丁美洲、中東和非洲正處於人工智慧應用的早期階段,透過政府現代化和網路擴展計畫不斷推進,為未來的廣泛應用奠定基礎。
其他好處:
- Excel格式的市場預測(ME)表
- 3個月的分析師支持
目錄
第1章:引言
- 研究假設和市場定義
- 調查範圍
第2章:調查方法
第3章執行摘要
第4章 市場狀況
- 市場概覽
- 市場促進因素
- 對人工智慧主導的可觀測性的需求激增
- 向混合雲和多重雲端架構遷移
- 需要縮短平均修復時間並實施SRE
- 用於業務自動化的 Gen-AI 副駕駛
- 利用FPGA和DPU實現邊緣加速
- 與ESG相關的「綠色營運」合規性的興起
- 市場限制因素
- 工具的激增和投資報酬率的不確定性
- AIOps領域專業人才短缺
- 資料主權與人工智慧管治的障礙
- 供應商黑盒演算法與鎖定風險
- 產業價值鏈分析
- 監理情勢
- 技術展望
- 波特五力分析
- 宏觀經濟因素對市場的影響
第5章 市場規模與成長預測
- 按組件
- 平台
- 服務
- 部署模式
- 現場
- 雲
- 按組織規模
- 小型企業
- 大公司
- 按最終用戶行業分類
- IT/通訊
- BFSI
- 衛生保健
- 零售與電子商務
- 媒體與娛樂
- 製造業
- 政府/公共部門
- 其他終端用戶產業
- 按地區
- 北美洲
- 美國
- 加拿大
- 墨西哥
- 南美洲
- 巴西
- 阿根廷
- 其他南美國家
- 歐洲
- 德國
- 英國
- 法國
- 其他歐洲國家
- 亞太地區
- 中國
- 印度
- 日本
- 韓國
- 其他亞太國家
- 中東
- 沙烏地阿拉伯
- 阿拉伯聯合大公國
- 其他中東國家
- 非洲
- 南非
- 奈及利亞
- 其他非洲國家
- 北美洲
第6章 競爭情勢
- 市場集中度
- 策略趨勢
- 市佔率分析
- 公司簡介
- IBM Corporation
- Cisco Systems, Inc.(AppDynamics, LLC)
- Splunk LLC
- Dynatrace, Inc.
- Broadcom Inc.(including VMware, INC.:CA, Inc.)
- BMC Software, Inc.
- BigPanda, Inc.
- Moogsoft, Inc.
- Elastic NV
- New Relic, Inc.
- Datadog, Inc.
- PagerDuty, inc.
- ServiceNow, Inc.(Loom Systems, Inc.)
- ExtraHop Networks, Inc.
- StackState BV
- OpsRamp, Inc.(a Hewlett Packard Enterprise company)
- Juniper Networks, Inc.(Mist Systems, Inc.)
- Microsoft Azure Monitor(Microsoft Corporation)
- Amazon DevOps Guru(Amazon Web Services, Inc.)
- Google Cloud AIOps(Operations Suite, Google LLC)
- SolarWinds Worldwide, LLC
- ScienceLogic, Inc.
- LogicMonitor, Inc.
第7章 市場機會與未來展望
According to Mordor Intelligence, the AIOps market size stands at USD 18.95 billion in 2026 and is projected to reach USD 37.79 billion by 2031, reflecting a 14.8% CAGR.
This report is Segmented by Component (Platform, and Services), Deployment Mode (On-Premises, and Cloud), Organization Size (Small and Medium Enterprises, and Large Enterprises), End-User Industry (IT and Telecom, BFSI, and More), and by Geography. The Market Forecasts are Provided in Terms of Value (USD).
Global AIOps Market Trends and Insights
AI-Driven Observability Demand Surge
Enterprises moved from 42% to 54% adoption of AI-powered monitoring between 2024 and 2025 as microservices generated tenfold more telemetry than monolithic stacks. Traditional rule-based alerts could not cope, producing storms that desensitized on-call teams. Machine-learning baselines now filter infrastructure noise and surface user-impacting incidents, shrinking triage queues. Datadog's LLM Observability, introduced in 2025, tracks token consumption and latency in generative AI workloads, a blind spot as customer-facing applications embed large language models. Finance leaders have doubled monitoring budgets because a single hour of downtime costs USD 2 million in lost transactions and compliance penalties. The magnitude of these losses explains why the AIOps market continues to accelerate.
Shift to Hybrid and Multi-Cloud Architectures
Hybrid and multi-cloud workloads climbed to 87% in 2025, up from 76% in 2023, as firms diversify suppliers and comply with data-residency rules. Every hyperscaler exposes a different telemetry model - AWS CloudWatch, Azure Monitor and Google Cloud Operations - forcing teams to normalize data before correlation. OpenTelemetry adoption reached 64% of cloud-native projects, but legacy systems still emit syslog and SNMP, prompting gateway translation. Cisco's post-acquisition fusion of AppDynamics and Splunk created a single pane for on-premise and cloud visibility. Sovereign-cloud regulations in the European Union and India require region-locked AIOps instances, fragmenting oversight while driving demand for federated analytics.
Tool Sprawl and ROI Uncertainty
Most enterprises still juggle multiple monitoring tools, fragmenting telemetry and inflating licensing overhead. Consolidation efforts intensified in 2025, yet integration complexity can postpone payback beyond eighteen months. Only a small subset of organizations achieved triple-digit return on investment inside the first year, while a quarter reported negative returns due to underused features. Overlaps among application, log and network monitoring create redundant alerts that drown operators in noise. Small and medium enterprises face sharper friction because many AIOps platforms assume 24/7 site reliability teams that these firms do not staff. Managed service providers help close gaps but often add margin, diluting ROI.
Other drivers and restraints analyzed in the detailed report include:
- Need for Faster MTTR and SRE Adoption
- Gen-AI Copilots for Ops Automation
- Shortage of AIOps-Savvy Talent
For complete list of drivers and restraints, kindly check the Table Of Contents.
Segment Analysis
Platform subscriptions captured 67.42% of 2025 spending, the largest slice of the AIOps market share for that year. The services segment, however, is projected to grow at a 16.04% CAGR to 2031 as organizations rely on external expertise to connect heterogeneous data feeds, tune baselines and automate remediation. This drift toward services underscores how black-box algorithms need context-specific calibration before they deliver value.
Professional services firms are embedding site reliability engineers inside client teams to accelerate adoption, while managed service providers offer follow-the-sun incident response priced on retainer. Vendor certification programs have become a parallel revenue stream and a way to expand the talent pool. Platform development is turning toward generative AI interfaces and edge inference, with DPUs and FPGAs driving sub-millisecond anomaly detection in industrial IoT environments. Environmental, social and governance metrics are also being woven into dashboards so that operational and sustainability priorities appear side by side.
On-premise implementations represented 56.66% of installed environments in 2025 as banks, hospitals and government agencies guarded sensitive telemetry within their own data centers. Cloud deployments are forecast to expand at a 15.66% CAGR through 2031 as hyperscalers embed native AIOps and offer sovereign regions that satisfy residency laws. The gradual shift is notable because cloud subscriptions eliminate capital outlays and scale elastically with workload growth, aligning cost with usage.
Hybrid architectures are emerging as a pragmatic compromise, retaining sensitive logs on-premise while allowing less-restricted data to flow into cloud-based analytics. Cloud-native vendors such as Datadog and New Relic enjoy outsized share among digital-first companies; Datadog's annual recurring revenue surpassed USD 2 billion in 2025. The European Union's GDPR fines and new sovereign clouds demonstrate how regulatory frameworks directly influence deployment choices. Over a five-year horizon, operating self-hosted stacks often costs considerably more than subscription services due to patching, scaling and hardware refresh cycles.
Complete Report Scope:
- By Component
- Platform
- Services
- By Deployment Mode
- On-Premise
- Cloud
- By Organization Size
- Small and Medium Enterprises
- Large Enterprises
- By End-User Industry
- IT and Telecom
- BFSI
- Healthcare
- Retail and E-Commerce
- Media and Entertainment
- Manufacturing
- Government and Public Sector
- Other End-User Industries
- By Geography
- North America
- United States
- Canada
- Mexico
- South America
- Brazil
- Argentina
- Rest of South America
- Europe
- Germany
- United Kingdom
- France
- Rest of Europe
- Asia Pacific
- China
- India
- Japan
- South Korea
- Rest of Asia Pacific
- Middle East
- Saudi Arabia
- United Arab Emirates
- Rest of Middle East
- Africa
- South Africa
- Nigeria
- Rest of Africa
- North America
Geography Analysis
North America commanded 42.54% of 2025 revenue, driven by mature IT operations capabilities and early-stage adoption of generative AI copilots. Financial institutions in the United States experience median outage costs of USD 2 million per hour, a figure that reinforces investment urgency. Vendor consolidation is most visible here, where large enterprises are standardizing on full-stack suites to satisfy audit and resilience mandates.
Asia Pacific is forecast to register the fastest 16.22% CAGR to 2031 as public-sector digitization programs and data-localization laws compel multinational firms to deploy region-specific observability stacks. India's Digital India initiative, China's 14th Five-Year Plan and Japan's Society 5.0 blueprint collectively pour billions into cloud infrastructure and IoT, generating new telemetry that requires automated correlation. Regional vendors such as Alibaba Cloud and Tencent Cloud embed AIOps in their services to cut reliance on Western software.
Europe remains a significant contributor, though growth is moderated by stringent privacy and AI governance regimes. The EU AI Act classifies AIOps applied to critical infrastructure as high risk, obliging transparency and human oversight. GDPR enforcement continues to impose hefty penalties when telemetry traverses borders without consent. Latin America, the Middle East and Africa are earlier in their adoption curve but are progressing through government modernization and telecom expansion projects that plant seeds for future uptake.
- IBM Corporation
- Cisco Systems, Inc. (AppDynamics, LLC)
- Splunk LLC
- Dynatrace, Inc.
- Broadcom Inc. (including VMware, INC.: CA, Inc.)
- BMC Software, Inc.
- BigPanda, Inc.
- Moogsoft, Inc.
- Elastic N.V.
- New Relic, Inc.
- Datadog, Inc.
- PagerDuty, inc.
- ServiceNow, Inc. (Loom Systems, Inc.)
- ExtraHop Networks, Inc.
- StackState B.V.
- OpsRamp, Inc. (a Hewlett Packard Enterprise company)
- Juniper Networks, Inc. (Mist Systems, Inc.)
- Microsoft Azure Monitor (Microsoft Corporation)
- Amazon DevOps Guru (Amazon Web Services, Inc.)
- Google Cloud AIOps (Operations Suite, Google LLC)
- SolarWinds Worldwide, LLC
- ScienceLogic, Inc.
- LogicMonitor, Inc.
Additional Benefits:
- The market estimate (ME) sheet in Excel format
- 3 months of analyst support
TABLE OF CONTENTS
1 INTRODUCTION
- 1.1 Study Assumptions and Market Definition
- 1.2 Scope of the Study
2 RESEARCH METHODOLOGY
3 EXECUTIVE SUMMARY
4 MARKET LANDSCAPE
- 4.1 Market Overview
- 4.2 Market Drivers
- 4.2.1 AI-Driven Observability Demand Surge
- 4.2.2 Shift to Hybrid and Multi-Cloud Architectures
- 4.2.3 Need for Faster MTTR and SRE Adoption
- 4.2.4 Gen-AI Copilots for Ops Automation
- 4.2.5 FPGA and DPU Acceleration at the Edge
- 4.2.6 Rise of ESG-Linked "Green Ops" Compliance
- 4.3 Market Restraints
- 4.3.1 Tool Sprawl and ROI Uncertainty
- 4.3.2 Shortage of AIOps-Savvy Talent
- 4.3.3 Data-Sovereignty and AI-Governance Hurdles
- 4.3.4 Vendor Black-Box Algorithms and Lock-In Risk
- 4.4 Industry Value Chain Analysis
- 4.5 Regulatory Landscape
- 4.6 Technological Outlook
- 4.7 Porter's Five Forces Analysis
- 4.7.1 Bargaining Power of Suppliers
- 4.7.2 Bargaining Power of Buyers
- 4.7.3 Threat of New Entrants
- 4.7.4 Threat of Substitutes
- 4.7.5 Competitive Rivalry
- 4.8 Impact of Macroeconomic Factors on the Market
5 MARKET SIZE AND GROWTH FORECASTS (VALUE)
- 5.1 By Component
- 5.1.1 Platform
- 5.1.2 Services
- 5.2 By Deployment Mode
- 5.2.1 On-Premise
- 5.2.2 Cloud
- 5.3 By Organization Size
- 5.3.1 Small and Medium Enterprises
- 5.3.2 Large Enterprises
- 5.4 By End-User Industry
- 5.4.1 IT and Telecom
- 5.4.2 BFSI
- 5.4.3 Healthcare
- 5.4.4 Retail and E-Commerce
- 5.4.5 Media and Entertainment
- 5.4.6 Manufacturing
- 5.4.7 Government and Public Sector
- 5.4.8 Other End-User Industries
- 5.5 By Geography
- 5.5.1 North America
- 5.5.1.1 United States
- 5.5.1.2 Canada
- 5.5.1.3 Mexico
- 5.5.2 South America
- 5.5.2.1 Brazil
- 5.5.2.2 Argentina
- 5.5.2.3 Rest of South America
- 5.5.3 Europe
- 5.5.3.1 Germany
- 5.5.3.2 United Kingdom
- 5.5.3.3 France
- 5.5.3.4 Rest of Europe
- 5.5.4 Asia Pacific
- 5.5.4.1 China
- 5.5.4.2 India
- 5.5.4.3 Japan
- 5.5.4.4 South Korea
- 5.5.4.5 Rest of Asia Pacific
- 5.5.5 Middle East
- 5.5.5.1 Saudi Arabia
- 5.5.5.2 United Arab Emirates
- 5.5.5.3 Rest of Middle East
- 5.5.6 Africa
- 5.5.6.1 South Africa
- 5.5.6.2 Nigeria
- 5.5.6.3 Rest of Africa
- 5.5.1 North America
6 COMPETITIVE LANDSCAPE
- 6.1 Market Concentration
- 6.2 Strategic Moves
- 6.3 Market Share Analysis
- 6.4 Company Profiles (includes Global-level Overview, Market-level Overview, Core Segments, Financials as Available, Strategic Information, Market Rank/Share for Key Companies, Products & Services, and Recent Developments)
- 6.4.1 IBM Corporation
- 6.4.2 Cisco Systems, Inc. (AppDynamics, LLC)
- 6.4.3 Splunk LLC
- 6.4.4 Dynatrace, Inc.
- 6.4.5 Broadcom Inc. (including VMware, INC.: CA, Inc.)
- 6.4.6 BMC Software, Inc.
- 6.4.7 BigPanda, Inc.
- 6.4.8 Moogsoft, Inc.
- 6.4.9 Elastic N.V.
- 6.4.10 New Relic, Inc.
- 6.4.11 Datadog, Inc.
- 6.4.12 PagerDuty, inc.
- 6.4.13 ServiceNow, Inc. (Loom Systems, Inc.)
- 6.4.14 ExtraHop Networks, Inc.
- 6.4.15 StackState B.V.
- 6.4.16 OpsRamp, Inc. (a Hewlett Packard Enterprise company)
- 6.4.17 Juniper Networks, Inc. (Mist Systems, Inc.)
- 6.4.18 Microsoft Azure Monitor (Microsoft Corporation)
- 6.4.19 Amazon DevOps Guru (Amazon Web Services, Inc.)
- 6.4.20 Google Cloud AIOps (Operations Suite, Google LLC)
- 6.4.21 SolarWinds Worldwide, LLC
- 6.4.22 ScienceLogic, Inc.
- 6.4.23 LogicMonitor, Inc.
7 MARKET OPPORTUNITIES AND FUTURE OUTLOOK
- 7.1 White-Space and Unmet-Need Assessment

 IT維運人工智慧市場:按組件、技術、資料來源、部署類型、企業規模和最終用戶分類-2026-2032年全球市場預測
 AI維運平台市場預測至2034年-按組件、部署模式、組織規模、應用、產業、最終用戶和地區分類的全球分析面向通訊領域的AI運維(AIOps)市場預測至2034年-按組件、部署模式、功能、組織規模、應用、最終用戶和地區分類的全球分析
 自主IT維運:市場佔有率分析、產業趨勢與統計、成長預測(2026-2031年)AIOps平台市場預測至2034年-按交付類型、部署類型、組織規模、應用、最終用戶和地區分類的全球分析
 AIOps平台市場:按組件、組織規模、產業和地區分類
 2026年全球演算法IT運維(AIOps)市場報告AIOps平台市場:按組件、組織規模、應用、產業和部署類型分類 - 2026-2032年全球預測2026年全球人工智慧在IT運維平台市場報告2026年通訊業資訊科技營運人工智慧(AIOps)全球市場報告