


 |
市場調查報告書
商品編碼
2114171
人工智慧在農業領域的應用:市場佔有率分析、行業趨勢與統計數據以及成長預測(2026-2031 年)AI In Agriculture - Market Share Analysis, Industry Trends & Statistics, Growth Forecasts (2026 - 2031) |
||||||

※ 本網頁內容可能與最新版本有所差異。詳細情況請與我們聯繫。
根據 Mordor Intelligence 預測,農業人工智慧市場規模將從 2025 年的 24.3 億美元成長到 2026 年的 31.1 億美元,然後在 2031 年達到 83.9 億美元,2026 年至 2031 年的複合年成長率為 21.96%。
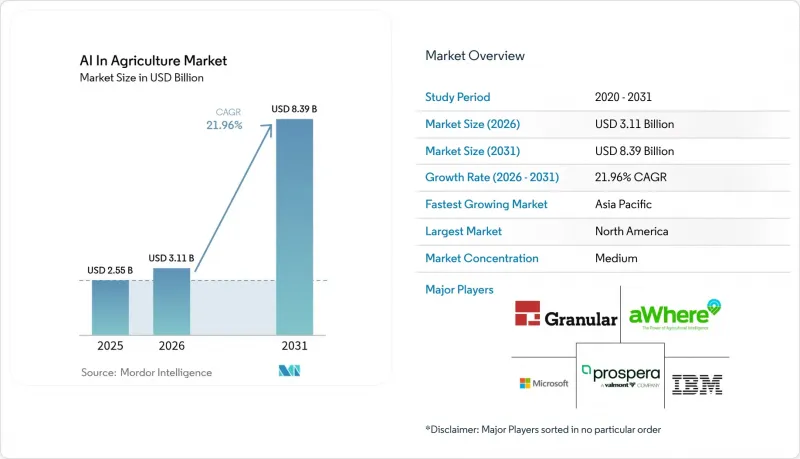
本報告按應用領域(精密農業、畜牧監測、無人機分析、智慧溫室管理、供應鏈和採後流程最佳化)、技術(機器學習、電腦視覺等)、組件(硬體、軟體平台、服務)、部署模式(雲端、混合)和地區進行細分。市場預測以美元(USD)為單位。
全球農業人工智慧市場趨勢與洞察
精密農業平台的快速普及
2025年,迪爾公司將機器學習演算法整合到其營運中心。這使得該平台能夠導入多年產量圖和土壤電導率測量數據,並自動產生種植處方箋,為早期採用者節省了8-12%的種子支出。 2026年初,天寶公司緊隨其後,在其農業軟體套件中添加了基於人工智慧的生成式報告工具。這使得農場管理者無需手動建立儀錶板即可向資助方解釋數據。由於Verra VM0042等協議要求在發放碳權之前量化地塊層面的碳固存量,碳計量模組現在已成為標準附加元件。隨著種植者交易檢驗的碳權額,他們將收入再投資於購買新的感測器,從而進一步提升了資料網路的效率。因此,形成了一個良性循環:平台的使用逐季加深,使得轉換到其他公司的成本效益越來越高。
擴展高解析度無人機和衛星影像服務
PrecisionHawk公司已啟動其2025年服務計劃,該計劃將無人機影像與Sentinel-1合成孔徑雷達數據融合,提供全天候土壤濕度和生物量地圖。 Aerobotics公司將於2026年推出電腦視覺模型,實現柑橘類水果的單果計數,使包裝商能夠比以往提前六週簽訂期貨合約。 Planet Labs公司的SuperDove衛星星座目前以3米解析度每日對所有農田進行重新觀測,為農藝師提供近乎即時的雙季種植系統回饋。這種更高的時間密度縮短了決策週期,並最大限度地減少了因時間誤差造成的產量損失。
農業數據標準分散
截至2025年,僅有30%的農業管理軟體供應商採用了AgGateway的ADAPT資料交換框架,迫使生產者在更換供應商時必須適應不相容的文件格式。土壤分類系統也存在差異,美國農業部(USDA)僅認可12種土壤序列,而世界參考基礎土壤(WRB)則認可32種,阻礙了模型的可移植性。氣象站規範和病蟲害命名法也各不相同,降低了國際資料集整合時的預測精度。供應商不得不建立和維護區域模型,導致開發成本增加,功能發布延遲。
細分市場分析
到2025年,精密農業將佔據農業人工智慧市場佔有率的43.29%,這反映了玉米和大豆種植面積變數施肥技術的廣泛應用。然而,預計到2031年,智慧溫室管理將以22.47%的年成長率成長,進而推動人工智慧應用領域的發展。智慧成長解決方案公司(Intelligent Growth Solutions)的人工智慧副駕駛系統(Generating AI Copilot)每隔幾分鐘即可微調二氧化碳濃度和LED頻譜,使垂直農場能夠在不影響產量的情況下降低18%的能源消耗。牲畜監測正迅速普及,因為電腦視覺系統可以提前數天檢測出跛行和產犢風險,從而降低獸醫成本和死亡率。無人機分析目前佔據15%左右的市場佔有率,但如果監管機構允許超視距飛行,其市場佔有率可能會進一步成長。
高密度溫室資料集每五分鐘記錄數十個變數的感測器測量數據,加速了模型迭代;而露天作物的數據則較為稀疏,減緩了演算法的改進速度。諸如GlobalGAP之類的認證開始要求採用人工智慧驅動的可追溯性,這促使收穫後最佳化平台被納入主流預算。因此,預計到2031年,受控環境下的農業人工智慧市場規模將與主流作物市場規模縮小部分差距。
到2025年,機器學習將佔農業人工智慧支出的48.19%,進而推動整個農業人工智慧市場的發展。儘管電腦視覺目前規模仍較小,但預計在2026年至2031年間,其年均成長率將達到22.68%,超過其他技術,這主要得益於無人機機隊的普及和邊緣處理器的廣泛應用。約翰迪爾公司的「See and Spray」系統利用卷積類神經網路以每秒20幀的速度識別作物和雜草,從而減少高達90%的除草劑用量。 Taranis公司透過拍攝亞毫米級解析度的影像,及早發現真菌病害並實現精準施藥,降低30-40%的農藥成本。
NVIDIA Jetson Orin 和 Google Coral 等邊緣推理晶片的售價現已低於 200 美元,可實現噴霧器上的即時處理,且無需雲端延遲。一項擬議的歐洲人工智慧法案將把部分農業系統歸類為“低風險”,這可能會刺激對可解釋演算法的需求,並為全球技術碎片化格局增添區域性特徵。從數據上看,雖然機器學習仍然佔據核心工作負載的很大一部分,但電腦視覺領域在農業人工智慧市場中的佔有率預計將穩步成長。
區域分析
北美地區在2025年農業機械支出方面佔比高達38.91%,這得益於其GPS導航農業機械的高普及率、農村地區的寬頻基礎設施以及適應氣候變遷的補貼計畫。美國農業部的「保護管理計畫」(Conservation Stewardship program)進行了修訂,規定如果施肥計畫經機械檢驗,則可報銷高達75%的人工智慧感測器和軟體成本。加拿大的「農業清潔技術計畫」(Agricultural 潔淨科技 Program)在2025年撥款5,000萬加元(約3,700萬美元)用於精密農業設備。墨西哥酪梨出口商目前正在實施人工智慧驅動的可追溯系統,以滿足美國進口法規的要求。由於勞動力短缺,在獲得監管部門批准之前,全自動機器人的普及速度仍然緩慢。
預計亞太地區將成為成長最快的地區,到2031年複合年成長率將達到22.98%。中國的200個智慧農業區強制部署在地化的AI技術棧,為中國與雲端夥伴關係奠定了基礎。印度的Kisan Suvidha為5000萬用戶提供基於衛星的農業諮詢服務。日本計劃在2027年10萬公頃農田上部署自動駕駛曳引機,以應對農村人口老化問題。澳洲正在利用人工智慧驅動的蒸散模型來管理墨累-達令河的水資源分配。從中國的數據本地化法規到印度的基於用戶許可的系統,監管差異迫使供應商對數據流進行本地化,但市場需求遠大於這些摩擦。
到2025年,人工智慧在歐洲、南美洲以及中東和非洲的市場佔有率仍將維持在個位數到十幾的水平。歐盟已將超過三分之一的農村發展資金分配給數位農業,推動了德國和波蘭各地感測器的部署。巴西的「農業4.0」稅收優惠政策正在加速大豆農場採用人工智慧技術。沙烏地阿拉伯國家農業技術中心正在支持人工智慧最佳化的垂直農場,以減少對進口的依賴。南非一家柑橘包裝商正在實施電腦視覺分類技術,以達到歐盟標準,而奈及利亞正在Delta地區試驗利用衛星作物監測技術監測水稻種植。這些努力共同推動了全球農業人工智慧市場的發展,即使在基礎設施仍然不完善的地區也是如此。
其他好處:
- Excel格式的市場預測(ME)表
- 3個月的分析師支持
目錄
第1章:引言
- 研究假設和市場定義
- 調查範圍
第2章:調查方法
第3章執行摘要
第4章 市場狀況
- 市場概覽
- 市場促進因素
- 精密農業平台的快速普及
- 擴展高解析度無人機和衛星影像服務
- 政府對數位農業的補貼和強制規定
- 經濟實惠的雲端人工智慧即服務 (AIaaS)
- 在農場引入 GenAI 輔助駕駛員減少了農業技術人員的實地考察次數。
- 5G Open-RAN 亞米級定位技術在自主機器人領域的應用
- 市場限制因素
- 農業數據標準差異
- 小規模農戶使用感測器和機器人技術的初始成本較高
- 缺乏人工智慧支援的農業資料集和隱私挑戰
- 土壤碳權額的檢驗週期較長。
- 產業價值鏈分析
- 監理情勢
- 技術展望
- 宏觀經濟因素對市場的影響
- 波特五力分析
- 投資分析
第5章 市場規模與成長預測
- 透過使用
- 精密農業
- 牲畜監測
- 無人機分析
- 智慧溫室管理
- 供應鏈和採後管理的最佳化
- 透過技術
- 機器學習
- 電腦視覺
- 預測分析
- 自然語言處理(NLP)
- 按組件
- 硬體(感測器、無人機、機器人)
- 軟體平台
- 服務(諮詢、系統整合、支援)
- 部署模式
- 雲
- 現場
- 混合
- 按地區
- 北美洲
- 美國
- 加拿大
- 墨西哥
- 南美洲
- 巴西
- 阿根廷
- 其他南美國家
- 歐洲
- 德國
- 法國
- 英國
- 義大利
- 其他歐洲國家
- 亞太地區
- 中國
- 印度
- 日本
- 澳洲
- 其他亞太國家
- 中東
- 沙烏地阿拉伯
- 阿拉伯聯合大公國
- 其他中東國家
- 非洲
- 南非
- 奈及利亞
- 其他非洲國家
- 北美洲
第6章 競爭情勢
- 市場集中度
- 策略趨勢
- 市佔率分析
- 公司簡介
- Microsoft Corporation
- IBM Corporation
- Deere and Company
- Trimble Inc.
- Bayer Crop Science-Climate FieldView
- Granular Inc.
- Prospera Technologies Ltd.
- Gamaya SA
- aWhere Inc.
- CropX Technologies
- Taranis
- Raven Industries
- PrecisionHawk Inc.
- AgEagle Aerial Systems
- Aerobotics
- Syngenta Group
- Topcon Agriculture
- Tule Technologies Inc.
- Intelligent Growth Solutions(IGS)
- Blue River Technology
第7章 市場機會與未來展望
According to Mordor Intelligence, the aI in agriculture market size is expected to grow from USD 2.43 billion in 2025 to USD 3.11 billion in 2026 and is forecast to reach USD 8.39 billion by 2031 at a 21.96% CAGR over 2026-2031.
This report is Segmented by Application (Precision Farming, Livestock Monitoring, Drone Analytics, Smart Greenhouse Management, and Supply-Chain and Post-Harvest Optimization), Technology (Machine Learning, Computer Vision, and More), Component (Hardware, Software Platforms, and Services), Deployment Mode (Cloud, and Hybrid), and Geography. The Market Forecasts are Provided in Terms of Value (USD).
Global AI In Agriculture Market Trends and Insights
Rapid Adoption of Precision Agriculture Platforms
Deere and Company embedded machine-learning algorithms into its Operations Center in 2025, allowing the platform to ingest multi-year yield maps and soil conductivity readings, then automatically generate seeding prescriptions that trimmed seed outlays by 8-12% for early adopters. Trimble followed in early 2026 by layering generative-AI report-writing tools onto its Ag Software suite, letting farm managers brief financiers without manually compiling dashboards. Carbon-accounting modules are now standard add-ons because protocols such as Verra VM0042 require plot-level quantification of sequestration before issuing credits. As growers trade verified carbon credits, they reinvest proceeds into additional sensors, reinforcing data network effects. The result is a flywheel in which platform usage deepens each season, making switching increasingly costly.
Expansion of High-Resolution Drone and Satellite Imagery Services
PrecisionHawk launched a 2025 service tier that fuses drone imagery with Sentinel-1 synthetic-aperture radar, providing all-weather soil-moisture and biomass maps. Aerobotics deployed computer-vision models in 2026 to count individual citrus fruit, enabling packers to lock forward contracts six weeks earlier than before. Planet Labs' SuperDove constellation now revisits every field daily at 3-meter resolution, giving agronomists near-real-time feedback for double-cropping systems. Such temporal density compresses decision cycles and minimizes yield penalties caused by timing errors.
Fragmented Agronomic Data Standards
Only 30% of farm-management software vendors had adopted AgGateway's ADAPT data-exchange framework by 2025, forcing growers to reconcile incompatible file formats when switching suppliers. Soil taxonomies diverge; the USDA recognizes 12 soil orders, while the World Reference Base lists 32, confounding model portability. Weather-station protocols and pest nomenclatures vary, degrading forecast accuracy when datasets are pooled internationally. Vendors must build and maintain regional models, inflating development costs and delaying feature launches.
Other drivers and restraints analyzed in the detailed report include:
- Government Digital-Farming Subsidies and Mandates
- Affordable Cloud-Based AI-as-a-Service Offerings
- High Upfront Cost of Sensors and Robotics for Smallholders
For complete list of drivers and restraints, kindly check the Table Of Contents.
Segment Analysis
Precision farming held the largest AI in agriculture market share at 43.29% in 2025, reflecting widespread variable-rate equipment on corn and soybean acres. Smart greenhouse management, however, is projected to lead application growth, expanding at 22.47% through 2031. Intelligent Growth Solutions' generative-AI copilot fine-tunes CO2 levels and LED spectra every few minutes, enabling vertical farms to cut energy use by 18% without yield loss. Livestock monitoring is gaining velocity as computer-vision systems flag lameness and calving risks days in advance, reducing vet costs and mortality. Drone analytics maintains a mid-teens position but can rise once regulators enable beyond-visual-line-of-sight flights.
Dense greenhouse datasets sensor readings every five minutes across dozens of variables accelerate model iteration, whereas open-field crops produce sparser data, slowing algorithm refinement. Certifications such as GlobalGAP are beginning to require AI-enabled traceability, nudging post-harvest optimization platforms into mainstream budgets. As a result, the AI in agriculture market size for controlled-environment applications is on track to close part of the gap with mainstream row crops by 2031.
Machine learning commanded 48.19% of 2025 spending, anchoring the broader AI in agriculture market. Computer vision, though smaller, is forecast to expand at 22.68% over 2026-2031, outpacing other technologies as drone fleets and edge processors proliferate. Deere's See and Spray system uses convolutional networks to differentiate crops from weeds at 20 frames per second, cutting herbicide use by up to 90%. Taranis captures sub-millimeter imagery to spot early fungal lesions, enabling fungicide precision that lowers chemical bills by 30-40%.
Edge-inference chips such as NVIDIA Jetson Orin and Google Coral now retail below USD 200, allowing real-time processing on sprayers without cloud latency. European AI-Act proposals that rate some agricultural systems as "limited risk" could tilt demand toward interpretable algorithms, adding a regional flavour to global technology splits. In numerical terms, the computer-vision segment's share of AI in agriculture market size is projected to climb steadily, even as machine learning retains core workload dominance.
Complete Report Scope:
- By Application
- Precision Farming
- Livestock Monitoring
- Drone Analytics
- Smart Greenhouse Management
- Supply-Chain and Post-Harvest Optimization
- By Technology
- Machine Learning
- Computer Vision
- Predictive Analytics
- Natural-Language Processing (NLP)
- By Component
- Hardware (Sensors, Drones, Robots)
- Software Platforms
- Services (Consulting, Integration, Support)
- By Deployment Mode
- Cloud
- On-Premise
- Hybrid
- By Geography
- North America
- United States
- Canada
- Mexico
- South America
- Brazil
- Argentina
- Rest of South America
- Europe
- Germany
- France
- United Kingdom
- Italy
- Rest of Europe
- Asia-Pacific
- China
- India
- Japan
- Australia
- Rest of Asia-Pacific
- Middle East
- Saudi Arabia
- United Arab Emirates
- Rest of Middle East
- Africa
- South Africa
- Nigeria
- Rest of Africa
- North America
Geography Analysis
North America commanded 38.91% of 2025 spending thanks to high penetration of GPS-guided machinery, broadband coverage in rural counties, and climate-smart subsidies. USDA's Conservation Stewardship revisions reimburse up to 75% of AI sensor and software costs when nutrient plans are machine-verified. Canada's Agricultural Clean Technology Program disbursed CAD 50 million (USD 37 million) in 2025 for precision-farming gear. Mexico's avocado exporters now integrate AI traceability to meet United States import rules. Labor limits still slow fully autonomous robots pending regulatory clearance.
Asia-Pacific is projected to grow fastest at a 22.98% CAGR through 2031. China's 200 smart-farm zones mandate local AI stack deployment, anchoring domestic cloud partnerships. India's Kisan Suvidha serves 50 million users with satellite-based advisories. Japan targets 100,000 hectares under autonomous tractors by 2027 to offset rural aging. Australia leverages AI evapotranspiration models to ration Murray-Darling water. Regulatory divergence from China's data-localization rules to India's consent-based regime forces vendors to regionalize data flows, yet demand outstrips these frictions.
Europe, South America, the Middle East, and Africa each held single-digit to low-teens slices in 2025. The EU earmarks over one-third of rural-development funds for digital farming, spurring sensor rollouts across Germany and Poland. Brazil's Agro 4.0 tax incentives catalyse AI uptake on soybean estates. Saudi Arabia's National Center for Agriculture Technology backs AI-optimized vertical farms to cut import dependency. South Africa's citrus packers deploy computer-vision grading to meet EU standards, while Nigeria pilots satellite crop monitoring for rice in the Niger Delta. Collectively, these initiatives expand the global AI in agriculture market, even where infrastructure gaps persist.
- Microsoft Corporation
- IBM Corporation
- Deere and Company
- Trimble Inc.
- Bayer Crop Science - Climate FieldView
- Granular Inc.
- Prospera Technologies Ltd.
- Gamaya SA
- aWhere Inc.
- CropX Technologies
- Taranis
- Raven Industries
- PrecisionHawk Inc.
- AgEagle Aerial Systems
- Aerobotics
- Syngenta Group
- Topcon Agriculture
- Tule Technologies Inc.
- Intelligent Growth Solutions (IGS)
- Blue River Technology
Additional Benefits:
- The market estimate (ME) sheet in Excel format
- 3 months of analyst support
TABLE OF CONTENTS
1 INTRODUCTION
- 1.1 Study Assumptions and Market Definition
- 1.2 Scope of the Study
2 RESEARCH METHODOLOGY
3 EXECUTIVE SUMMARY
4 MARKET LANDSCAPE
- 4.1 Market Overview
- 4.2 Market Drivers
- 4.2.1 Rapid Adoption of Precision Agriculture Platforms
- 4.2.2 Expansion of High-Resolution Drone and Satellite Imagery Services
- 4.2.3 Government Digital-Farming Subsidies and Mandates
- 4.2.4 Affordable Cloud-Based AI-as-a-Service Offerings
- 4.2.5 On-Farm GenAI Copilots Reducing Agronomist Field Visits
- 4.2.6 5G Open-RAN Sub-Meter Positioning for Autonomous Robots
- 4.3 Market Restraints
- 4.3.1 Fragmented Agronomic Data Standards
- 4.3.2 High Upfront Cost of Sensors and Robotics for Smallholders
- 4.3.3 Limited AI-Ready Agronomic Datasets and Privacy Hurdles
- 4.3.4 Slow Soil-Carbon Credit Verification Cycles
- 4.4 Industry Value-Chain Analysis
- 4.5 Regulatory Landscape
- 4.6 Technological Outlook
- 4.7 Impact of Macroeconomic Factors on the Market
- 4.8 Porter's Five Forces Analysis
- 4.8.1 Bargaining Power of Buyers
- 4.8.2 Bargaining Power of Suppliers
- 4.8.3 Threat of New Entrants
- 4.8.4 Threat of Substitute Products
- 4.8.5 Intensity of Competitive Rivalry
- 4.9 Investment Analysis
5 MARKET SIZE AND GROWTH FORECASTS (VALUE)
- 5.1 By Application
- 5.1.1 Precision Farming
- 5.1.2 Livestock Monitoring
- 5.1.3 Drone Analytics
- 5.1.4 Smart Greenhouse Management
- 5.1.5 Supply-Chain and Post-Harvest Optimization
- 5.2 By Technology
- 5.2.1 Machine Learning
- 5.2.2 Computer Vision
- 5.2.3 Predictive Analytics
- 5.2.4 Natural-Language Processing (NLP)
- 5.3 By Component
- 5.3.1 Hardware (Sensors, Drones, Robots)
- 5.3.2 Software Platforms
- 5.3.3 Services (Consulting, Integration, Support)
- 5.4 By Deployment Mode
- 5.4.1 Cloud
- 5.4.2 On-Premise
- 5.4.3 Hybrid
- 5.5 By Geography
- 5.5.1 North America
- 5.5.1.1 United States
- 5.5.1.2 Canada
- 5.5.1.3 Mexico
- 5.5.2 South America
- 5.5.2.1 Brazil
- 5.5.2.2 Argentina
- 5.5.2.3 Rest of South America
- 5.5.3 Europe
- 5.5.3.1 Germany
- 5.5.3.2 France
- 5.5.3.3 United Kingdom
- 5.5.3.4 Italy
- 5.5.3.5 Rest of Europe
- 5.5.4 Asia-Pacific
- 5.5.4.1 China
- 5.5.4.2 India
- 5.5.4.3 Japan
- 5.5.4.4 Australia
- 5.5.4.5 Rest of Asia-Pacific
- 5.5.5 Middle East
- 5.5.5.1 Saudi Arabia
- 5.5.5.2 United Arab Emirates
- 5.5.5.3 Rest of Middle East
- 5.5.6 Africa
- 5.5.6.1 South Africa
- 5.5.6.2 Nigeria
- 5.5.6.3 Rest of Africa
- 5.5.1 North America
6 COMPETITIVE LANDSCAPE
- 6.1 Market Concentration
- 6.2 Strategic Moves
- 6.3 Market Share Analysis
- 6.4 Company Profiles (includes Global Level Overview, Market Level Overview, Core Segments, Financials as available, Strategic Information, Market Rank/Share, Products and Services, Recent Developments)
- 6.4.1 Microsoft Corporation
- 6.4.2 IBM Corporation
- 6.4.3 Deere and Company
- 6.4.4 Trimble Inc.
- 6.4.5 Bayer Crop Science - Climate FieldView
- 6.4.6 Granular Inc.
- 6.4.7 Prospera Technologies Ltd.
- 6.4.8 Gamaya SA
- 6.4.9 aWhere Inc.
- 6.4.10 CropX Technologies
- 6.4.11 Taranis
- 6.4.12 Raven Industries
- 6.4.13 PrecisionHawk Inc.
- 6.4.14 AgEagle Aerial Systems
- 6.4.15 Aerobotics
- 6.4.16 Syngenta Group
- 6.4.17 Topcon Agriculture
- 6.4.18 Tule Technologies Inc.
- 6.4.19 Intelligent Growth Solutions (IGS)
- 6.4.20 Blue River Technology
7 MARKET OPPORTUNITIES AND FUTURE OUTLOOK
- 7.1 White-Space and Unmet-Need Assessment

 人工智慧在農業領域的應用:市場機會、成長促進因素、產業趨勢分析及2026-2035年預測
 農業領域生成式人工智慧市場:按交付方式、應用、最終用戶、國家和地區分類-全球產業分析、市場規模、市場佔有率及2026年至2033年預測
 農業人工智慧市場-2026-2032年全球市場預測人工智慧在老化和老年護理領域的市場:全球產業分析、市場規模、市場佔有率和預測(2026-2033 年),按設備類型、解決方案類型、應用、服務、最終用戶、國家和地區分類
 永續醫療設備市場預測至2034年-按產品類型、永續發展承諾、材料類型、應用、最終用戶和地區分類的全球分析永續設備市場:2026-2032年全球市場預測(按設備類型、電源、價格範圍、應用、最終用戶和分銷管道分類)
 2035年前農業人工智慧 (AI) 市場分析和預測:按類型、產品、服務、技術、組件、應用、流程、部署、最終用戶和解決方案分類。
 2026年全球農業人工智慧(AI)市場報告
 農業人工智慧市場:策略性洞察與預測(2026-2031 年)人工智慧在溫室自動化管理市場分析及預測(至2035年):按類型、產品、服務、技術、組件、應用、部署、最終用戶、功能和解決方案分類