


 |
市場調查報告書
商品編碼
2114146
物聯網感測器:市場佔有率分析、產業趨勢與統計、成長預測(2026-2031)IoT Sensor - Market Share Analysis, Industry Trends & Statistics, Growth Forecasts (2026 - 2031) |
||||||

※ 本網頁內容可能與最新版本有所差異。詳細情況請與我們聯繫。
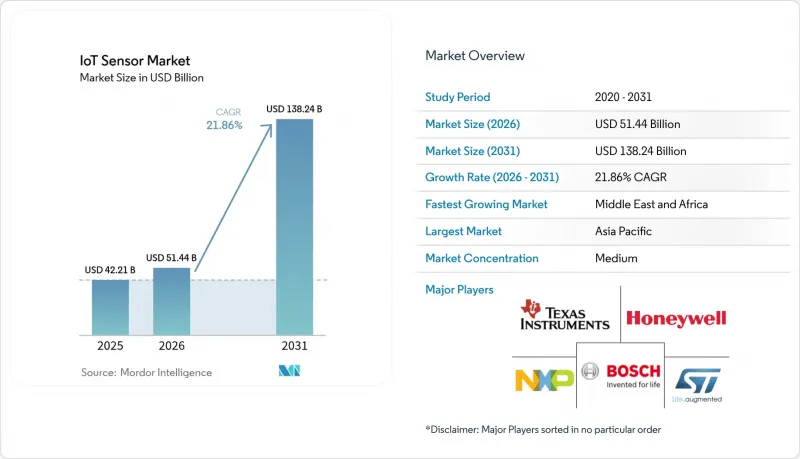
根據 Mordor Intelligence 稱,物聯網感測器市場規模預計在 2026 年達到 514.4 億美元,高於 2025 年的 422.1 億美元,預計到 2031 年將達到 1,382.4 億美元。
預計 2026 年至 2031 年的複合年成長率為 21.86%。
本報告按感測器類型(壓力感測器、溫度感測器等)、技術(MEMS、光學等)、連接方式(有線、無線(Wi-Fi等))、電源(電池供電、能源採集等)、最終用戶(汽車/交通運輸、醫療保健等)、應用領域和地區進行細分。市場預測以美元計價。
全球物聯網感測器市場趨勢與洞察
在歐洲的離散製造業中,能夠進行邊緣分析的低功耗 MEMS多模態感測器正在迅速普及。
歐洲製造商正將多模態MEMS感測器直接整合到設備中,用於現場分析振動、溫度、聲音和壓力。 TDK的「i3微模組」整合了一個人工智慧核心,可在故障發生前預測異常情況。 BoschSensortec的「BHI360」系列產品支援手勢辨識和3D音訊功能,功耗低於600µA,並且在傳統生產線維修中可將網路流量降低80%。據報道,在德國和義大利的工廠中,利用這些邊緣設備的預測性維護計畫可將成本降低25%,並將設備壽命延長20-30%。
北美和印度的強制性車輛遠端資訊處理法規正在推動對汽車慣性/壓力感測器的需求不斷成長。
美國的SmartWay現代化計畫和印度的商用車輛追蹤法規均要求車輛業者收集即時車輛數據。德克薩斯(TI)的AWR1843AOP雷達整合了DSP和MCU模組,以滿足報告和安全要求,並支援高級駕駛輔助系統(ADAS)。隨著物流公司轉向預測性維護計劃,多感測器陣列的需求不斷成長,該雷達的應用也日益廣泛。
200mm MEMS 代工廠產能不足,限制了汽車慣性感測器的供應。
全球半導體製造業正面臨200mm MEMS晶圓代工廠產能嚴重受限的困境,導致用於開發高級駕駛輔助系統和自動駕駛汽車的汽車慣性感測器供應出現瓶頸。儘管SEMI預測全球半導體晶圓廠產能將在2024年成長6%,2025年成長7%,但汽車感測器的需求年增率卻超過25%,導致供需持續失衡。這種供不應求對需要特殊封裝和寬溫域的汽車慣性感測器影響尤為嚴重,其認證週期可能比標準消費性應用長18至24個月。 X-FAB Foundry投資10億美元用於汽車和工業應用領域的擴建計劃,象徵著整個產業為解決產能限制而做出的努力,儘管新晶圓廠通常需要2至3年才能達到運作。
細分市場分析
影像感測器的複合年成長率 (CAGR) 為 27.78%,預計到 2031 年將超過壓力感測器 (17.94%) 的市場佔有率。隨著自動駕駛汽車和人工智慧驅動的檢測系統從原型階段走向量產階段,基於影像的物聯網感測器市場正在不斷擴張。汽車製造商正在將高動態範圍 (HDR) CMOS成像器與慣性測量單元 (IMU) 整合,以實現感測器融合,從而確保在複雜的城市交通環境中安全駕駛。工業用戶正在部署可在本地執行神經網路推理的智慧相機,以降低頻寬成本並保護智慧財產權 (IP)。同時,壓力感測器在氣壓設備、暖通空調 (HVAC) 和製程自動化領域仍然至關重要,需求保持穩定。在上述兩個領域,供應商都在整合微控制器和安全隔離區,以滿足連網機器的網路安全需求。
第二波溫度、運動和接近感測器正瞄準穿戴式裝置和協作機器人。嵌入式人工智慧程式能夠辨識手勢和細微動作,從而豐富使用者介面。化學和氣體感測器面臨校準漂移的挑戰,但日益嚴格的空氣品質法規以及燃料電池汽車對氫氣洩漏檢測的需求,推動了其持續成長。慣性感測器和磁感測器在物聯網感測器市場中的地位日益鞏固,它們為電動車的馬達控制和工業執行器的精確位置回饋提供支援。
預計到2025年,MEMS將佔銷售額的42.15%,憑藉其成本效益高的晶圓層次電子構裝,鞏固其在物聯網感測器市場的佔有率。同時,以雷射雷達和結構化光學系統為代表的光學技術正以25.48%的年成長率成長。 MEMS代工廠目前正在將光調製器和慣性元件進行共封裝,從而實現混合模組,這些模組可以從單一插槽提供距離和方向資料。 CMOS成像器雖然在成熟的消費性電子領域已趨於飽和,但仍是智慧型手機和行車記錄器等設備更換過程中的核心組件。電化學感測器在即時診斷領域保持著強勁的地位。壓電能源採集再次受到關注,因為設計人員正在利用振動能量為亞毫瓦級感測器叢集供電。
材料技術也在快速發展。英飛凌的石墨烯霍爾元件的靈敏度是矽基霍爾元件的100倍,使其能夠在機器人領域實現超低磁場檢測。封裝技術的進步,例如將玻璃矽通孔(GTSV)與覆晶結合,在縮小晶片尺寸的同時改善了散熱性能,即使在汽車應用的極端溫度環境下也能保持高可靠性。
區域分析
到2025年,亞太地區將佔全球銷售額的32.55%,成為市場的主要驅動力。中國的《工業網際網路創新與發展行動計畫》正在引入感測器網路,以實現高速設備連接;日本分配的5G專用頻段則為智慧工廠的確定性通訊提供了支援。韓國正利用其先進的半導體製造程序,確保向區域OEM廠商穩定供應產品。在印度,商用車強制安裝遠端資訊處理系統,正迅速擴大對慣性感測器和環境感測器的需求。澳洲採礦業正在尋求經認證可在爆炸性環境中使用的堅固耐用的設備,這在物聯網感測器市場中創造了一個獨特的細分市場。
北美正受益於《晶片與科學法案》。德克薩斯已獲得16億美元資金,用於建造三座300毫米晶圓廠,從而增強其在北美的感測器生產能力。網路安全是該地區的優先事項,要求供應商整合安全啟動、加密和空中升級功能。加拿大正在投資環境感測技術以監測野火風險,而墨西哥的汽車產業叢集則在尋求具有成本競爭力的安全感測器。
歐洲已實施嚴格的排放氣體法規和安全標準。德國的主要分立元件製造商正在引入人工智慧賦能的微機電系統(MEMS)模組,以降低缺陷率。法國正在投資智慧照明和交通管理系統,以減少碳排放。北歐的離岸風力發電電場正在部署能源採集感測器,以應對零下海域的渦輪機應力。歐盟的《網路彈性法案》要求供應商對軟體驅動的感測器進行認證,雖然增加了設計的複雜性,但也增強了買家的信心。
其他好處:
- Excel格式的市場預測(ME)表
- 3個月的分析師支持
目錄
第1章:引言
- 研究假設和市場定義
- 調查範圍
- 調查方法
- 執行摘要
第2章 市場狀況
- 市場概覽
- 市場促進因素
- 歐洲製造業中低功耗MEMS多模態感測器的快速普及
- 北美和印度的強制性車輛遠端資訊處理法規
- 離岸風力發電中的無電池能源採集節點(北歐國家和英國)
- 日本一家私有的 5G 工廠網路需要影像感測器。
- 智慧水錶在中東地區的普及,推動了超音波流量計的普及。
- LoRaWAN/Sigfox LPWAN 的快速普及使得高度擴充性的工業IoT成為可能。
- 市場限制因素
- 200 毫米 MEMS 代工廠供不應求限制了汽車感測器的供應。
- 化學感測器的校準漂移阻礙了其在製藥業的應用。
- 對網路物理攻擊的擔憂正在減緩拉丁美洲智慧電網的部署。
- 射頻認證成本的波動推高了多重通訊協定模組的成本。
- 價值供應鏈分析
- 技術展望
- 監理展望
- 投資分析
- 波特五力模型
第3章 市場規模與成長預測
- 依感測器類型
- 壓力感測器
- 溫度感測器
- 動作感測器和接近感測器
- 化學和氣體感測器
- 濕度感測器
- 影像感測器
- 慣性感測器(加速計、陀螺儀)
- 磁感測器
- 光學和光感測器
- 液位和流量感測器
- 透過技術
- MEMS
- CMOS
- 光學
- 電化學
- 磁性
- 壓電和其他
- 連結性別
- 有線(乙太網路、Modbus、CAN)
- 無線Wi-Fi
- 無線藍牙/BLE
- 無線 Zigbee/Z-Wave
- 無線 LoRaWAN/Sigfox
- 無線蜂窩網路(2G、5G、NB-IoT)
- RFID/NFC
- 透過電源
- 電池供電
- 能源採集(熱能、振動能、射頻能)
- PoE(乙太網路供電)和有線電源
- 產業最終用途
- 製造和工業自動化
- 汽車和運輸業
- 醫療保健和醫療設備
- 家用電子電器和穿戴式裝置
- 智慧家庭和建築自動化
- 能源和公共產業(石油和天然氣、智慧電網)
- 農業和環境監測
- 物流和供應鏈(低溫運輸、資產追蹤)
- 智慧城市基礎設施
- 國防與安全
- 透過使用情況分析(詳情)
- 預測性保護
- 狀態監控
- 結構完整性監測
- 人機介面
- 環境感知
- 按地區
- 北美洲
- 美國
- 加拿大
- 墨西哥
- 南美洲
- 巴西
- 阿根廷
- 其他南美國家
- 歐洲
- 德國
- 英國
- 法國
- 義大利
- 西班牙
- 北歐國家(瑞典、挪威、丹麥、芬蘭)
- 比荷盧經濟聯盟(比利時、荷蘭、盧森堡)
- 中東
- 沙烏地阿拉伯
- 阿拉伯聯合大公國
- 以色列
- 土耳其
- 非洲
- 南非
- 奈及利亞
- 肯亞
- 其他非洲國家
- 亞洲
- 中國
- 日本
- 印度
- 韓國
- 東協(新加坡、馬來西亞、泰國、印尼、菲律賓、越南)
- 北美洲
第4章 競爭情勢
- 市場集中度
- 策略趨勢
- 市佔率分析
- 公司簡介
- Bosch Sensortec GmbH
- Honeywell International Inc.
- STMicroelectronics NV
- Texas Instruments Inc.
- NXP Semiconductors NV
- TE Connectivity Ltd.
- Sensata Technologies Holding plc
- Analog Devices Inc.
- Infineon Technologies AG
- Qualcomm Inc.
- Sony Group Corp.
- AMS-OSRAM AG
- Murata Manufacturing Co. Ltd.
- Panasonic Holdings Corp.
- ABB Ltd.
- Schneider Electric SE
- Siemens AG
- Semtech Corp.
- Sensirion AG
- Omron Corporation
第5章 市場機會與未來展望
- 評估閒置頻段和未滿足的需求
According to Mordor Intelligence, ioT sensors market size in 2026 is estimated at USD 51.44 billion, growing from 2025 value of USD 42.21 billion with 2031 projections showing USD 138.24 billion, growing at 21.86% CAGR over 2026-2031.
This report is Segmented by Sensor Type (Pressure Sensors, Temperature Sensors, and More), Technology (MEMS, Optical, and More), Connectivity (Wired, Wireless - Wi-Fi, and More), Power Source (Battery-Powered, Energy-harvesting, and More), End User (Automotive and Transportation, Healthcare, and More), Application, and Geography. The Market Forecasts are Provided in Terms of Value (USD).
Global IoT Sensor Market Trends and Insights
Rapid adoption of low-power MEMS-based multimodal sensors enabling edge analytics in European discrete manufacturing
European manufacturers embed multimodal MEMS sensors directly in equipment to analyze vibration, temperature, sound, and pressure on-site. TDK's i3 Micro Module integrates an AI core that predicts anomalies before breakdowns. Bosch Sensortec's BHI360 family executes gesture and 3D-audio functions in under 600 µA, cutting network traffic 80% while retrofitting legacy lines. Predictive maintenance programs using these edge devices report 25% cost savings and extend asset life 20-30% across German and Italian plants.
Mandated fleet-telematics regulations in North America and India boosting automotive inertial/pressure sensor demand
The U.S. SmartWay modernization and India's commercial-vehicle tracking rules oblige fleets to capture real-time vehicle data. Texas Instruments' AWR1843AOP radar integrates DSP and MCU blocks to meet reporting and safety needs while supporting advanced driver assistance. Adoption is scaling as logistics firms shift to predictive maintenance scheduling, raising unit demand for multi-sensor arrays.
200mm MEMS-Foundry Capacity Shortage Limiting Automotive-Grade Inertial Sensor Supply
Global semiconductor manufacturing faces acute capacity constraints in 200mm MEMS foundries, creating supply bottlenecks for automotive-grade inertial sensors required for advanced driver assistance systems and autonomous vehicle development. SEMI reports indicate global semiconductor fab capacity expansion of 6% in 2024 and 7% in 2025, yet automotive sensor demand is growing at rates exceeding 25% annually, creating persistent supply-demand imbalances. The shortage particularly affects automotive inertial sensors requiring specialized packaging and extended temperature ranges, where qualification cycles can extend 18-24 months beyond standard consumer applications. X-FAB Silicon Foundries' USD 1 billion expansion targeting automotive and industrial applications represents industry efforts to address capacity constraints, though new fab capacity typically requires 2-3 years to reach full production.
Other drivers and restraints analyzed in the detailed report include:
- Battery-less energy-harvesting sensor nodes for predictive maintenance in offshore wind farms
- Private 5G networks in Japanese smart factories requiring time-synchronized image sensors
- Calibration drift in long-lifecycle chemical sensors restricting pharma cold-chain adoption
For complete list of drivers and restraints, kindly check the Table Of Contents.
Segment Analysis
Image sensors drove a 27.78% CAGR and are forecast to eclipse pressure sensors' 17.94 % contribution by 2031. The IoT sensors market size for image-based devices is widening as autonomous vehicles and AI-powered inspection systems migrate from prototypes to volume lines. Automotive OEMs integrate high-dynamic-range CMOS imagers with inertial units for sensor fusion, ensuring safe navigation in complex urban traffic. Industrial users deploy smart cameras that execute neural-network inference locally, eliminating bandwidth costs and protecting IP. Meanwhile, pressure sensors remain staples in pneumatics, HVAC, and process automation, sustaining steady demand. Across both categories, vendors embed micro-controllers and security enclaves to meet cybersecurity mandates in connected machinery.
A second wave of temperature, motion, and proximity sensors targets wearables and collaborative robots. Embedded AI routines recognise gestures and micro-movements, enriching user interfaces. Chemical and gas sensors confront calibration-drift hurdles, yet tightening air-quality rules and hydrogen-leak detection in fuel-cell vehicles preserve growth. Inertial and magnetic sensors underpin electric-vehicle motor control and precise positional feedback in industrial actuators, cementing their role within the IoT sensors market.
MEMS retained 42.15% revenue in 2025, anchoring the IoT sensors market share through cost-effective wafer-level packaging. Yet optical techniques, led by LiDAR and structured-light systems, are growing 25.48% annually. MEMS foundries now co-package optical modulators and inertial elements, enabling hybrid modules that deliver ranging and orientation data from one socket. CMOS imagers saturate mature consumer segments but remain core to smartphone and dash-cam refresh cycles. Electrochemical sensors maintain footholds in point-of-care diagnostics. Piezoelectric harvesters re-emerge as designers tap vibration energy to power sub-milliwatt sensor clusters.
Materials innovation is brisk: Infineon's graphene-based Hall device achieves 100-times sensitivity over silicon peers, unlocking ultra-low field detection for robotics. Packaging advances combine glass-through-silicon vias with flip-chip to compress footprint while improving heat transfer, sustaining high reliability in automotive temperature extremes.
Complete Report Scope:
- By Sensor Type
- Pressure Sensors
- Temperature Sensors
- Motion and Proximity Sensors
- Chemical and Gas Sensors
- Humidity Sensors
- Image Sensors
- Inertial Sensors (Accelerometer, Gyroscope)
- Magnetic Sensors
- Optical and Light Sensors
- Level and Flow Sensors
- By Technology
- MEMS
- CMOS
- Optical
- Electrochemical
- Magnetic
- Piezoelectric and Others
- By Connectivity
- Wired (Ethernet, Modbus, CAN)
- Wireless WiFi
- Wireless Bluetooth/BLE
- Wireless Zigbee/Z-Wave
- Wireless LoRaWAN/Sigfox
- Wireless Cellular (2G, 5G, NB-IoT)
- RFID/NFC
- By Power Source
- Battery-Powered
- Energy-Harvesting (Thermal, Vibration, RF)
- Powered-over-Ethernet and Wired Power
- By End-Use Industry
- Manufacturing and Industrial Automation
- Automotive and Transportation
- Healthcare and Medical Devices
- Consumer Electronics and Wearables
- Smart Home and Building Automation
- Energy and Utilities (Oil and Gas, Smart Grid)
- Agriculture and Environmental Monitoring
- Logistics and Supply Chain (Cold-chain, Asset Tracking)
- Smart City Infrastructure
- Defense and Security
- By Application (Deep-Dive)
- Predictive Maintenance
- Condition Monitoring
- Structural Health Monitoring
- Human-Machine Interface
- Ambient Sensing
- By Geography
- North America
- United States
- Canada
- Mexico
- South America
- Brazil
- Argentina
- Rest of South America
- Europe
- Germany
- United Kingdom
- France
- Italy
- Spain
- Nordics (Sweden, Norway, Denmark, Finland)
- Benelux (Belgium, Netherlands, Luxembourg)
- Middle East
- Saudi Arabia
- United Arab Emirates
- Israel
- Turkey
- Africa
- South Africa
- Nigeria
- Kenya
- Rest of Africa
- Asia
- China
- Japan
- India
- South Korea
- ASEAN (Singapore, Malaysia, Thailand, Indonesia, Philippines, Vietnam)
- North America
Geography Analysis
Asia-Pacific led with 32.55% revenue in 2025. China's "Industrial Internet Innovation and Development Action Plan" installs sensor grids for high-speed equipment coordination, while Japan's private 5G allocations underwrite deterministic communication in smart factories. South Korea capitalizes on advanced semiconductor processes, anchoring supply security for regional OEMs. India mandates fleet telematics across commercial vehicles, rapidly scaling demand for inertial and environmental sensors. Australia's mining sector requires rugged devices certified for explosive atmospheres, creating specialized niches within the IoT sensors market.
North America benefits from the CHIPS and Science Act. Texas Instruments secured USD 1.6 billion to build three 300 mm fabs, bolstering domestic sensor capacity. The region emphasizes cybersecurity, pushing suppliers to integrate secure-boot, encryption, and over-the-air update capabilities. Canada invests in environmental sensing to monitor forest-fire risk, while Mexico's automotive clusters demand cost-competitive safety sensors.
Europe enforces strict emissions and safety standards. Germany's discrete-manufacturing champions deploy AI-enabled MEMS modules to cut scrap rates. France invests in smart lighting and traffic management for carbon reduction. Nordic offshore wind farms cultivate energy-harvesting sensor deployments to manage turbine stress in sub-zero seas. The EU Cyber Resilience Act compels suppliers to certify software-driven sensors, increasing design complexity yet raising buyer confidence.
- Bosch Sensortec GmbH
- Honeywell International Inc.
- STMicroelectronics N.V.
- Texas Instruments Inc.
- NXP Semiconductors N.V.
- TE Connectivity Ltd.
- Sensata Technologies Holding plc
- Analog Devices Inc.
- Infineon Technologies AG
- Qualcomm Inc.
- Sony Group Corp.
- AMS-OSRAM AG
- Murata Manufacturing Co. Ltd.
- Panasonic Holdings Corp.
- ABB Ltd.
- Schneider Electric SE
- Siemens AG
- Semtech Corp.
- Sensirion AG
- Omron Corporation
Additional Benefits:
- The market estimate (ME) sheet in Excel format
- 3 months of analyst support
TABLE OF CONTENTS
1 INTRODUCTION
- 1.1 Study Assumptions and Market Definition
- 1.2 Scope of the Study
- 1.3 Research Methodology
- 1.4 Executive Summary
2 MARKET LANDSCAPE
- 2.1 Market Overview
- 2.2 Market Drivers
- 2.2.1 Rapid adoption of low-power MEMS-based multimodal sensors in Euro manufacturing
- 2.2.2 Mandated fleet-telematics regs in North America and India
- 2.2.3 Battery-less energy-harvesting nodes in Offshore Wind (Nordics and UK)
- 2.2.4 Private 5G factory networks in Japan requiring image sensors
- 2.2.5 Smart-water-meter rollouts in Middle-East boosting ultrasonic-flow uptake
- 2.2.6 Rapid adoption of LoRaWAN/Sigfox LPWANs enabling scalable industrial IoT
- 2.3 Market Restraints
- 2.3.1 200 mm MEMS-foundry shortage limiting automotive sensor supply
- 2.3.2 Calibration drift in chemical sensors hindering pharma adoption
- 2.3.3 Cyber-physical attack concerns delaying smart-grid in Latin-America
- 2.3.4 Divergent RF-certification costs inflating multi-protocol module costs
- 2.4 Value / Supply-Chain Analysis
- 2.5 Technological Outlook
- 2.6 Regulatory Outlook
- 2.7 Investment Analysis
- 2.8 Porter's Five Forces
- 2.8.1 Bargaining Power of Suppliers
- 2.8.2 Bargaining Power of Consumers
- 2.8.3 Threat of New Entrants
- 2.8.4 Intensity of Competitive Rivalry
- 2.8.5 Threat of Substitutes
3 MARKET SIZE AND GROWTH FORECASTS (VALUE)
- 3.1 By Sensor Type
- 3.1.1 Pressure Sensors
- 3.1.2 Temperature Sensors
- 3.1.3 Motion and Proximity Sensors
- 3.1.4 Chemical and Gas Sensors
- 3.1.5 Humidity Sensors
- 3.1.6 Image Sensors
- 3.1.7 Inertial Sensors (Accelerometer, Gyroscope)
- 3.1.8 Magnetic Sensors
- 3.1.9 Optical and Light Sensors
- 3.1.10 Level and Flow Sensors
- 3.2 By Technology
- 3.2.1 MEMS
- 3.2.2 CMOS
- 3.2.3 Optical
- 3.2.4 Electrochemical
- 3.2.5 Magnetic
- 3.2.6 Piezoelectric and Others
- 3.3 By Connectivity
- 3.3.1 Wired (Ethernet, Modbus, CAN)
- 3.3.2 Wireless WiFi
- 3.3.3 Wireless Bluetooth/BLE
- 3.3.4 Wireless Zigbee/Z-Wave
- 3.3.5 Wireless LoRaWAN/Sigfox
- 3.3.6 Wireless Cellular (2G, 5G, NB-IoT)
- 3.3.7 RFID/NFC
- 3.4 By Power Source
- 3.4.1 Battery-Powered
- 3.4.2 Energy-Harvesting (Thermal, Vibration, RF)
- 3.4.3 Powered-over-Ethernet and Wired Power
- 3.5 By End-Use Industry
- 3.5.1 Manufacturing and Industrial Automation
- 3.5.2 Automotive and Transportation
- 3.5.3 Healthcare and Medical Devices
- 3.5.4 Consumer Electronics and Wearables
- 3.5.5 Smart Home and Building Automation
- 3.5.6 Energy and Utilities (Oil and Gas, Smart Grid)
- 3.5.7 Agriculture and Environmental Monitoring
- 3.5.8 Logistics and Supply Chain (Cold-chain, Asset Tracking)
- 3.5.9 Smart City Infrastructure
- 3.5.10 Defense and Security
- 3.6 By Application (Deep-Dive)
- 3.6.1 Predictive Maintenance
- 3.6.2 Condition Monitoring
- 3.6.3 Structural Health Monitoring
- 3.6.4 Human-Machine Interface
- 3.6.5 Ambient Sensing
- 3.7 By Geography
- 3.7.1 North America
- 3.7.1.1 United States
- 3.7.1.2 Canada
- 3.7.1.3 Mexico
- 3.7.2 South America
- 3.7.2.1 Brazil
- 3.7.2.2 Argentina
- 3.7.2.3 Rest of South America
- 3.7.3 Europe
- 3.7.3.1 Germany
- 3.7.3.2 United Kingdom
- 3.7.3.3 France
- 3.7.3.4 Italy
- 3.7.3.5 Spain
- 3.7.3.6 Nordics (Sweden, Norway, Denmark, Finland)
- 3.7.3.7 Benelux (Belgium, Netherlands, Luxembourg)
- 3.7.4 Middle East
- 3.7.4.1 Saudi Arabia
- 3.7.4.2 United Arab Emirates
- 3.7.4.3 Israel
- 3.7.4.4 Turkey
- 3.7.5 Africa
- 3.7.5.1 South Africa
- 3.7.5.2 Nigeria
- 3.7.5.3 Kenya
- 3.7.5.4 Rest of Africa
- 3.7.6 Asia
- 3.7.6.1 China
- 3.7.6.2 Japan
- 3.7.6.3 India
- 3.7.6.4 South Korea
- 3.7.6.5 ASEAN (Singapore, Malaysia, Thailand, Indonesia, Philippines, Vietnam)
- 3.7.1 North America
4 COMPETITIVE LANDSCAPE
- 4.1 Market Concentration
- 4.2 Strategic Moves
- 4.3 Market Share Analysis
- 4.4 Company Profiles
- 4.4.1 Bosch Sensortec GmbH
- 4.4.2 Honeywell International Inc.
- 4.4.3 STMicroelectronics N.V.
- 4.4.4 Texas Instruments Inc.
- 4.4.5 NXP Semiconductors N.V.
- 4.4.6 TE Connectivity Ltd.
- 4.4.7 Sensata Technologies Holding plc
- 4.4.8 Analog Devices Inc.
- 4.4.9 Infineon Technologies AG
- 4.4.10 Qualcomm Inc.
- 4.4.11 Sony Group Corp.
- 4.4.12 AMS-OSRAM AG
- 4.4.13 Murata Manufacturing Co. Ltd.
- 4.4.14 Panasonic Holdings Corp.
- 4.4.15 ABB Ltd.
- 4.4.16 Schneider Electric SE
- 4.4.17 Siemens AG
- 4.4.18 Semtech Corp.
- 4.4.19 Sensirion AG
- 4.4.20 Omron Corporation
5 MARKET OPPORTUNITIES AND FUTURE OUTLOOK
- 5.1 White-space and Unmet-Need Assessment

 全球物聯網感測器市場規模、佔有率、趨勢和成長分析報告(2026-2034年)
 物聯網感測器市場-2026-2032年全球市場預測
 物聯網感測器市場機會、成長要素、產業趨勢分析及2026-2035年預測
 物聯網感測器模組市場報告:趨勢、預測和競爭分析(至2035年)
 全球物聯網感測器市場(至2035年):產業趨勢與預測
 物聯網感測器市場分析與預測(至2035年):類型、產品類型、技術、組件、應用、最終用戶、功能、安裝模式、解決方案
 物聯網感測器市場:按感測器類型、網路技術和地區分類
 日本物聯網感測器市場規模、佔有率、趨勢和預測:按類型、應用和地區分類,2026-2034年
 2026年全球物聯網感測器市場報告
 無線物聯網感測器市場 - 全球產業規模、佔有率、趨勢、機會及預測(按組件、類型、技術、垂直產業、地區和競爭格局分類,2021-2031年)