


 |
市場調查報告書
商品編碼
2114087
軟體定義資料中心:市場佔有率分析、產業趨勢與統計及成長預測(2026-2031 年)Software Defined Data Center - Market Share Analysis, Industry Trends & Statistics, Growth Forecasts (2026 - 2031) |
||||||

※ 本網頁內容可能與最新版本有所差異。詳細情況請與我們聯繫。
根據 Mordor Intelligence 估計,軟體定義資料中心 (SDDC) 市場在 2026 年的價值將達到 920.9 億美元,從 2025 年的 732.1 億美元成長到 2031 年的 2898.4 億美元。
預計 2026 年至 2031 年的複合年成長率為 25.78%。
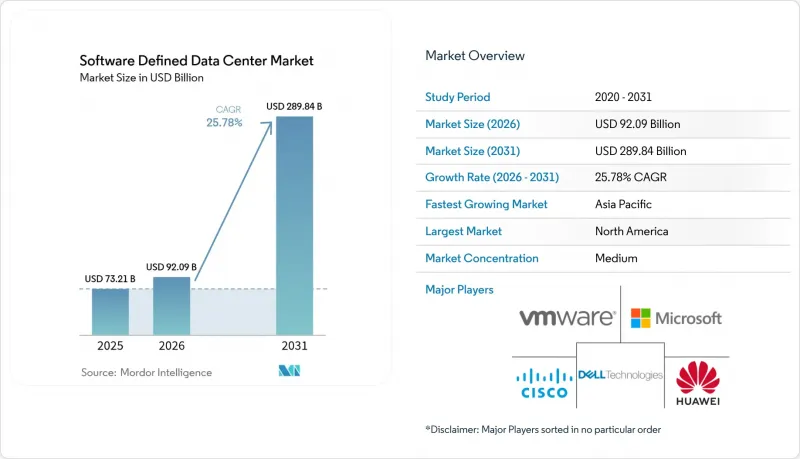
本報告按元件(解決方案和服務)、部署模式(本地部署、私有雲端、公共雲端、混合雲端)、資料中心類型(託管、超大規模資料中心業者/雲端、企業級和邊緣運算)、最終用戶產業(IT和電信、銀行、金融服務和保險、醫療保健、零售等)以及地區進行細分。市場預測以美元(USD)為單位。
全球軟體定義資料中心 (SDDC) 市場趨勢與洞察
降低硬體和資源使用成本
硬體和軟體的廣泛分離降低了資本支出並縮短了更新周期。據已實施全端軟體定義資料中心 (SDDC) 平台的公司稱,採用 VMware Cloud Foundation 可使基礎設施成本降低 34%,三年投資回報率高達 564%。自動化配置提高了資源利用率,使企業能夠在不影響效能的前提下減少 50% 的資料中心面積。再加上電力和冷卻成本的降低,無論專案位於何處,都能顯著提升投資報酬率。
雲端運算和虛擬化在企業中的快速發展
虛擬化的運算、儲存和網路池構成了混合雲策略的基礎,該策略能夠平衡對延遲敏感的工作負載與公共雲端的可擴展性。採用軟體定義資料中心 (SDDC) 平台的金融機構已利用 intent-in-cloud 對其中介軟體堆疊進行了現代化改造,從而使訊息處理速度提升了 40%,停機時間減少了 30%。與虛擬機器並行運作的 Kubernetes 主機簡化了 DevOps 管線並加速了部署。
資料安全和合規性的複雜性日益增加。
歐盟《數位營運彈性法案》等法規將從2025年1月起強制執行更嚴格的管控措施,迫使金融機構檢驗整個虛擬層的網路彈性。抽象資源池為邊界防禦帶來挑戰,增加了對整合金鑰管理中心(例如與VMware Sovereign Cloud整合的Fortanix資料安全管理器)的需求。合規性審計延長了專案工期,並增加了諮詢成本。
細分市場分析
軟體定義資料中心 (SDDC) 軟體元件市場預計到 2025 年將達到 548.4 億美元,佔總收入的 74.86%。編配引擎和基於策略的控制器正以 27.63% 的複合年成長率 (CAGR) 成長,反映出企業對自動化配置的強勁需求。早期採用者透過工作流程自動化和漂移校正,在不到 12 個月的時間內即可實現投資回報。隨著生態系統的成熟,安全插件、AI 可觀測性模組和開發者工具鏈正在擴大目標基本客群。
剩餘的市場佔有率由服務構成,包括諮詢、客製化和全天候運維。服務提供者提供遷移指南、參考架構和計量收費服務的組合方案,以幫助客戶進入這個監管嚴格的行業。雖然硬體創新正朝著可組合設計的方向發展,但它仍然受制於軟體策略,這進一步凸顯了程式碼驅動基礎設施的重要性。
到 2025 年,私有實例將佔軟體定義資料中心市場的 40.72%,受到需要保護敏感資料的組織的青睞。 VMware Cloud Foundation 就是一個承包解決方案的例子,它既能複製公共雲端的經濟效益,又能維持本地管治。然而,隨著企業尋求在不放棄停滯資產的情況下應對激增的工作負載,混合環境預計將以 25.94% 的最高複合年成長率成長。
Rackspace SDDC Flex 將託管私有雲端與超大規模擴充整合到基於使用量的收費模式中,展現了服務供應商如何模糊部署類別之間的界線。雖然純公有公共雲端環境對雲端原生企業仍然至關重要,但即使是這些企業也在尋求跨區域的統一策略引擎,以避免工具氾濫。
區域分析
預計到2025年,北美將佔全球收入的47.05%,這主要得益於虛擬化技術的早期應用、強大的雲端生態系以及蓬勃發展的超大規模資料中心業者。德克薩斯州宣佈建造一座小型核子反應爐,這顯示了一種穩定電力供應的創新方法。資料主權區域相關法規的明確將有助於美加兩國開展跨境災害復原合作,而墨西哥的金融科技業正在拓展其混合環境,以推動開放銀行計畫。
亞太地區軟體定義資料中心市場預計到2031年將以27.49%的複合年成長率成長,主要驅動力包括主權雲端津貼、電子商務的蓬勃發展以及數位銀行的牌照發放。儘管超大規模資料超大規模資料中心業者正在租賃大量容量,但他們仍然依賴第三方開發人員來獲取土地、電力和許可證。新加坡憑藉其電信營運商密集的園區,以及採用創新液冷技術來滿足電力需求,從而維持了其樞紐地位。印度、日本和中國正在建造千兆瓦級資料中心園區,而澳洲則在加大邊緣部署力度,以支援遠端挖礦作業。
在歐洲,軟體定義資料中心(SDDC)正被廣泛採用,以應對主權和碳排放目標。隨著《資料保護條例》(DORA)2025年1月最後期限的臨近,金融機構正在加快提升網路韌性,並增加對每個租戶加密疊加層的預算。北方市場引領這一趨勢,而南方國家則透過公共雲端著陸區和綠色氫能試點計畫加速部署。在非洲,阿拉伯聯合大公國和沙烏地阿拉伯的活動正在加速推進,這兩個國家正在將公用事業規模的太陽能發電廠與模組化資料中心相結合,以實現清潔能源驅動的託管。
其他好處:
- Excel格式的市場預測(ME)表
- 3個月的分析師支持
目錄
第1章:引言
- 研究假設和市場定義
- 調查範圍
第2章:調查方法
第3章執行摘要
第4章 市場狀況
- 市場概覽
- 市場促進因素
- 降低硬體和資源使用成本
- 企業雲端運算和虛擬化的蓬勃發展
- 超融合和可組合基礎架構的部署狀態
- AI驅動的資料中心基礎設施管理(DCIM)和數位孿生最佳化(一種較少被關注的方法)
- 小型核子反應爐實現機架級密度(不會引起關注)
- 5G 基地台中的邊緣原生 microSDDC編配(儘管它並未受到太多關注)
- 市場限制因素
- 資料安全和合規性的複雜性
- 與整合和遷移舊有系統相關的成本
- 電網電力短缺和併網延遲(一個被忽視的問題)
- 供應商整合進度/總擁有成本風險(常被忽略的風險)
- 供應鏈分析
- 監理情勢
- 技術展望
- 波特五力分析
- 對與市場相關的宏觀經濟趨勢進行評估
第5章 市場規模與成長預測
- 按組件
- 解決方案(SDN、SDS、SDC、自動化/編配、安全)
- 服務(諮詢和系統整合、管理服務、培訓和支援)
- 按部署模式
- 現場
- 私有雲端
- 公共雲端
- 混合雲端
- 依資料中心類型
- 搭配
- 超大規模資料中心業者/雲
- 企業和邊緣運算
- 按最終用戶行業分類
- 資訊科技/通訊
- BFSI
- 衛生保健
- 零售與電子商務
- 製造業
- 政府/國防
- 媒體與娛樂
- 能源公用事業
- 其他最終用戶
- 按地區
- 北美洲
- 美國
- 加拿大
- 墨西哥
- 歐洲
- 英國
- 德國
- 法國
- 義大利
- 西班牙
- 其他歐洲國家
- 亞太地區
- 中國
- 日本
- 印度
- 新加坡
- 澳洲
- 馬來西亞
- 其他亞太國家
- 南美洲
- 巴西
- 智利
- 阿根廷
- 其他南美國家
- 中東和非洲
- 中東
- 阿拉伯聯合大公國
- 沙烏地阿拉伯
- 土耳其
- 其他中東國家
- 非洲
- 南非
- 奈及利亞
- 其他非洲國家
- 中東
- 北美洲
第6章 競爭情勢
- 市場集中度
- 策略趨勢
- 市佔率分析
- 公司簡介
- VMware Inc.
- Microsoft Corp.
- Dell Technologies
- Cisco Systems
- Hewlett Packard Enterprise
- IBM Corp.
- Huawei Technologies
- Oracle Corp.
- Citrix Systems
- NEC Corp.
- Nutanix Inc.
- Amazon Web Services
- Google Cloud Platform
- Broadcom(VMware division)
- Juniper Networks
- Arista Networks
- Red Hat(IBM)
- Equinix Inc.
- Lenovo Group
- Rackspace Technology
第7章 市場機會與未來展望
According to Mordor Intelligence, software-defined data center market size in 2026 is estimated at USD 92.09 billion, growing from 2025 value of USD 73.21 billion with 2031 projections showing USD 289.84 billion, growing at 25.78% CAGR over 2026-2031.
This report is Segmented by Component (Solutions and Services), Deployment Model (On-Premises, Private Cloud, Public Cloud, and Hybrid Cloud), Data Center Type ( Colocation, Hyperscalers/ Cloud, and Enterprise and Edge), End-User Vertical (IT and Telecom, BFSI, Healthcare, Retail, and More), and by Geography. The Market Forecasts are Provided in Terms of Value (USD).
Global Software Defined Data Center Market Trends and Insights
Cost reduction in hardware and resource use
Widespread decoupling of hardware and software lowers capital outlays and shrinks refresh cycles. Enterprises running full-stack SDDC platforms report infrastructure cost savings of 34% and a 564% three-year ROI on VMware Cloud Foundation deployments. Automated provisioning tightens utilization, letting firms cut data center footprints by 50% without performance degradation. Lower power and cooling bills compound the benefit, reinforcing project paybacks across regions.
Cloud and virtualization boom among enterprises
Virtualized compute, storage, and network pools underpin hybrid strategies that reconcile latency-sensitive workloads with public-cloud elasticity. Financial institutions using software defined data center market platforms achieved 40% faster message processing and 30% less downtime after modernizing middleware stacks intuitive.cloud. Kubernetes-ready hosts run side by side with virtual machines, simplifying DevOps pipelines and hastening rollouts.
Data-security and compliance complexities
Regulations such as the EU Digital Operational Resilience Act mandate tighter controls from January 2025, pushing financial institutions to verify cyber resilience across virtual layers. Abstracted resource pools challenge perimeter defenses, driving demand for unified key-management hubs like Fortanix Data Security Manager that integrate with VMware Sovereign Cloud. Compliance audits prolong project timelines and raise consulting spend.
Other drivers and restraints analyzed in the detailed report include:
- Hyper-converged and composable infrastructure uptake
- AI-driven DCIM and digital-twin optimisation
- Legacy integration and migration costs
For complete list of drivers and restraints, kindly check the Table Of Contents.
Segment Analysis
The software-defined data center market size for software components reached USD 54.84 billion in 2025, equating to 74.86% of overall revenue. Orchestration engines and policy-based controllers are expanding at a 27.63% CAGR, underlining enterprise appetite for hands-free provisioning. Early adopters record sub-12-month paybacks on workflow automation and drift remediation. Security plug-ins, AI observability modules, and developer tool chains widen the addressable base as ecosystems mature.
Services contribute the remaining share, encompassing advisory, customization, and 24X7 managed operations. Providers bundle migration playbooks, reference architectures, and consumption-based billing to ease entry for heavily regulated verticals. Hardware innovations shift toward composable designs but stay governed by software policies, reinforcing the primacy of code-driven infrastructure.
Private instances captured 40.72% of the software-defined data center market in 2025, favored by organizations securing sensitive data. VMware Cloud Foundation exemplifies turnkey stacks that mimic public-cloud economies while retaining on-premises governance. Hybrid estates, however, are projected to post the highest 25.94% CAGR as firms seek elasticity for spiky workloads without abandoning sunk assets.
Rackspace SDDC Flex merges hosted private clouds with hyperscale extensions under a consumption model, illustrating how service providers blur deployment categories. Public-only footprints remain relevant for cloud-native firms, yet even they demand consistent policy engines across zones to avoid tool sprawl.
Complete Report Scope:
- By Component
- Solutions (SDN, SDS, SDC, Automation and Orchestration Security)
- Services (Consulting and Integration, Managed, Training and Support)
- By Deployment Model
- On-Premises
- Private Cloud
- Public Cloud
- Hybrid Cloud
- By Data Center Type
- Colocation
- Hyperscalers/Cloud
- Enterprise and Edge
- By End-user Vertical
- IT and Telecom
- BFSI
- Healthcare
- Retail and E-Commerce
- Manufacturing
- Government and Defense
- Media and Entertainment
- Energy and Utilities
- Other End Users
- By Geography
- North America
- United States
- Canada
- Mexico
- Europe
- United Kingdom
- Germany
- France
- Italy
- Spain
- Rest of Europe
- Asia-Pacific
- China
- Japan
- India
- Singapore
- Australia
- Malaysia
- Rest of Asia-Pacific
- South America
- Brazil
- Chile
- Argentina
- Rest of South America
- Middle East and Africa
- Middle East
- United Arab Emirates
- Saudi Arabia
- Turkey
- Rest of Middle East
- Africa
- South Africa
- Nigeria
- Rest of Africa
- Middle East
- North America
Geography Analysis
North America generated 47.05% of 2025 revenue, a consequence of early virtualization adoption, deep cloud ecosystems, and hyperscaler expansion corridors. Nuclear micro-reactor announcements in Texas signal creative approaches to power adequacy. Regulatory clarity around data-sovereignty zones fuels cross-border disaster-recovery pairings between the United States and Canada, while Mexico's fintech sector ramps up hybrid footprints for open-banking initiatives.
The Asia-Pacific software-defined data center market will rise at a 27.49% CAGR to 2031, aided by sovereign cloud grants, e-commerce surges, and digital-bank licensing rounds. Hyperscalers lease bulk capacity yet still rely on third-party developers to secure land, power, and permits. Singapore maintains hub status through carrier-dense campuses employing novel liquid cooling to meet power caps. India, Japan, and China inaugurate gigawatt-scale campuses, while Australia backs edge rollouts to serve remote mining operations.
Europe adopts SDDC in response to sovereignty and carbon targets. DORA's January 2025 deadline is spurring financial institutions to harden cyber-resilience, expanding budgets for encrypted per-tenant overlays. Northern markets lead in adoption, and southern states accelerate via public-cloud landing zones and green-hydrogen pilots. The Middle East and Africa see rising activity in the UAE and Saudi Arabia, where utility-scale solar farms couple with modular data halls for clean-energy hosting.
- VMware Inc.
- Microsoft Corp.
- Dell Technologies
- Cisco Systems
- Hewlett Packard Enterprise
- IBM Corp.
- Huawei Technologies
- Oracle Corp.
- Citrix Systems
- NEC Corp.
- Nutanix Inc.
- Amazon Web Services
- Google Cloud Platform
- Broadcom (VMware division)
- Juniper Networks
- Arista Networks
- Red Hat (IBM)
- Equinix Inc.
- Lenovo Group
- Rackspace Technology
Additional Benefits:
- The market estimate (ME) sheet in Excel format
- 3 months of analyst support
TABLE OF CONTENTS
1 INTRODUCTION
- 1.1 Study Assumptions and Market Definition
- 1.2 Scope of the Study
2 RESEARCH METHODOLOGY
3 EXECUTIVE SUMMARY
4 MARKET LANDSCAPE
- 4.1 Market Overview
- 4.2 Market Drivers
- 4.2.1 Cost reduction in hardware and resource use
- 4.2.2 Cloud and virtualization boom among enterprises
- 4.2.3 Hyper-converged and composable infrastructure uptake
- 4.2.4 AI-driven DCIM and digital-twin optimisation (under-radar)
- 4.2.5 Nuclear micro-reactors unlocking rack-level densities (under-radar)
- 4.2.6 Edge-native micro-SDDC orchestration at 5G sites (under-radar)
- 4.3 Market Restraints
- 4.3.1 Data-security and compliance complexities
- 4.3.2 Legacy integration and migration costs
- 4.3.3 Grid-power scarcity and interconnect delays (under-radar)
- 4.3.4 Increased vendor consolidation/TCO risk (under-radar)
- 4.4 Supply-Chain Analysis
- 4.5 Regulatory Landscape
- 4.6 Technological Outlook
- 4.7 Porter's Five Forces Analysis
- 4.7.1 Threat of New Entrants
- 4.7.2 Bargaining Power of Buyers
- 4.7.3 Bargaining Power of Suppliers
- 4.7.4 Threat of Substitutes
- 4.7.5 Intensity of Competitive Rivalry
- 4.8 Assessment of Macro Economic Trends on Market
5 MARKET SIZE AND GROWTH FORECASTS (VALUE)
- 5.1 By Component
- 5.1.1 Solutions (SDN, SDS, SDC, Automation and Orchestration Security)
- 5.1.2 Services (Consulting and Integration, Managed, Training and Support)
- 5.2 By Deployment Model
- 5.2.1 On-Premises
- 5.2.2 Private Cloud
- 5.2.3 Public Cloud
- 5.2.4 Hybrid Cloud
- 5.3 By Data Center Type
- 5.3.1 Colocation
- 5.3.2 Hyperscalers/Cloud
- 5.3.3 Enterprise and Edge
- 5.4 By End-user Vertical
- 5.4.1 IT and Telecom
- 5.4.2 BFSI
- 5.4.3 Healthcare
- 5.4.4 Retail and E-Commerce
- 5.4.5 Manufacturing
- 5.4.6 Government and Defense
- 5.4.7 Media and Entertainment
- 5.4.8 Energy and Utilities
- 5.4.9 Other End Users
- 5.5 By Geography
- 5.5.1 North America
- 5.5.1.1 United States
- 5.5.1.2 Canada
- 5.5.1.3 Mexico
- 5.5.2 Europe
- 5.5.2.1 United Kingdom
- 5.5.2.2 Germany
- 5.5.2.3 France
- 5.5.2.4 Italy
- 5.5.2.5 Spain
- 5.5.2.6 Rest of Europe
- 5.5.3 Asia-Pacific
- 5.5.3.1 China
- 5.5.3.2 Japan
- 5.5.3.3 India
- 5.5.3.4 Singapore
- 5.5.3.5 Australia
- 5.5.3.6 Malaysia
- 5.5.3.7 Rest of Asia-Pacific
- 5.5.4 South America
- 5.5.4.1 Brazil
- 5.5.4.2 Chile
- 5.5.4.3 Argentina
- 5.5.4.4 Rest of South America
- 5.5.5 Middle East and Africa
- 5.5.5.1 Middle East
- 5.5.5.1.1 United Arab Emirates
- 5.5.5.1.2 Saudi Arabia
- 5.5.5.1.3 Turkey
- 5.5.5.1.4 Rest of Middle East
- 5.5.5.2 Africa
- 5.5.5.2.1 South Africa
- 5.5.5.2.2 Nigeria
- 5.5.5.2.3 Rest of Africa
- 5.5.5.1 Middle East
- 5.5.1 North America
6 COMPETITIVE LANDSCAPE
- 6.1 Market Concentration
- 6.2 Strategic Moves
- 6.3 Market Share Analysis
- 6.4 Company Profiles (includes Global level Overview, Market level overview, Core Segments, Financials as available, Strategic Information, Market Rank/Share for key companies, Products and Services, and Recent Developments)
- 6.4.1 VMware Inc.
- 6.4.2 Microsoft Corp.
- 6.4.3 Dell Technologies
- 6.4.4 Cisco Systems
- 6.4.5 Hewlett Packard Enterprise
- 6.4.6 IBM Corp.
- 6.4.7 Huawei Technologies
- 6.4.8 Oracle Corp.
- 6.4.9 Citrix Systems
- 6.4.10 NEC Corp.
- 6.4.11 Nutanix Inc.
- 6.4.12 Amazon Web Services
- 6.4.13 Google Cloud Platform
- 6.4.14 Broadcom (VMware division)
- 6.4.15 Juniper Networks
- 6.4.16 Arista Networks
- 6.4.17 Red Hat (IBM)
- 6.4.18 Equinix Inc.
- 6.4.19 Lenovo Group
- 6.4.20 Rackspace Technology
7 MARKET OPPORTUNITIES AND FUTURE OUTLOOK
- 7.1 White-space and Unmet-need Assessment

 全球軟體定義資料中心市場(至 2031 年):依軟體定義運算、軟體定義儲存、軟體定義網路和自動化分類
 2026年全球軟體定義資料中心市場報告
 軟體定義資料中心市場:按元件、資料中心類型、應用領域、最終使用者類型、產業和部署方式分類-全球預測,2026-2032年
 軟體定義資料中心 (SDDC) 市場規模、佔有率、成長率和全球產業分析:按類型、應用和地區分類的洞察,2026-2034 年預測
 軟體定義資料中心市場分析及預測(至 2035 年):按類型、產品類型、服務、技術、組件、應用、部署類型、最終用戶和解決方案分類
 軟體定義資料中心市場 - 全球產業規模、佔有率、趨勢、機會及預測(按組件、類型、部署方式、垂直產業、地區和競爭格局分類),2021-2031年
 2026-2030年全球軟體定義資料中心(SDDC)市場
 軟體定義資料中心市場規模、佔有率和成長分析(按組件、部署模式、企業規模、垂直產業和地區分類)-2026年至2033年產業預測
 軟體定義資料中心市場機會、成長動力、產業趨勢分析及 2025 - 2034 年預測
 全球軟體定義資料中心(SDDC)市場:依產品、組織規模、最終用戶產業、地區、機會和預測,2018-2032