


 |
市場調查報告書
商品編碼
2114084
模擬軟體:市場佔有率分析、產業趨勢與統計、成長預測(2026-2031)Simulation Software - Market Share Analysis, Industry Trends & Statistics, Growth Forecasts (2026 - 2031) |
||||||

※ 本網頁內容可能與最新版本有所差異。詳細情況請與我們聯繫。
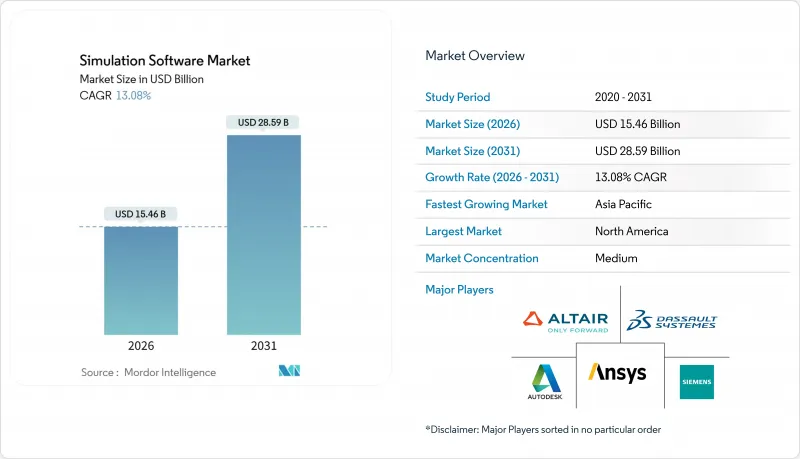
據 Mordor Intelligence 稱,2026 年模擬軟體市場價值 154.6 億美元,預計到 2031 年將達到 285.9 億美元,年複合成長率為 13.08%。
本報告按部署類型(本地部署、雲端/SaaS)、最終用戶產業(汽車、航太與國防、電氣與電子、能源、石油與採礦等)、模擬類型(有限元素分析、運算流體動力學、多體動力學等)、應用領域(產品設計、研發等)、組件(許可、服務、平台)和地區進行細分。市場預測以美元計價。
全球模擬軟體市場趨勢與洞察
雲原生模擬技術的廣泛應用
2025年,隨著訂閱模式取代永久許可,並消除了初始硬體投資的需求,企業加速了將求解器工作負載遷移到公共雲端的進程。 Ansys在亞馬遜雲端服務(AWS)Graviton處理器上進行的基準測試表明,計算流體力學(CFD)執行時間縮短了30%,每小時成本也隨之降低,即使在短週期設計迭代中,彈性運算也成為可能。西門子擴展了其「Xcelerator as a Service」(加速器即服務)產品目錄,使中型製造商無需維護本地叢集即可存取有限元素方法和多體求解器。 Gartner報告稱,2025年售出的新模擬許可證中有40%將以SaaS(軟體即服務)形式提供,高於2023年的28%。這項轉變將使先前依賴外包的中小型企業更容易獲得高精度物理仿真,並使大型成熟企業能夠在不累積閒置資源的情況下處理尖峰時段工作負載。儘管雲端運算的採用仍然面臨著諸如對外通訊費用和資料主權法規等挑戰,但考慮到未來的價格趨勢,超大規模的使用對於迭代設計是有利的。
汽車產業對虛擬檢驗的需求
隨著虛擬測試平台的日益成熟,汽車製造商已減少了實體碰撞測試原型車的數量。沃爾沃宣布,在利用有限元素方法結合歷史數據校準其乘員安全模型後,到2025年,其電動平台所需的物理碰撞測試原型車數量將減少60%。美國汽車工程師協會(SAE)的新標準意味著監管機構現在接受關於電池熱失控的模擬結果,從而將型式認證的成本轉移到軟體開發的早期階段。 MathWorks已將高解析度電池電化學模型添加到Simulink中,從而能夠在典型的設計週期內預測10年的劣化。隨著電動車平台的日益普及,工程團隊現在每個專案運行超過10萬個虛擬場景,以評估減重、碰撞安全性能和續航里程之間的權衡。這種虛擬化技術減少了模具返工,加快了產品上市速度,並降低了保固風險。
高效能運算基礎設施的總擁有成本高
到2025年,NVIDIA H100的單價將超過3萬美元,而配備64個GPU的碰撞分析機架,以德國工業電費,每年的電費約為9萬美元。這些經濟因素使得中型供應商對擴展虛擬檢驗持謹慎態度。雖然雲端的突發容量降低了准入門檻,但對於始終線上運作而言,其成本可能在一年後超過本地部署解決方案的折舊成本。因此,許多公司採用混合環境,將本地叢集用於穩定的熱分析,並使用雲端資源的突發功能來應對尖峰時段空氣動力學分析。由於缺乏補貼和共用設施,不斷飆升的價格限制了數位孿生技術的廣泛應用,使得中小型製造商仍然深陷於傳統的「設計、製造、測試」循環之中。
細分市場分析
從以金額為準來看,到2025年,本地部署環境將佔總收入的60.11%,主要得益於汽車和國防相關企業將智慧財產權保護在防火牆內。與雲端和SaaS產品相關的模擬軟體市場正以13.22%的複合年成長率成長,超過了整體市場的成長軌跡,這主要得益於中型企業用戶為應對尖峰時段工作負載而採用訂閱模式。西門子在2025年新增了1,200家雲端客戶,這清楚地表明,彈性運算正在為那些沒有傳統高效能運算預算的公司開闢新的可能性。
混合拓樸結構十分常見。穩定的碰撞測試套件運行在本地叢集上,而瞬態熱分析則在設計衝刺期間以突發方式發送到公共雲端。編配的複雜性和資料傳輸延遲仍然限制了工作負載的真正可攜性,但在需求波動的情況下,雲端的價格優勢更為明顯。在整個預測期內,SaaS 收入預計將佔成長的大部分,但在需要計算主權的出口管制地區,對本地解決方案的剩餘需求仍將持續存在。
預計到2025年,汽車產業將佔模擬軟體市場總收入的28.32%。這主要得益於電動車碰撞模擬、自動駕駛感應器融合以及輕量化車身白車身分析等應用。同時,醫療保健和生命科學產業預計到2031年將以13.58%的複合年成長率成長,這主要得益於In Silico測試降低了動物試驗成本,以及在不斷變化的FDA指導方針下醫療設備核准流程加快。
製藥公司正在利用生理藥物動力學模型在實驗室驗證前篩檢候選藥物,而醫療設備製造商則在In Silico中檢驗植入的耐久性,以縮短法規核准週期。除了這兩個領域,航太產業對空氣動力學和輻射研究的需求也十分強勁,而電子產品製造商則利用熱分析求解器來抑制晶片級熱點。通訊產業的活躍提升也帶動了模擬軟體產業的活性化,因為電信業者正在使用虛擬網路模擬器來設計5G開放式無線存取網(Open RAN)部署。
區域分析
北美地區主要由大型航太公司、底特律周邊汽車產業中心以及矽谷的半導體設計公司所支撐,預計到2025年將佔全球銷售額的36.46%。該地區模擬軟體市場的規模得益於SaaS的早期應用和成熟的雲端管治架構。歐洲緊隨其後,其發展動力主要來自汽車電氣化法規和企業永續性報告指令(CSRD),這些法規推動了全生命週期環境模擬的發展。德國、法國和英國是需求中心,西門子和達梭系統等當地大型企業為其提供了支援。
亞太地區是成長的主要驅動力,預計到2031年將以14.60%的複合年成長率成長。中國工業和資訊化部正在津貼中小型製造企業採用數位孿生技術,而印度工程服務供應商則向全球客戶提供模擬人才庫。日本正著力推進工業4.0工廠建模,韓國半導體巨頭則在加強熱場和電磁場分析,以滿足人工智慧晶片的性能標準。東南亞國家,尤其是越南和泰國,正在吸引電子和汽車組裝,離散事件模擬技術也正被納入工廠佈局決策中。
在南美洲和中東,高效能運算技術的應用進展緩慢,主要集中在巴西的航太業和海灣國家的大型企劃。非洲的需求主要集中在南非的採礦業和汽車業,但高效能運算資源的匱乏是一大障礙。除這三大叢集之外,其他地區的普及程度將取決於雲端運算成本的趨勢以及能夠彌補仿真專業知識缺口的大學課程設定。
其他好處:
- Excel格式的市場預測(ME)表
- 3個月的分析師支持
目錄
第1章:引言
- 研究假設和市場定義
- 調查範圍
第2章:調查方法
第3章執行摘要
第4章 市場狀況
- 市場概覽
- 市場促進因素
- 雲原生模擬技術的廣泛應用
- 汽車產業對虛擬檢驗的需求
- 數位孿生舉措的迅速普及
- AI驅動的生成式模擬工作流程
- 基於ESG要求的虛擬永續性評估
- 測試 5G、開放式無線接取網路 (Open RAN) 和網路功能虛擬化 (NFV)
- 市場限制因素
- 高效能運算基礎設施的總擁有成本高
- 數據互通性和標準化之間的差距
- 雲端外包中的智慧財產權 (IP) 安全問題
- 垂直領域模擬人才短缺
- 產業價值鏈分析
- 監理情勢
- 技術展望
- 宏觀經濟因素對市場的影響
- 波特五力分析
第5章 市場規模與成長預測
- 依部署類型
- 現場
- 雲/SaaS
- 按最終用戶行業分類
- 車
- 航太/國防
- 電氣和電子設備
- 能源、石油、採礦
- 資訊科技/通訊
- 醫療保健和生命科學
- 教育/研究
- 其他終端用戶產業
- 按模擬類型
- 有限元素分析(FEA)
- 計算流體力學(CFD)
- 多體運動與動力學
- 離散事件模擬與製程仿真
- 電磁波和射頻
- 系統級和一維
- 按應用程式字段
- 產品設計與工程
- 研究與開發/創新
- 流程和業務最佳化
- 培訓、安全措施、數位模型
- 數位孿生生命週期管理
- 按組件
- 軟體許可
- 服務和諮詢
- 平台與整合
- 按地區
- 北美洲
- 美國
- 加拿大
- 墨西哥
- 南美洲
- 巴西
- 阿根廷
- 其他南美國家
- 歐洲
- 德國
- 英國
- 法國
- 義大利
- 荷蘭
- 俄羅斯
- 其他歐洲國家
- 亞太地區
- 中國
- 日本
- 印度
- 韓國
- ASEAN
- 其他亞太國家
- 中東
- 阿拉伯聯合大公國
- 沙烏地阿拉伯
- 其他中東國家
- 非洲
- 南非
- 奈及利亞
- 其他非洲國家
- 北美洲
第6章 競爭情勢
- 市場集中度
- 策略趨勢
- 市佔率分析
- 公司簡介
- Ansys, Inc.
- Dassault Systemes SE
- Siemens Digital Industries Software Inc.
- Altair Engineering Inc.
- Autodesk, Inc.
- MSC Software Corporation
- The MathWorks, Inc.
- PTC Inc.
- Synopsys, Inc.
- ESI Group SA
- CPFD Software, LLC
- Rockwell Automation, Inc.
- Bentley Systems, Incorporated
- Simio, LLC
- Lanner Group Ltd
- SIMUL8 Corporation
- Flow Science, Inc.
- COMSOL AB
- Schneider Electric SE
- SolidWorks Corporation
第7章 市場機會與未來展望
According to Mordor Intelligence, the simulation software market size is valued at USD 15.46 billion in 2026 and is projected to reach USD 28.59 billion by 2031, advancing at a 13.08% CAGR.
This report is Segmented by Deployment Type (On-Premise, and Cloud/SaaS), End-User Industry (Automotive, Aerospace and Defense, Electrical and Electronics, Energy/Oil/Mining, and More), Simulation Type (FEA, CFD, Multibody, and More), Application Area (Product Design, R&D, and More), Component (Licenses, Services, and Platform), and Geography. Market Forecasts are Provided in Terms of Value (USD).
Global Simulation Software Market Trends and Insights
Rising Cloud-Native Simulation Adoption
Enterprises accelerated the lift-and-shift of solver workloads to public clouds during 2025 as subscription pricing replaced perpetual licenses, eliminating upfront hardware capital. Ansys benchmarks on Amazon Web Services Graviton processors cut computational fluid dynamics runtimes by 30% and reduced hourly costs, making elastic compute viable for short design sprints. Siemens broadened its Xcelerator as a Service catalogue, giving mid-market manufacturers access to finite-element and multibody solvers without maintaining on-premises clusters. Gartner reported that 40% of new simulation seats sold in 2025 used SaaS delivery, up from 28% in 2023. The switch democratizes high-fidelity physics for smaller firms that previously relied on outsourced engineering, and it allows large incumbents to burst peak workloads without idle capacity. Cloud adoption still contends with egress fees and data-sovereignty rules, but forward pricing curves favour hyperscale usage for iterative design.
Automotive Demand for Virtual Validation
Original equipment manufacturers trimmed physical crash prototypes as virtual test benches matured. Volvo disclosed a 60% reduction in physical crash builds for its 2025 electric platform after calibrating finite-element occupant safety models against historical data. New Society of Automotive Engineers norms let regulators accept simulation results for battery thermal runaway, shifting homologation cost upstream to software. MathWorks enhanced Simulink with high-resolution electrochemical battery models, enabling 10-year degradation forecasts within normal design windows. As electric-vehicle platforms proliferate, engineering teams now run more than 100,000 virtual scenarios per program to evaluate lightweighting, crashworthiness, and range trade-offs. This virtualization trims tooling rework, accelerates launches, and squeezes warranty risk.
High Total Cost of Ownership for HPC Infrastructure
NVIDIA H100 units listed above USD 30,000 in 2025, and a 64-GPU crash-analysis rack consumed roughly USD 90,000 in annual electricity at German industrial tariffs. Such economics deter mid-tier suppliers from scaling virtual validation. Cloud burst capacity lowers entry hurdles, but always-on workloads can outstrip on-premises amortization after the first year. Many firms therefore operate hybrid estates, reserving internal clusters for steady thermal analysis and bursting to cloud for peak aerodynamics studies. Without subsidies or shared facilities, price shock keeps smaller manufacturers on legacy design-build-test loops and limits the diffusion of digital-twin practices.
Other drivers and restraints analyzed in the detailed report include:
- Rapid Uptake of Digital-Twin Initiatives
- AI-Driven Generative Simulation Workflows
- Data Interoperability and Standards Gaps
For complete list of drivers and restraints, kindly check the Table Of Contents.
Segment Analysis
In value terms, on-premises estates accounted for 60.11% of 2025 revenue, driven by automotive and defense firms that keep intellectual property behind firewalls. The simulation software market size tied to cloud and SaaS delivery is advancing at a 13.22% CAGR, faster than the overall trajectory, as mid-market users adopt subscription models for peak workloads. Siemens added 1,200 new cloud customers in 2025, highlighting how elastic compute opens doors for companies without traditional HPC budgets.
Hybrid topologies are common: steady crash suites run on internal clusters, while transient thermal studies burst to public clouds during design sprints. Orchestration complexity and data-transfer latency still limit true workload portability, yet pricing curves favour cloud for variable demand. Over the forecast horizon, SaaS revenue should account for the majority of incremental gains, though on-premises residuals will persist in export-controlled domains where compute sovereignty is required.
Automotive accounted for 28.32% of 2025 revenue in the simulation software market, powered by electric-vehicle crash simulations, autonomous-driving sensor fusion, and lightweight body-in-white analysis. Healthcare and life sciences, however, are projected to grow at a 13.58% CAGR through 2031 as in-silico trials reduce animal testing costs and accelerate device approvals under evolving FDA guidance.
Pharma companies employ physiologically based pharmacokinetic models to screen candidates before wet labs, and medical-device firms validate implant durability in silico to shorten regulatory cycles. Outside these two verticals, aerospace retains steady demand for aerodynamic and radiation studies, while electronics manufacturers use thermal solvers to contain chip-level hotspots. The simulation software industry also benefits from rising telecom activity as operators design 5G Open RAN rollouts with virtual network emulators.
Complete Report Scope:
- By Deployment Type
- On-Premise
- Cloud / SaaS
- By End-User Industry
- Automotive
- Aerospace and Defense
- Electrical and Electronics
- Energy, Oil and Mining
- IT and Telecom
- Healthcare and Life Sciences
- Education and Research
- Other End-User Industries
- By Simulation Type
- Finite-Element Analysis (FEA)
- Computational Fluid Dynamics (CFD)
- Multibody and Dynamics
- Discrete-Event and Process Simulation
- Electromagnetic and RF
- System-Level and 1-D
- By Application Area
- Product Design and Engineering
- Research and Development / Innovation
- Process and Operations Optimization
- Training, Safety and Digital Mock-Up
- Digital Twin Lifecycle Management
- By Component
- Software Licences
- Services and Consulting
- Platform and Integration
- By Geography
- North America
- United States
- Canada
- Mexico
- South America
- Brazil
- Argentina
- Rest of South America
- Europe
- Germany
- United Kingdom
- France
- Italy
- Netherlands
- Russia
- Rest of Europe
- Asia Pacific
- China
- Japan
- India
- South Korea
- ASEAN
- Rest of Asia Pacific
- Middle East
- United Arab Emirates
- Saudi Arabia
- Rest of Middle East
- Africa
- South Africa
- Nigeria
- Rest of Africa
- North America
Geography Analysis
North America retained 36.46% of 2025 revenue, bolstered by aerospace primes, Detroit-area automotive hubs, and Silicon Valley chip designers. The simulation software market size across the region benefits from early SaaS uptake and mature cloud governance frameworks. Europe follows closely, driven by automotive electrification mandates and the Corporate Sustainability Reporting Directive that pushes lifecycle environmental simulation. Germany, France, and the United Kingdom anchor demand, aided by local champions Siemens and Dassault Systemes.
Asia Pacific is the growth engine, scaling at a 14.60% CAGR through 2031. China's Ministry of Industry and Information Technology subsidizes digital twins among small manufacturers, while India's engineering-services providers extend simulation talent pools to global clients. Japan focuses on Industry 4.0 factory modelling, and South Korea's semiconductor majors intensify thermal and electromagnetic analysis to meet AI chip performance thresholds. Southeast Asian nations, led by Vietnam and Thailand, attract electronics and automotive assembly lines that now embed discrete-event simulation into plant layout decisions.
South America and the Middle East show modest uptake centered on Brazilian aerospace and Gulf infrastructure megaprojects. African demand is concentrated in South African mining and automotive, hindered by limited HPC access. Overall uptake outside the tri-polar clusters depends on cloud cost curves and university curricula that can replenish scarce simulation expertise.
- Ansys, Inc.
- Dassault Systemes SE
- Siemens Digital Industries Software Inc.
- Altair Engineering Inc.
- Autodesk, Inc.
- MSC Software Corporation
- The MathWorks, Inc.
- PTC Inc.
- Synopsys, Inc.
- ESI Group SA
- CPFD Software, LLC
- Rockwell Automation, Inc.
- Bentley Systems, Incorporated
- Simio, LLC
- Lanner Group Ltd
- SIMUL8 Corporation
- Flow Science, Inc.
- COMSOL AB
- Schneider Electric SE
- SolidWorks Corporation
Additional Benefits:
- The market estimate (ME) sheet in Excel format
- 3 months of analyst support
TABLE OF CONTENTS
1 INTRODUCTION
- 1.1 Study Assumptions and Market Definition
- 1.2 Scope of the Study
2 RESEARCH METHODOLOGY
3 EXECUTIVE SUMMARY
4 MARKET LANDSCAPE
- 4.1 Market Overview
- 4.2 Market Drivers
- 4.2.1 Rising Cloud-Native Simulation Adoption
- 4.2.2 Automotive Demand for Virtual Validation
- 4.2.3 Rapid Uptake of Digital-Twin Initiatives
- 4.2.4 AI-Driven Generative Simulation Workflows
- 4.2.5 ESG-Mandated Virtual Sustainability Assessments
- 4.2.6 5G, Open RAN Network-Function Virtualization Testing
- 4.3 Market Restraints
- 4.3.1 High Total Cost of Ownership for HPC Infrastructure
- 4.3.2 Data Interoperability and Standards Gaps
- 4.3.3 IP Security Concerns in Cloud Outsourcing
- 4.3.4 Scarcity of Vertical-Domain Simulation Talent
- 4.4 Industry Value-Chain Analysis
- 4.5 Regulatory Landscape
- 4.6 Technological Outlook
- 4.7 Impact of Macroeconomic Factors on the Market
- 4.8 Porter's Five Forces Analysis
- 4.8.1 Threat of New Entrants
- 4.8.2 Bargaining Power of Buyers
- 4.8.3 Bargaining Power of Suppliers
- 4.8.4 Threat of Substitutes
- 4.8.5 Intensity of Competitive Rivalry
5 MARKET SIZE AND GROWTH FORECASTS (VALUE)
- 5.1 By Deployment Type
- 5.1.1 On-Premise
- 5.1.2 Cloud / SaaS
- 5.2 By End-User Industry
- 5.2.1 Automotive
- 5.2.2 Aerospace and Defense
- 5.2.3 Electrical and Electronics
- 5.2.4 Energy, Oil and Mining
- 5.2.5 IT and Telecom
- 5.2.6 Healthcare and Life Sciences
- 5.2.7 Education and Research
- 5.2.8 Other End-User Industries
- 5.3 By Simulation Type
- 5.3.1 Finite-Element Analysis (FEA)
- 5.3.2 Computational Fluid Dynamics (CFD)
- 5.3.3 Multibody and Dynamics
- 5.3.4 Discrete-Event and Process Simulation
- 5.3.5 Electromagnetic and RF
- 5.3.6 System-Level and 1-D
- 5.4 By Application Area
- 5.4.1 Product Design and Engineering
- 5.4.2 Research and Development / Innovation
- 5.4.3 Process and Operations Optimization
- 5.4.4 Training, Safety and Digital Mock-Up
- 5.4.5 Digital Twin Lifecycle Management
- 5.5 By Component
- 5.5.1 Software Licences
- 5.5.2 Services and Consulting
- 5.5.3 Platform and Integration
- 5.6 By Geography
- 5.6.1 North America
- 5.6.1.1 United States
- 5.6.1.2 Canada
- 5.6.1.3 Mexico
- 5.6.2 South America
- 5.6.2.1 Brazil
- 5.6.2.2 Argentina
- 5.6.2.3 Rest of South America
- 5.6.3 Europe
- 5.6.3.1 Germany
- 5.6.3.2 United Kingdom
- 5.6.3.3 France
- 5.6.3.4 Italy
- 5.6.3.5 Netherlands
- 5.6.3.6 Russia
- 5.6.3.7 Rest of Europe
- 5.6.4 Asia Pacific
- 5.6.4.1 China
- 5.6.4.2 Japan
- 5.6.4.3 India
- 5.6.4.4 South Korea
- 5.6.4.5 ASEAN
- 5.6.4.6 Rest of Asia Pacific
- 5.6.5 Middle East
- 5.6.5.1 United Arab Emirates
- 5.6.5.2 Saudi Arabia
- 5.6.5.3 Rest of Middle East
- 5.6.6 Africa
- 5.6.6.1 South Africa
- 5.6.6.2 Nigeria
- 5.6.6.3 Rest of Africa
- 5.6.1 North America
6 COMPETITIVE LANDSCAPE
- 6.1 Market Concentration
- 6.2 Strategic Moves
- 6.3 Market Share Analysis
- 6.4 Company Profiles (includes Global Level Overview, Market Level Overview, Core Segments, Financials as Available, Strategic Information, Market Rank/Share for Key Companies, Products and Services, and Recent Developments)
- 6.4.1 Ansys, Inc.
- 6.4.2 Dassault Systemes SE
- 6.4.3 Siemens Digital Industries Software Inc.
- 6.4.4 Altair Engineering Inc.
- 6.4.5 Autodesk, Inc.
- 6.4.6 MSC Software Corporation
- 6.4.7 The MathWorks, Inc.
- 6.4.8 PTC Inc.
- 6.4.9 Synopsys, Inc.
- 6.4.10 ESI Group SA
- 6.4.11 CPFD Software, LLC
- 6.4.12 Rockwell Automation, Inc.
- 6.4.13 Bentley Systems, Incorporated
- 6.4.14 Simio, LLC
- 6.4.15 Lanner Group Ltd
- 6.4.16 SIMUL8 Corporation
- 6.4.17 Flow Science, Inc.
- 6.4.18 COMSOL AB
- 6.4.19 Schneider Electric SE
- 6.4.20 SolidWorks Corporation
7 MARKET OPPORTUNITIES AND FUTURE OUTLOOK
- 7.1 White-Space and Unmet-Need Assessment

 全球模擬軟體市場規模、佔有率、趨勢和成長分析報告(2026-2034)
 電磁場模擬軟體:市場佔有率分析、產業趨勢與統計、成長預測(2026-2031)
 航太模擬軟體市場分析及預測(至2035年):依類型、產品、服務、技術、組件、應用、部署、最終用戶、功能及解決方案分類
 模擬軟體市場-2026-2032年全球市場預測
 2026-2030年全球模擬軟體市場
 全球電磁場模擬軟體市場:機會與策略展望(至2035年)2026年全球工作模擬市場報告2026年全球離散事件模擬軟體市場報告
 智慧工廠模擬軟體市場預測至2034年-按軟體類型、組件、企業規模、應用、最終用戶和地區分類的全球分析
 引擎聲音模擬晶片市場報告:趨勢、預測和競爭分析(至2035年)