


 |
市場調查報告書
商品編碼
2113950
汽車動力系統系統:市場佔有率分析、產業趨勢與統計、成長預測(2026-2031)Automotive Powertrain Systems - Market Share Analysis, Industry Trends & Statistics, Growth Forecasts (2026 - 2031) |
||||||

※ 本網頁內容可能與最新版本有所差異。詳細情況請與我們聯繫。
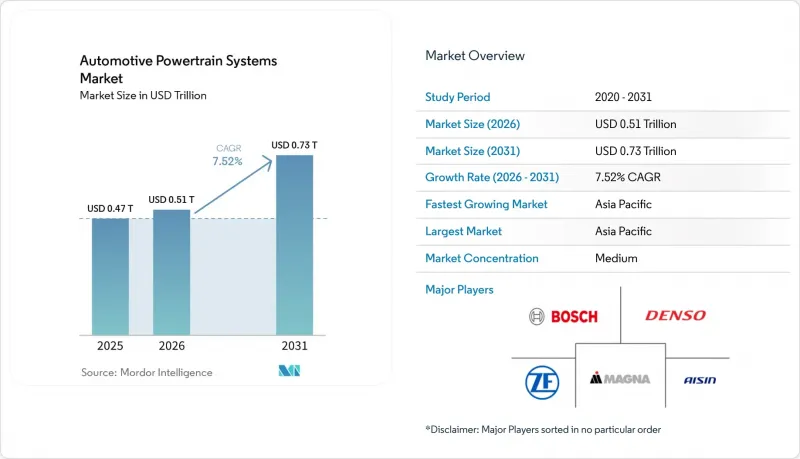
根據 Mordor Intelligence 預測,汽車動力系統系統市場將從 2025 年的 4,700 億美元成長到 2026 年的 5,100 億美元,然後在 2031 年達到 7,300 億美元,2026 年至 2031 年的複合年成長率為 7.52%。
本報告按零件(引擎、變速箱等)、動力類型(內燃機 (ICE)、電動車 (EV) 等)、驅動系統(前輪驅動 (FWD) 等)、車輛類型(乘用車、商用車)、銷售管道(OEM、售後市場)和地區進行細分。市場預測以價值(美元)和銷售(輛)為單位。
全球汽車動力系統系統市場趨勢及洞察
電池成本的快速下降正使價格親民的電動動力傳動系統成為現實。
2024年,電池組的平均價格比以往水準顯著下降。預計未來幾年價格將繼續走低。寧德時代和比亞迪等公司工廠的規模經濟效益,以及磷酸鐵鋰電池的普及(磷酸鋰鐵鋰電池能量密度幾乎與內燃機電池相當,但成本更低),使得電池式電動車(BEV)的總擁有成本下降速度超出預期,低於內燃機汽車(ICE)。電池組價格的下降使得高壓雙向充電設計成為可能,為車隊營運商創造了新的收入來源,他們可以將儲存的電力出售回電網。在交通繁忙的都市區道路上,商用純電動車的投資回收期已縮短至三年以內,加速了車隊的電氣化。
加強全球二氧化碳排放和燃油效率法規
歐洲、中國和美國部分州的監管機構正在實施更嚴格的車隊平均二氧化碳排放上限,迫使汽車製造商將電動動力傳動系統納入主流。歐盟7排放標準對所有汽車製造商註冊車輛的二氧化碳排放量徵收罰款,使得違規行為在經濟上難以承受。中國的雙軌制要求電動或混合動力汽車的銷量在2030年前達到一定水平,車牌號碼的分配與進展掛鉤,加速了國內品牌動力傳動系統的轉型。加州的「先進清潔汽車II」計畫將零排放目標擴展到中型卡車,迫使車主重新思考其車輛的生命週期。這些法規的協同效應正在縮小未來內燃機汽車的市場,並迫使供應商轉向大規模生產電動車橋。
供應鏈波動與關鍵礦產價格波動
2022年至2024年間,碳酸鋰價格波動劇烈。這些波動迫使電池製造商按季度調整合約條款,擾亂了成本預測。由於採礦業集中在智利、澳洲和中國,而中國又佔據了煉油產能的很大一部分,因此整車製造商(OEM)極易受到地緣政治衝擊的影響。福特汽車公司在密西根州投資35億美元興建煉油廠,旨在實現部分供應鏈的本地化,但預計該煉油廠的運作準備工作要到2026年才能完成,這將限制其短期緩解作用。
細分市場分析
隨著汽車製造商逐步縮減內燃機(ICE)項目,預計到2025年,引擎將佔汽車動力系統系統市場佔有率的41.63%,成為最大的細分市場。同時,「其他」類別(主要包括最終驅動器和緊湊型電驅動單元)預計將在2031年以9.43%的複合年成長率超越所有其他類別,這得益於整合電機-逆變器組件的優勢,該組件可減輕重量並組裝流程。變速箱市場佔有率正在下降,因為大多數純電動車僅需要單速減速齒輪,儘管對於需要在高速公路上提高燃油效率的40噸級卡車而言,多速變速箱正變得越來越重要。差速器供應商正在將其業務從機械式限滑離合器轉向電子控制和同步扭矩向量分配模組。
輕量化複合材料傳動軸和整合式振動感測器正在將曾經的被動元件轉變為用於預測性診斷的資料節點,這與前文所述的人工智慧驅動維護趨勢相符。隨著電力驅動技術的日益普及,在馬達繞組和功率模組方面均擁有專業知識的一級供應商正在獲得新的訂單,而純粹的機械專家則面臨利潤率下降的風險。整體而言,元件配置正朝著更小、更高價值的組件方向發展,其主導因素更多是電力電子智慧財產權(IP),而非機械加工技術。
到2025年,內燃機(ICE)系統將佔汽車銷量的78.28%,但隨著純電動車(BEV)的快速發展,到2031年這一比例可能會大幅下降,預計內燃機市場佔有率將逐年大幅減少。電動車(EV)市場預計將以10.18%的複合年成長率成長。電池動力傳輸系統將因電池組成本下降和排放氣體法規日益嚴格而顯著成長。
在充電基礎設施不發達的地區,插電式混合動力汽車扮演著過渡的角色。燃料電池電動車目前仍是小眾市場,主要集中在歐洲和加州等氫能走廊沿線的大型車隊。區域差異依然存在。中國計畫大幅提高插電式混合動力車在新車中的普及率,而印度和部分東協國家則繼續依賴最佳化符合歐盟6+排放標準的內燃機車,直到公共充電站的密度提高。
區域分析
預計到2025年,亞太地區將以48.86%的市佔率主導汽車動力系統系統市場,並在2031年之前維持7.94%的複合年成長率。中國的雙軌制和慷慨的電動車補貼正在提振國內需求和出口成長,而印度的快速部署和製造(FAME)獎勵正在推動商用車電氣化向二線城市擴展。日本正在完善其混合動力技術,韓國在電池創新方面表現出色,但它們的成長速度與中國的快速成長相比有所放緩。
在北美,《通貨膨脹削減法案》下的乾淨科技稅額扣抵正在促進本地電池供應鏈的發展,預計將顯著成長。商用車輛車隊受惠於聯邦政府的採購義務以及電力公司對充電樁的補貼,但由於農村地區基礎設施落後,個人純電動車的普及速度緩慢。墨西哥具有成本競爭力的零件工廠符合國內採購標準,並正在加強區域整合。
歐洲在汽車動力系統系統市場佔有重要佔有率,這得益於歐洲綠色協議提出的2050年氣候中和目標。德國豪華品牌正集中研發資源開發800伏架構,而東歐國家則因人事費用較低而吸引了許多組裝線。能源價格上漲和對亞洲電池進口的依賴帶來了經濟挑戰,但強制性回收可望創造二次利用和材料回收的機會,從而抵消這些成本不利因素。
其他好處:
- Excel格式的市場預測(ME)表
- 3個月的分析師支持
目錄
第1章:引言
- 研究假設和市場定義
- 調查範圍
第2章:調查方法
第3章執行摘要
第4章 市場狀況
- 市場概覽
- 市場促進因素
- 電池成本的快速下降正使價格親民的電動動力傳動系統成為現實。
- 加強全球二氧化碳排放和燃油效率法規
- 向專用電動車平台和各汽車製造商自主研發的電力驅動橋過渡(規模經濟)
- 強製商用車輛電氣化(最後一公里配送、重型卡車走廊)
- 低成本鈉離子電池的出現將開啟一個價格低於 10,000 美元的純電動車市場。
- 人工智慧驅動的預測性維護正在推高售後市場動力傳動系統相關支出。
- 市場限制因素
- 供應鏈波動與關鍵礦產價格波動
- OEM廠商的垂直整合給一級內燃機供應商的目標市場帶來了壓力。
- 長途卡車兆瓦級充電技術的引進進展緩慢。
- 新興市場消費者對電動車續航里程的擔憂減緩了純電動車的普及。
- 價值供應鏈分析
- 監理情勢
- 技術展望
- 波特五力模型
第5章 市場規模與成長預測
- 按組件
- 引擎
- 傳播
- 微分
- 驅動軸
- 其他(最終驅動、電力驅動單元)
- 依推進類型
- 內燃機(ICE)
- 電動車(EV)
- 混合動力(HEV/PHEV)
- 透過驅動系統
- 前輪驅動(FWD)
- 後輪驅動(RWD)
- 全輪驅動(AWD)
- 車輛類型
- 搭乘用車
- 商用車輛
- 按銷售管道
- OEM
- 售後市場
- 按地區
- 北美洲
- 美國
- 加拿大
- 其他北美國家
- 南美洲
- 巴西
- 阿根廷
- 其他南美國家
- 歐洲
- 德國
- 英國
- 法國
- 義大利
- 西班牙
- 其他歐洲國家
- 亞太地區
- 中國
- 印度
- 日本
- 韓國
- 其他亞太國家
- 中東和非洲
- 阿拉伯聯合大公國
- 沙烏地阿拉伯
- 南非
- 土耳其
- 其他中東和非洲國家
- 北美洲
第6章 競爭情勢
- 市場集中度
- 策略趨勢
- 市佔率分析
- 公司簡介
- Robert Bosch GmbH
- Denso Corporation
- ZF Friedrichshafen AG
- Magna International Inc.
- Aisin Corporation
- BorgWarner Inc.
- Vitesco Technologies Group AG(Continental AG)
- Hyundai Transys
- Schaeffler AG
- GKN Automotive
- Allison Transmission, Inc.
- Dana Incorporated
- Valeo SA
- JTEKT Corporation
- Cummins Inc.
- Mahle GmbH
- BYD Auto Co., Ltd.
- Tesla, Inc.
第7章 市場機會與未來展望
According to Mordor Intelligence, the automotive powertrain systems market size is expected to grow from USD 0.47 trillion in 2025 to USD 0.51 trillion in 2026 and is forecast to reach USD 0.73 trillion by 2031 at 7.52% CAGR over 2026-2031.
This report is Segmented by Component (Engine, Transmission, and More), Propulsion Type (Internal Combustion Engine (ICE), Electric Vehicle (EV), and More), Drive Type (Front-Wheel Drive (FWD), and More), Vehicle Type (Passenger Vehicles, Commercial Vehicles), Sales Channel (OEM, Aftermarket), and Geography. The Market Forecasts are Provided in Value (USD) and Volume (Units).
Global Automotive Powertrain Systems Market Trends and Insights
Rapid Battery-Cost Decline Enabling Affordable E-Powertrains
In 2024, average battery pack prices experienced a significant decline compared to earlier levels. Projections suggest prices will continue to decrease in the coming years. Scale advantages at plants operated by CATL and BYD, plus lithium-iron-phosphate chemistries that deliver near-par energy density at lower cost, help battery-electric vehicles (BEVs) undercut ICE total-cost-of-ownership earlier than forecast. Lower pack prices enable high-voltage, bi-directional charging designs that create new revenue streams for fleet operators who can resell stored energy to the grid. Commercial BEV payback periods now fall inside three years on high-utilization city routes, speeding fleet conversion.
Tightening Global CO2 and Fuel-Economy Regulations
Regulators in Europe, China, and select states in the United States are enforcing stricter fleet-average CO2 caps that push automakers to mainstream electric powertrains. The Euro 7 framework imposes fines for CO2 on every vehicle an OEM registers, making non-compliance financially untenable . China's dual-credit scheme requires a notable share of electric or hybrid sales by 2030 and ties license-plate quotas to progress, accelerating powertrain shifts among domestic brands. California's Advanced Clean Cars II program extends zero-emission targets to medium-duty trucks, compelling fleet operators to re-evaluate asset lifecycles. These converging rules shrink the addressable market for future ICE launches and compel suppliers to retool for high-volume e-axle production.
Critical-Mineral Supply-Chain Volatility and Price Swings
Between 2022 and 2024, lithium carbonate prices experienced significant fluctuations. This volatility compelled battery makers to adjust their contracts quarterly, disrupting their cost forecasts. Mining concentration in Chile, Australia, and China, plus a significant Chinese share of refining capacity, exposes OEMs to geopolitical shocks. Ford's USD 3.5 billion investment in Michigan refining aims to localize a slice of the chain, yet start-up timelines stretch to 2026, limiting short-term relief.
Other drivers and restraints analyzed in the detailed report include:
- OEM Pivot to Dedicated EV Platforms and In-House E-Axles (Scale Economics)
- Commercial-Fleet Electrification Mandates (Last-Mile, HD-Truck Corridors)
- OEM Vertical-Integration Squeezing Tier-1 ICE Suppliers' Addressable Market
For complete list of drivers and restraints, kindly check the Table Of Contents.
Segment Analysis
Engines generated the largest slice of the automotive powertrain systems market size with 41.63% share in 2025, as automakers wind down fresh ICE programs. Conversely, the "Others" basket-chiefly final drives and compact e-drive units-will outpace all peers at a 9.43% CAGR through 2031, taking advantage of integrated motor-inverter packages that cut weight and assembly steps. Transmissions cede share because most BEVs require a single reduction gear, although multi-speed boxes gain relevance for 40-ton trucks seeking highway efficiency. Differential suppliers pivot to electronic torque-vectoring modules synced with software controls rather than mechanical, limited-slip clutches .
Lightweight composite drive shafts and embedded vibration sensors turn once-passive parts into data nodes for predictive diagnostics, harmonizing with the AI-maintenance driver outlined earlier. As e-drive uptake scales, Tier-1 firms with both motor winding and power-module competencies win new-business awards, while pure mechanical specialists risk margin erosion. Overall, the component mix migrates toward fewer, higher-value assemblies governed by power-electronics IP rather than machining know-how.
ICE systems still represent 78.28% of 2025 revenue but might decline significantly by 2031, losing notable percentage points of share annually as BEVs sprint ahead. The electric vehicle segment is projected to expand at a 10.18% CAGR. Battery-electric powertrains achieve notable growth because falling pack costs intersect with punitive emissions penalties.
Plug-in hybrids act as transitional bridges in regions where charging infrastructure lags. Fuel-cell electric vehicles remain niche, limited to heavy-duty fleets along hydrogen corridors in Europe and California. Regional splits persist: China aims to significantly increase the adoption of plug-in vehicles among new cars, whereas India and parts of ASEAN still rely on Euro 6-plus ICE optimizations until public charging density improves.
Complete Report Scope:
- By Component
- Engine
- Transmission
- Differentials
- Drive Shafts
- Others (Final Drive, E-Drive Unit)
- By Propulsion Type
- Internal Combustion Engine (ICE)
- Electric Vehicle (EV)
- Hybrid (HEV/PHEV)
- By Drive Type
- Front-Wheel Drive (FWD)
- Rear-Wheel Drive (RWD)
- All-Wheel Drive (AWD)
- By Vehicle Type
- Passenger Vehicles
- Commercial Vehicles
- By Sales Channel
- OEM
- Aftermarket
- By Geography
- North America
- United States
- Canada
- Rest of North America
- South America
- Brazil
- Argentina
- Rest of South America
- Europe
- Germany
- United Kingdom
- France
- Italy
- Spain
- Rest of Europe
- Asia-Pacific
- China
- India
- Japan
- South Korea
- Rest of Asia-Pacific
- Middle East and Africa
- United Arab Emirates
- Saudi Arabia
- South Africa
- Turkey
- Rest of Middle East and Africa
- North America
Geography Analysis
The Asia-Pacific dominated the automotive powertrain systems market with a 48.86% share in 2025 and is expected to maintain an 7.94% CAGR to 2031. China's dual-credit program and generous EV subsidies spur domestic demand and export expansion, while India's Faster Adoption and Manufacturing of Electric Vehicles (FAME) incentives extend commercial-vehicle electrification to tier-2 cities. Japan refines hybrid technologies, and South Korea excels in battery innovation, though growth slows relative to China's surge.
North America registers significant growth, buoyed by the Inflation Reduction Act's clean-technology credits that encourage localized battery supply chains . Commercial fleets benefit from federal procurement mandates and utility rebates for depot chargers, yet sparse rural infrastructure tempers private BEV adoption. Mexico's cost-competitive parts plants satisfy domestic-content thresholds, reinforcing regional integration.
Europe leverages the European Green Deal's 2050 climate neutrality aims to maintain a sizeable piece of the automotive powertrain systems market. Germany's premium brands channel R&D into 800-volt architectures, while Eastern European nations attract final-assembly lines seeking lower labor expenses. High energy prices and reliance on Asian battery imports challenge economics, but recycling mandates spawn secondary-use and material-recovery ventures that may offset cost headwinds.
- Robert Bosch GmbH
- Denso Corporation
- ZF Friedrichshafen AG
- Magna International Inc.
- Aisin Corporation
- BorgWarner Inc.
- Vitesco Technologies Group AG (Continental AG)
- Hyundai Transys
- Schaeffler AG
- GKN Automotive
- Allison Transmission, Inc.
- Dana Incorporated
- Valeo SA
- JTEKT Corporation
- Cummins Inc.
- Mahle GmbH
- BYD Auto Co., Ltd.
- Tesla, Inc.
Additional Benefits:
- The market estimate (ME) sheet in Excel format
- 3 months of analyst support
TABLE OF CONTENTS
1 Introduction
- 1.1 Study Assumptions & Market Definition
- 1.2 Scope of the Study
2 Research Methodology
3 Executive Summary
4 Market Landscape
- 4.1 Market Overview
- 4.2 Market Drivers
- 4.2.1 Rapid Battery-Cost Decline Enabling Affordable E-Powertrains
- 4.2.2 Tightening Global CO2 and Fuel-Economy Regulations
- 4.2.3 OEM Pivot to Dedicated EV Platforms and In-House E-Axles (Scale Economics)
- 4.2.4 Commercial-Fleet Electrification Mandates (Last-Mile, HD-Truck Corridors)
- 4.2.5 Emergence of Low-Cost Sodium-Ion Batteries Opening Sub-USD 10k BEV Segment
- 4.2.6 AI-Driven Predictive Maintenance Boosting Aftermarket Powertrain Spend
- 4.3 Market Restraints
- 4.3.1 Critical-Mineral Supply-Chain Volatility and Price Swings
- 4.3.2 OEM Vertical-Integration Squeezing Tier-1 ICE Suppliers' Addressable Market
- 4.3.3 Slow Roll-Out of Megawatt Charging for Long-Haul Trucks
- 4.3.4 Consumer "Range-Anxiety" in Emerging Markets Delaying BEV Adoption
- 4.4 Value / Supply-Chain Analysis
- 4.5 Regulatory Landscape
- 4.6 Technological Outlook
- 4.7 Porter's Five Forces
- 4.7.1 Threat of New Entrants
- 4.7.2 Bargaining Power of Suppliers
- 4.7.3 Bargaining Power of Buyers
- 4.7.4 Threat of Substitutes
- 4.7.5 Competitive Rivalry
5 Market Size & Growth Forecasts (Value & Volume)
- 5.1 By Component
- 5.1.1 Engine
- 5.1.2 Transmission
- 5.1.3 Differentials
- 5.1.4 Drive Shafts
- 5.1.5 Others (Final Drive, E-Drive Unit)
- 5.2 By Propulsion Type
- 5.2.1 Internal Combustion Engine (ICE)
- 5.2.2 Electric Vehicle (EV)
- 5.2.3 Hybrid (HEV/PHEV)
- 5.3 By Drive Type
- 5.3.1 Front-Wheel Drive (FWD)
- 5.3.2 Rear-Wheel Drive (RWD)
- 5.3.3 All-Wheel Drive (AWD)
- 5.4 By Vehicle Type
- 5.4.1 Passenger Vehicles
- 5.4.2 Commercial Vehicles
- 5.5 By Sales Channel
- 5.5.1 OEM
- 5.5.2 Aftermarket
- 5.6 By Geography
- 5.6.1 North America
- 5.6.1.1 United States
- 5.6.1.2 Canada
- 5.6.1.3 Rest of North America
- 5.6.2 South America
- 5.6.2.1 Brazil
- 5.6.2.2 Argentina
- 5.6.2.3 Rest of South America
- 5.6.3 Europe
- 5.6.3.1 Germany
- 5.6.3.2 United Kingdom
- 5.6.3.3 France
- 5.6.3.4 Italy
- 5.6.3.5 Spain
- 5.6.3.6 Rest of Europe
- 5.6.4 Asia-Pacific
- 5.6.4.1 China
- 5.6.4.2 India
- 5.6.4.3 Japan
- 5.6.4.4 South Korea
- 5.6.4.5 Rest of Asia-Pacific
- 5.6.5 Middle East and Africa
- 5.6.5.1 United Arab Emirates
- 5.6.5.2 Saudi Arabia
- 5.6.5.3 South Africa
- 5.6.5.4 Turkey
- 5.6.5.5 Rest of Middle East and Africa
- 5.6.1 North America
6 Competitive Landscape
- 6.1 Market Concentration
- 6.2 Strategic Moves
- 6.3 Market Share Analysis
- 6.4 Company Profiles (includes Global Level Overview, Market Level Overview, Core Segments, Financials as Available, Strategic Information, Market Rank/Share for Key Companies, Products and Services, SWOT Analysis, and Recent Developments)
- 6.4.1 Robert Bosch GmbH
- 6.4.2 Denso Corporation
- 6.4.3 ZF Friedrichshafen AG
- 6.4.4 Magna International Inc.
- 6.4.5 Aisin Corporation
- 6.4.6 BorgWarner Inc.
- 6.4.7 Vitesco Technologies Group AG (Continental AG)
- 6.4.8 Hyundai Transys
- 6.4.9 Schaeffler AG
- 6.4.10 GKN Automotive
- 6.4.11 Allison Transmission, Inc.
- 6.4.12 Dana Incorporated
- 6.4.13 Valeo SA
- 6.4.14 JTEKT Corporation
- 6.4.15 Cummins Inc.
- 6.4.16 Mahle GmbH
- 6.4.17 BYD Auto Co., Ltd.
- 6.4.18 Tesla, Inc.
7 Market Opportunities & Future Outlook
- 7.1 White-Space & Unmet-Need Assessment

 電動汽車動力系統系統市場:全球市場預測,2026-2032年
 2026年全球汽車動力系統市場報告汽車動力傳動系統市場:2026-2032年全球市場預測(依動力傳動系統類型、車型、變速箱類型、車輛類型和應用分類)汽車動力傳動系統測試市場:依動力傳動系統類型、設備類型、測試類型、最終用戶和車輛型號分類-2026-2032年全球市場預測
 汽車動力傳動系統市場預測至2034年-按車輛類型、動力傳動系統類型、零件、推進架構、技術、銷售管道和地區分類的全球分析動力傳動系統控制市場預測至2034年:按組件、車輛類型、推進系統、技術和地區分類的全球分析2026年全球動力傳動系統及動力傳動系統零件市場報告2026年全球替代能源系統市場報告替代動力傳動系統市場:2026-2032年全球市場按動力傳動系統類型、零件、車輛類型和應用分類的預測
 全球汽車動力傳動系統市場規模、佔有率、趨勢和成長分析報告(2026-2034年)