


 |
市場調查報告書
商品編碼
2113852
無塵室技術:市場佔有率分析、產業趨勢與統計、成長預測(2026-2031)Cleanroom Technology - Market Share Analysis, Industry Trends & Statistics, Growth Forecasts (2026 - 2031) |
||||||

※ 本網頁內容可能與最新版本有所差異。詳細情況請與我們聯繫。
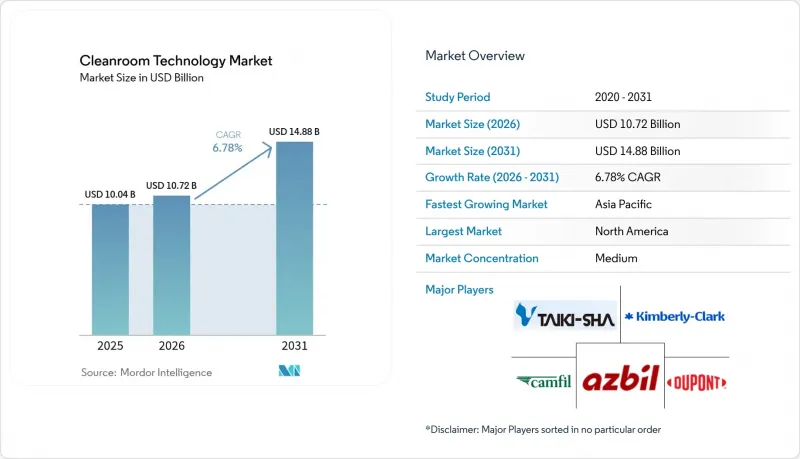
據 Mordor Intelligence 稱,2025 年無塵室技術市場價值為 100.4 億美元,預計到 2031 年將達到 148.8 億美元,而 2026 年為 107.2 億美元,預測期(2026-2031 年)的複合年成長率為 6.78%。
本報告按組件(設備和耗材)、結構類型(標準常規潔淨室、模組化硬牆潔淨室等)、無塵室等級(ISO 14644)(ISO 1-3級、ISO 4-5級等)、最終用戶(製藥生產、生物技術研發和生產等)以及地區進行細分。市場預測以美元計價。
全球無塵室技術市場趨勢及洞察
細胞和基因療法的生產正在推動模組化潔淨室的創新。
到2025年,歐洲將有多家設施投入運作,每家設施都需要符合ISO 5-7級標準的模組化潔淨室來生產「活體藥物」。諾華公司已在斯洛維尼亞啟動了一座全自動病毒載體製造地,這是其35億歐元(約40.9億美元)國家計畫的一部分。同時,羅氏公司在德國運作了一家基因治療研發中心,投資額達9,000萬歐元(約1.0518億美元)。這兩個專案都強調採用靈活的預設計佈局,以縮短驗證週期並便於未來的規模化生產。各國推出的資助計畫正在加速無塵室技術市場的訂單。
採用 CHIPS 方法擴大半導體生產規模,正加速基礎設施需求。
價值530億美元的《晶片與科學法案》在美國引發了前所未有的半導體製造廠建設熱潮。到2025年,預計將有18座新工廠開工建設,每座工廠都需要達到ISO 4級或更高標準的無塵室,控制精度低於0.1微米。僅台積電位於亞利桑那州的園區就計劃建造六座晶圓廠,這充分體現了這些大型企劃的規模以及由此產生的對數千平方公尺受控環境的巨大需求。國內設備供應商和過濾器製造商的訂單已達數年之久,進一步推動了無塵室技術市場的蓬勃發展。
PFAS法規將導致濾材成本增加。
美國環保署 (EPA) 已將飲用水中 PFOA 和 PFOS 的濃度限制在 4 ppt。這將逐步淘汰 HEPA 和 ULPA濾材中常用的含氟黏合劑和密封劑。製造商目前正在檢驗替代聚合物,同時承擔設備升級的成本,而這些成本最終將轉嫁到組件價格上。對於買家而言,預計到 2025 年初,過濾器報價將以兩位數的季度成長率成長,這將對整個無塵室技術市場的營運預算帶來壓力。
細分市場分析
預計到2031年,設備細分市場將以7.18%的複合年成長率成長,超過耗材類別(耗材類別在2025年佔無塵室技術市場54.66%的佔有率)。節能型風扇和過濾器單元以及具備數位化監控功能的暖通空調系統正在推動資本投資,因為製造商和處理設施都在尋求降低營運成本並簡化合規報告流程。具有預接線工廠連接的模組化牆板可縮短安裝時間,同時降低現場污染風險。
專為在相對濕度低於1%的環境下乾燥電池而設計的乾燥櫃,以及能夠即時檢測分子級污染物的AI真空泵,都體現了價值觀念向智慧硬體的轉變。儘管隨著新設施的運作,耗材的銷售額持續穩定成長,但由於PFAS相關材料的變化,利潤率面臨壓力,利潤來源正轉向高規格設備供應商。
到2025年,模組化硬牆潔淨室將佔據無塵室技術市場56.20%的佔有率,這得益於其成熟的結構完整性和簡化的合規性檢驗。隨著半導體、航空航太和契約製造用戶對臨時生產能力的需求,移動式或可攜式潔淨室預計將以7.74%的複合年成長率成長。與傳統建造方式相比,這些預製艙通常可將專案工期縮短高達60%,在津貼里程碑或產品發布日期臨近時,這具有顯著優勢。
在需要整合複雜公用設施的場合,傳統無塵室仍然發揮著至關重要的作用。剛性牆潔淨室廣泛應用於航太和國防專案中,以滿足其減振和電磁屏蔽的需求。隨著企業日益關注其全生命週期的碳足跡,可重複使用的模組化框架正與企業的永續發展目標相契合,從而推動無塵室技術市場佔有率的轉變。
區域分析
2025年,北美地區佔全球銷售額的33.62%,主要得益於《晶片製造和資訊系統法案》(CHIPS Act)下的大型企劃以及豐富的生物製藥產品線。該區域將繼續運作符合ISO 4級及更高標準的無塵室,直至2028年,但由於安裝人員短缺,部分專案進度有所延遲。加拿大和墨西哥透過汽車電子產品和無菌注射劑生產廠做出貢獻,但就規模而言仍處於次要地位。
歐洲的動力也來自於遵守歐盟醫療設備法規 (EU-MDR) 的維修,以及德國、斯洛維尼亞和英國基因治療產能的激增。歐盟排放交易體系 (EU-ETS) 第四階段的碳定價機制正在促進能源回收系統和低風阻氣流設計的應用,鼓勵供應商提高暖通空調 (HVAC) 系統的效率。東歐國家透過提供具有成本競爭力的勞動力來組裝模組化潔淨室,從而吸引對契約製造的投資。
亞太地區以7.32%的複合年成長率領跑,主要得益於中國1000億美元的300毫米晶圓廠建設計畫、台灣750億美元的先進節點計劃以及韓國810億美元的產能擴張。寬能隙半導體計畫、電池超級工廠和疫苗生產中心正在擴大目標需求。印度首座位於薩南德的先進晶圓廠預計將於2025年中期進入檢驗,顯示全部區域對高規格無塵室設施的需求正在不斷成長。東南亞其他新興市場正利用電子組裝的轉移來增強當地的無塵室生產能力。
其他好處:
- Excel格式的市場預測(ME)表
- 3個月的分析師支持
目錄
第1章:引言
- 研究假設和市場定義
- 調查範圍
第2章:調查方法
第3章執行摘要
第4章 市場狀況
- 市場概覽
- 市場促進因素
- 歐盟細胞和基因治療設施產能的快速擴張,推動了 ISO 5-7 級模組化無塵室的需求增加。
- 根據《晶片製造法案》(CHIPS Act) 的資助,美國製造預計將使符合 ISO 4 標準的空間增加超過 300 萬平方英尺(2025-2028 年)。
- 亞太地區 SiC 晶圓和先進封裝生產線的快速成長,需要小於 0.1 µm 的精確控制。
- 向歐盟醫療器材法規 (EU-MDR) 過渡要求醫療設備產業的中小型企業在 2027 年前符合 ISO 7 標準。
- 新冠疫情後建立的負壓隔離病房推動了對醫用無塵室的需求。
- 採用超乾燥模組化無塵室(相對濕度低於1%)的鋰離子電池超級工廠
- 市場限制因素
- 由於逐步淘汰 PFAS,HEPA/ULPA 過濾器的成本增加。
- 由於北美地區缺乏獲得 ISO 認證的安裝人員,該專案已比原計劃晚了六個多月。
- 在歐盟排放交易體系(EU-ETS)的第四階段,高耗能的暖通空調系統將受到碳定價的約束。
- 由於半導體產業景氣衰退,ISO 1-3 專案已被推遲。
- 產業生態系分析
- 監理趨勢(ISO分類)
- 技術展望
- 波特五力分析
- 主要宏觀經濟趨勢對市場的影響
第5章 市場規模與成長預測
- 按組件
- 裝置
- 潔淨室空氣浴塵室
- 暖通空調系統
- 層流空氣櫃
- HEPA/ULPA過濾器
- 乾燥櫃
- 風扇過濾器單元
- 模組化潔淨室結構
- 消耗品
- 服飾
- 手套
- 擦拭巾
- 消毒劑和清潔化學品
- 真空系統
- 黏性墊
- 裝置
- 依建築類型
- 採用標準常規施工方法建造的潔淨室。
- 模組化硬牆潔淨室
- 模組化軟牆潔淨室
- 剛性牆體式無塵室
- 移動式/可攜式潔淨室
- 無塵室等級(ISO 14644)
- ISO 1-3級
- ISO 4-5級
- ISO 6-7級
- ISO 8-9級
- 最終用戶
- 製藥生產
- 生物技術的研究、開發與生產
- 醫療設備製造
- 醫院和醫療機構
- 半導體製造
- 微電子學和光學
- 食品/飲料加工
- 航太/國防
- 汽車和電池製造
- 其他最終用戶
- 按地區
- 北美洲
- 美國
- 加拿大
- 墨西哥
- 歐洲
- 德國
- 英國
- 法國
- 義大利
- 西班牙
- 荷蘭
- 其他歐洲國家
- 亞太地區
- 中國
- 日本
- 印度
- 韓國
- 東南亞
- 台灣
- 其他亞太國家
- 南美洲
- 巴西
- 其他南美國家
- 中東
- 波灣合作理事會(GCC)成員國
- 土耳其
- 其他中東國家
- 非洲
- 南非
- 其他非洲國家
- 北美洲
第6章 競爭情勢
- 市場集中度
- 策略趨勢
- 市佔率分析
- 公司簡介
- Azbil Corporation
- DuPont de Nemours Inc.
- Kimberly-Clark Corporation
- Camfil AB
- Taikisha Ltd.
- Ardmac Ltd.
- Terra Universal Inc.
- Clean Air Products Inc.
- Labconco Corporation
- Ansell Limited
- Illinois Tool Works Inc.(Texwipe)
- Berkshire Corporation
- ABN Cleanroom Technology NV
- Bouygues Energies and Services
- Skan AG
- Simplex Isolation Systems
- 3M Company
- Connect 2 Cleanrooms Ltd.
- Guardtech Cleanrooms Ltd.
第7章 市場機會與未來展望
According to Mordor Intelligence, the cleanroom technology market size was valued at USD 10.04 billion in 2025 and estimated to grow from USD 10.72 billion in 2026 to reach USD 14.88 billion by 2031, at a CAGR of 6.78% during the forecast period (2026-2031).
This report is Segmented by Component (Equipment, and Consumables), Construction Type (Standard Stick-Built Cleanrooms, Modular Hardwall Cleanrooms, and More), Cleanroom Classification (ISO 14644) (ISO Class 1-3, ISO Class 4-5, and More), End-User (Pharmaceutical Manufacturing, Biotechnology R&D and Production, and More), and Geography. The Market Forecasts are Provided in Terms of Value (USD).
Global Cleanroom Technology Market Trends and Insights
Cell and Gene Therapy Manufacturing Drives Modular Cleanroom Innovation
Multiple European facilities reached operational status in 2025, each requiring ISO 5-7 modular suites for living-medicine production. Novartis brought its fully automated viral-vector site in Slovenia online, part of a EUR 3.5 billion (USD 4.09 billion) national program, while Roche opened a EUR 90 million (USD 105.18 million) gene-therapy development center in Germany. Both projects emphasize flexible, pre-engineered layouts that shorten validation cycles and ease future scale-ups. National funding schemes accelerate order flow across the cleanroom technology market.
CHIPS Act-Funded Semiconductor Expansion Accelerates Infrastructure Demand
The USD 53 billion CHIPS and Science Act ignited an unprecedented wave of United States fab construction. Eighteen new plants broke ground in 2025, each demanding ISO 4 or tighter rooms with sub-0.1 µm control. TSMC's Arizona complex alone plans six fabs, illustrating how megaproject footprints translate directly into thousands of square metres of controlled environment. Domestic tooling suppliers and filter makers report multi-year backlogs, lifting the cleanroom technology market.
PFAS Regulations Drive Filter Media Cost Inflation
The U.S. EPA set 4 ppt drinking-water limits for PFOA and PFOS, prompting a phased withdrawal of fluorinated binder and sealant chemistries common in HEPA and ULPA media. Manufacturers now validate alternative polymers while absorbing re-tooling expenses that flow into component pricing. For buyers, quarterly filter quotes increased by double digits in early 2025, tightening operating budgets across the cleanroom technology market.
Other drivers and restraints analyzed in the detailed report include:
- Silicon Carbide Wafer Processing Demands Ultra-Precision Environments
- EU-MDR Compliance Creates Retrofit Demand Surge
- Skilled Labor Shortage Delays Critical Infrastructure Projects
For complete list of drivers and restraints, kindly check the Table Of Contents.
Segment Analysis
The equipment segment is projected to grow at 7.18% CAGR through 2031, outstripping the consumables category that nonetheless held a 54.66% slice of the cleanroom technology market in 2025. Energy-efficient fan-filter units and digitally monitored HVAC systems lead capital spending as fabs and therapy sites target lower operating costs and streamlined compliance reporting. Modular wall panels with factory-integrated cabling reduce onsite contamination risks while trimming installation time.
Desiccator cabinets engineered for battery-cell drying below 1% relative humidity, along with AI-enabled vacuum pumps that detect molecular contamination in real time, demonstrate how value migrates to intelligent hardware. Consumables still post steady volume gains as new square footage comes online, yet margin pressure from PFAS-related material changes shifts profit pools toward high-specification equipment providers.
Modular hardwall rooms controlled 56.20% of the cleanroom technology market in 2025, helped by proven structural integrity and simplified regulatory validation. Mobile or portable designs record an 7.74% CAGR as semiconductor, space, and contract-manufacturing users seek temporary capacity. These pre-engineered pods typically cut project schedules by 60% compared with stick-built spaces, an advantage when grant milestones or product launch dates loom.
Traditional stick-built suites remain relevant where complex utilities integration is essential. Rigid-wall rooms serve aerospace and defense programs requiring vibration dampening and electromagnetic shielding. Firms increasingly weigh lifecycle carbon footprints, and reusable modular frames align with corporate sustainability targets, reinforcing the shift in share within the cleanroom technology market.
Complete Report Scope:
- By Component
- Equipment
- Cleanroom Air Showers
- HVAC Systems
- Laminar Air-flow Cabinets
- HEPA/ULPA Filters
- Desiccator Cabinets
- Fan-Filter Units
- Modular Cleanroom Structures
- Consumables
- Apparel
- Gloves
- Wipes
- Disinfectants and Cleaning Chemicals
- Vacuum Systems
- Adhesive Mats
- Equipment
- By Construction Type
- Standard Stick-Built Cleanrooms
- Modular Hardwall Cleanrooms
- Modular Softwall Cleanrooms
- Rigid-wall Cleanrooms
- Mobile/Portable Cleanrooms
- By Cleanroom Classification (ISO 14644)
- ISO Class 1-3
- ISO Class 4-5
- ISO Class 6-7
- ISO Class 8-9
- By End-User
- Pharmaceutical Manufacturing
- Biotechnology R&D and Production
- Medical Device Manufacturing
- Hospitals and Healthcare Facilities
- Semiconductor Fabrication
- Micro-electronics and Optics
- Food and Beverage Processing
- Aerospace and Defense
- Automotive and Battery Manufacturing
- Other End-users
- By Geography
- North America
- United States
- Canada
- Mexico
- Europe
- Germany
- United Kingdom
- France
- Italy
- Spain
- Netherlands
- Rest of Europe
- Asia-Pacific
- China
- Japan
- India
- South Korea
- South East Asia
- Taiwan
- Rest of Asia-Pacific
- South America
- Brazil
- Rest of South America
- Middle East
- Gulf Cooperation Council Countries
- Turkey
- Rest of Middle East
- Africa
- South Africa
- Rest of Africa
- North America
Geography Analysis
North America held 33.62% of 2025 revenue on the back of CHIPS Act megaprojects and an extensive biologics pipeline. The region continues to commission new ISO 4 and tighter suites through 2028, though installer shortages slow some timelines. Canada and Mexico contribute via automotive electronics and sterile injectables plants but remain secondary in scale.
Europe follows, propelled by EU-MDR retrofit activity and a surge in gene-therapy capacity across Germany, Slovenia, and the United Kingdom. Carbon-pricing under EU-ETS Phase IV incentivizes energy recovery systems and low-velocity airflow designs, pushing vendors to refine HVAC efficiency. Eastern European countries market cost-competitive labor for modular-room assembly, attracting investment in contract manufacturing.
Asia-Pacific displays the highest 7.32% CAGR, driven by China's USD 100 billion 300 mm fab pipeline, Taiwan's USD 75 billion advanced-node program, and South Korea's USD 81 billion capacity expansion. Wide-bandgap semiconductor programs, battery-cell gigafactories, and vaccine manufacturing hubs expand addressable demand. India's first leading-edge fab in Sanand entered validation in mid-2025, signalling broader regional adoption of high-specification suites. Other emerging markets in Southeast Asia leverage electronics assembly migration to bolster local cleanroom capacity.
- Azbil Corporation
- DuPont de Nemours Inc.
- Kimberly-Clark Corporation
- Camfil AB
- Taikisha Ltd.
- Ardmac Ltd.
- Terra Universal Inc.
- Clean Air Products Inc.
- Labconco Corporation
- Ansell Limited
- Illinois Tool Works Inc. (Texwipe)
- Berkshire Corporation
- ABN Cleanroom Technology NV
- Bouygues Energies and Services
- Skan AG
- Simplex Isolation Systems
- 3M Company
- Connect 2 Cleanrooms Ltd.
- Guardtech Cleanrooms Ltd.
Additional Benefits:
- The market estimate (ME) sheet in Excel format
- 3 months of analyst support
TABLE OF CONTENTS
1 INTRODUCTION
- 1.1 Study Assumptions and Market Definition
- 1.2 Scope of the Study
2 RESEARCH METHODOLOGY
3 EXECUTIVE SUMMARY
4 MARKET LANDSCAPE
- 4.1 Market Overview
- 4.2 Market Drivers
- 4.2.1 Rapid capacity expansion in EU cell and gene-therapy facilities demanding ISO 5-7 modular cleanrooms
- 4.2.2 CHIPS Act-funded United States fab construction adding Above 3 M sq ft of ISO 4 space (2025-28)
- 4.2.3 Surge in SiC wafer and advanced-packaging lines in Asia-Pacific requiring sub-0.1 µm control
- 4.2.4 EU-MDR transition forcing device SMEs to retrofit ISO 7 suites by 2027
- 4.2.5 Negative-pressure hospital wards post-COVID driving demand for healthcare cleanrooms
- 4.2.6 Li-ion gigafactories adopting ultra-dry modular cleanrooms (Less than 1 % RH)
- 4.3 Market Restraints
- 4.3.1 HEPA/ULPA media cost inflation from PFAS phase-out regulations
- 4.3.2 Shortage of ISO-certified installers in North America delaying projects Above 6 months
- 4.3.3 Energy-intensive HVAC facing carbon pricing under EU-ETS Phase IV
- 4.3.4 Semiconductor down-cycles triggering deferrals of ISO 1-3 projects
- 4.4 Industry Ecosystem Analysis
- 4.5 Regulatory Outlook (ISO Classification)
- 4.6 Technological Outlook
- 4.7 Porter's Five Forces Analysis
- 4.7.1 Bargaining Power of Suppliers
- 4.7.2 Bargaining Power of Buyers
- 4.7.3 Threat of New Entrants
- 4.7.4 Threat of Substitutes
- 4.7.5 Degree of Competition
- 4.8 Impact of Key Macroeconomic Trends on the Market
5 MARKET SIZE AND GROWTH FORECASTS (VALUES)
- 5.1 By Component
- 5.1.1 Equipment
- 5.1.1.1 Cleanroom Air Showers
- 5.1.1.2 HVAC Systems
- 5.1.1.3 Laminar Air-flow Cabinets
- 5.1.1.4 HEPA/ULPA Filters
- 5.1.1.5 Desiccator Cabinets
- 5.1.1.6 Fan-Filter Units
- 5.1.1.7 Modular Cleanroom Structures
- 5.1.2 Consumables
- 5.1.2.1 Apparel
- 5.1.2.2 Gloves
- 5.1.2.3 Wipes
- 5.1.2.4 Disinfectants and Cleaning Chemicals
- 5.1.2.5 Vacuum Systems
- 5.1.2.6 Adhesive Mats
- 5.1.1 Equipment
- 5.2 By Construction Type
- 5.2.1 Standard Stick-Built Cleanrooms
- 5.2.2 Modular Hardwall Cleanrooms
- 5.2.3 Modular Softwall Cleanrooms
- 5.2.4 Rigid-wall Cleanrooms
- 5.2.5 Mobile/Portable Cleanrooms
- 5.3 By Cleanroom Classification (ISO 14644)
- 5.3.1 ISO Class 1-3
- 5.3.2 ISO Class 4-5
- 5.3.3 ISO Class 6-7
- 5.3.4 ISO Class 8-9
- 5.4 By End-User
- 5.4.1 Pharmaceutical Manufacturing
- 5.4.2 Biotechnology R&D and Production
- 5.4.3 Medical Device Manufacturing
- 5.4.4 Hospitals and Healthcare Facilities
- 5.4.5 Semiconductor Fabrication
- 5.4.6 Micro-electronics and Optics
- 5.4.7 Food and Beverage Processing
- 5.4.8 Aerospace and Defense
- 5.4.9 Automotive and Battery Manufacturing
- 5.4.10 Other End-users
- 5.5 By Geography
- 5.5.1 North America
- 5.5.1.1 United States
- 5.5.1.2 Canada
- 5.5.1.3 Mexico
- 5.5.2 Europe
- 5.5.2.1 Germany
- 5.5.2.2 United Kingdom
- 5.5.2.3 France
- 5.5.2.4 Italy
- 5.5.2.5 Spain
- 5.5.2.6 Netherlands
- 5.5.2.7 Rest of Europe
- 5.5.3 Asia-Pacific
- 5.5.3.1 China
- 5.5.3.2 Japan
- 5.5.3.3 India
- 5.5.3.4 South Korea
- 5.5.3.5 South East Asia
- 5.5.3.6 Taiwan
- 5.5.3.7 Rest of Asia-Pacific
- 5.5.4 South America
- 5.5.4.1 Brazil
- 5.5.4.2 Rest of South America
- 5.5.5 Middle East
- 5.5.5.1 Gulf Cooperation Council Countries
- 5.5.5.2 Turkey
- 5.5.5.3 Rest of Middle East
- 5.5.6 Africa
- 5.5.6.1 South Africa
- 5.5.6.2 Rest of Africa
- 5.5.1 North America
6 COMPETITIVE LANDSCAPE
- 6.1 Market Concentration
- 6.2 Strategic Moves
- 6.3 Market Share Analysis
- 6.4 Company Profiles (includes Global level Overview, Market level overview, Core Segments, Financials as available, Strategic Information, Market Rank/Share, Products and Services, Recent Developments)
- 6.4.1 Azbil Corporation
- 6.4.2 DuPont de Nemours Inc.
- 6.4.3 Kimberly-Clark Corporation
- 6.4.4 Camfil AB
- 6.4.5 Taikisha Ltd.
- 6.4.6 Ardmac Ltd.
- 6.4.7 Terra Universal Inc.
- 6.4.8 Clean Air Products Inc.
- 6.4.9 Labconco Corporation
- 6.4.10 Ansell Limited
- 6.4.11 Illinois Tool Works Inc. (Texwipe)
- 6.4.12 Berkshire Corporation
- 6.4.13 ABN Cleanroom Technology NV
- 6.4.14 Bouygues Energies and Services
- 6.4.15 Skan AG
- 6.4.16 Simplex Isolation Systems
- 6.4.17 3M Company
- 6.4.18 Connect 2 Cleanrooms Ltd.
- 6.4.19 Guardtech Cleanrooms Ltd.
7 MARKET OPPORTUNITIES AND FUTURE OUTLOOK
- 7.1 White-space and Unmet-Need Assessment

 全球無塵室技術市場:依產品、類型、最終用戶和地區分類-預測至2031年
 無塵室技術市場:按交付方式、建造類型、技術、應用和最終用戶產業分類-2026-2032年全球市場預測
 無塵室技術市場機會、成長要素、產業趨勢分析及2026-2035年預測
 潔淨室技術市場:按類型、產品類型、最終用戶和地區分類通風櫃監視器市場:按類型、安裝類型、技術、應用、最終用戶和銷售管道分類 - 2026-2032年全球預測
 無塵室技術市場分析及預測(至2035年):依類型、產品類型、服務、技術、組件、應用、材料類型、設備及最終用戶分類
 全球無塵室技術市場規模、佔有率、趨勢和成長分析報告(2026-2034年)
 無塵室技術市場規模、佔有率及成長分析(按產品、類型、最終用戶和地區分類)-2026-2033年產業預測
 2025年無塵室技術全球市場報告
 無塵室技術市場,規模,佔有率,趨勢,產業分析報告:各產品類型,各最終用途,各地區,2025年~2034年的市場預測