


 |
市場調查報告書
商品編碼
2113838
巨量資料在石油天然氣探勘與生產的應用:市場佔有率分析、產業趨勢與統計數據以及成長預測(2026-2031 年)Big Data In Oil And Gas Exploration And Production - Market Share Analysis, Industry Trends & Statistics, Growth Forecasts (2026 - 2031) |
||||||

※ 本網頁內容可能與最新版本有所差異。詳細情況請與我們聯繫。
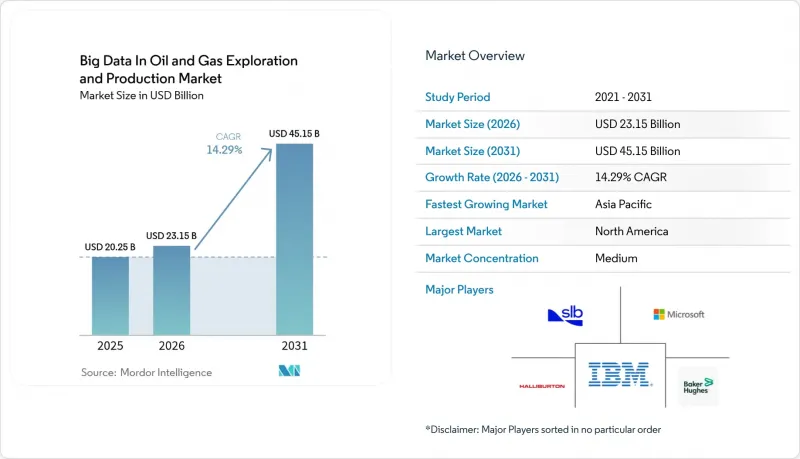
據 Mordor Intelligence 稱,石油和天然氣探勘與生產巨量資料市場規模預計在 2026 年達到 231.5 億美元,高於 2025 年的 202.5 億美元,預計到 2031 年將達到 451.5 億美元。
預計從 2026 年到 2031 年,其複合年成長率將達到 14.3%。
本報告按組件(硬體、軟體、服務)、部署模式(本地部署、雲端部署、混合邊緣部署)、資料類型(結構化、非結構化、半結構化/流式)、應用(儲存管理/提高採收率、鑽井/油井規劃、預測性維護、其他)和地區(北美、歐洲、亞太地區、其他)進行分類。
全球石油天然氣探勘與生產巨量資料市場趨勢及洞察。
高頻探勘與生產(E&P)感測器資料的爆炸性成長
現代鑽井鑽機配備超過4萬個感測器,每口井每天產生超過2TB的資料流。邊緣設備在本地對這些海量資料進行過濾,並將篩選出的資料集轉發到雲端叢集進行進一步處理。即時最佳化可將非生產時間減少高達15%,同時提高井位定位的精確度。國際能源總署(IEA)預測,到2030年,與人工智慧相關的工業用電需求將達到1500太瓦時(TWh),凸顯了此類分析背後巨大的運算負載。營運商已經開始使用多感測器相關性分析來提前72小時預測設備故障,從而將意外停機時間減少25%。
成本壓力導致對生產最佳化的需求增加
在低利潤環境下,生產商竭盡全力從現有油井中榨取每一滴油。埃克森美孚的自動化氣舉系統使1,300口油井的產量提高了2.2%,並降低了每年5,000萬美元的成本。機器學習模型分析歷史產量、儲存壓力和電潛泵(ESP)性能,以識別性能不佳的資產。 Vital Energy公司報告稱,透過根據地下條件持續調整馬達轉速,提升泵浦效率提高了2-4%。貝克休斯公司的InjectRT軟體能夠以90%的準確率預測化學藥劑注入量,從而防止過量注射和結垢。
對網路安全和智慧財產權保護的擔憂
到2024年,超過一半的大型燃氣公司報告了資料外洩事件,69%的公司在外部安全評估中被評為「D」級或更低。營運技術(OT)和資訊科技(IT)網路的融合正在創造新的攻擊面。即使採取了強大的加密措施,營運商仍然不願將價值數十億美元的專有地下資料遷移到公共雲端。監管方面的不一致是另一個障礙;一些司法管轄區規定地震探勘資料必須保留在本國境內。這些問題共同阻礙了共用分析平台的普及。
細分市場分析
預計到2025年,軟體收入將佔總收入的最大佔有率,達到37.95%,並有望以15.62%的複合年成長率成長。這凸顯出,在石油和天然氣探勘與生產的巨量資料市場中,決定競爭優勢的不再是硬體設備的數量,而是演算法的複雜程度。供應商正透過將地震波解釋、儲存建模和預測性維護整合到統一的套件中,加快價值實現速度。託管服務供應商透過向現場團隊派遣資料科學家,快速將模型投入運行,從而為這些服務提供補充。
硬體對於高效能運算和環境適應性強的邊緣閘道器仍然至關重要,但雲端的可擴展性正在消除持續升級所需的資本支出 (CAPEX)。從資料整合到變更管理培訓等一系列服務可協助營運商克服傳統 IT 的障礙。隨著軟體的成熟,價值正轉向諸如自動氣舉調節和電潛泵故障預測等打包用例,這些用例可在數週內帶來可衡量的生產力提升。
即使到了2025年,本地部署環境仍將佔據41.90%的市場佔有率,這反映了其在安全性方面的優勢以及對本地資料儲存的監管要求。然而,雲端工作負載正以18.15%的複合年成長率快速成長,是石油和天然氣探勘與生產巨量資料市場所有部署類別中成長最快的。混合架構正逐漸成為主流,敏感資料保留在營運商的防火牆內,而高要求的模擬則在雲端GPU叢集上進行突發處理。
邊緣運算佔據了最後一層,在需要毫秒響應的礦井前端運行人工智慧。這種分層模型降低了延遲,減少了頻寬成本,並支援在偏遠盆地進行自主作業。供應商現在提供預先檢驗的藍圖,以簡化混合部署,即使是保守的營運商也能更輕鬆地完成過渡。
區域分析
北美地區在頁岩油氣公司的推動下,預計到2025年將貢獻37.25%的收入。這些頁岩油氣公司率先採用了水平鑽井和資料豐富的完井技術。該地區持續推進自動化氣舉控制和電潛泵(ESP)分析技術的應用,從而顯著降低了成本。政府對資料共用聯盟的支持進一步改善了地下資料庫的取得。
亞太地區是成長最快的地區,預計到2031年將以18.42%的複合年成長率成長。中國和印度的國有石油公司正在投資人工智慧驅動的探勘,以提高國內供應穩定性。產學合作計畫正在加速演算法在地化,以應對南海和印度洋盆地複雜的地質特徵。
在中東,各公司正利用海量的油田資料集(光是沙烏地阿美就擁有1,500PB的資料)運作人工智慧模型,以最佳化大型儲存的注油模式。在歐洲,他們專注於排放分析,以符合嚴格的ESG(環境、社會和治理)法規;而在南美,他們則採用雲端平台來彌補自身有限的運算能力。這些趨勢共同表明,石油和天然氣探勘與生產的巨量資料市場規模仍然遍及全球,但其應用方式靈活多變,能夠適應不同地區的實際情況。
其他好處
- Excel格式的市場預測(ME)表
- 3個月的分析師支持
目錄
第1章:引言
- 研究假設和市場定義
- 調查範圍
第2章:調查方法
第3章執行摘要
第4章 市場狀況
- 市場概覽
- 市場促進因素
- 高頻探勘與生產(E&P)感測器資料的爆炸性成長
- 成本壓力導致對生產最佳化的需求增加
- 地下資料處理工作負載的雲端遷移
- 業界對 OSDU 開放資料標準的採用
- 隧道邊緣和偏遠入口處的霧分析
- 基於ESG因子的強制性甲烷外洩分析
- 市場限制因素
- 對網路安全和智慧財產權保護的擔憂
- 受傳統IT和資料孤島的影響,情況變得複雜
- 特定領域資料科學人才短缺
- 監理帶來的投資不確定性
- 供應鏈分析
- 監理情勢
- 技術展望
- 波特五力模型
第5章 市場規模與成長預測
- 按組件
- 硬體
- 軟體
- 服務
- 部署模式
- 現場
- 雲
- 混合邊緣相容
- 類型
- 結構化
- 非結構化
- 半結構化串流媒體
- 透過使用
- 探勘和地震波成像
- 鑽井和鑽井計劃
- 生產和提升最佳化
- 油藏管理和提高採收率(儲存作業)
- 預測性保護
- 健康、安全、設備和排放氣體監測
- 供應鏈物流
- 按地區
- 北美洲
- 美國
- 加拿大
- 墨西哥
- 歐洲
- 德國
- 英國
- 法國
- 義大利
- 北歐國家
- 俄羅斯
- 其他歐洲國家
- 亞太地區
- 中國
- 印度
- 日本
- 韓國
- ASEAN
- 其他亞太國家
- 南美洲
- 巴西
- 阿根廷
- 哥倫比亞
- 其他南美國家
- 中東和非洲
- 沙烏地阿拉伯
- 阿拉伯聯合大公國
- 卡達
- 奈及利亞
- 南非
- 埃及
- 其他中東和非洲國家
- 北美洲
第6章 競爭情勢
- 市場集中度
- 策略趨勢(併購、聯盟、購電協議)
- 市場佔有率分析(主要公司的市場排名和佔有率)
- 公司簡介
- IBM
- Schlumberger
- Halliburton
- Baker Hughes
- Microsoft
- AWS
- Google Cloud
- Oracle
- Accenture
- Palantir
- Cognite
- AspenTech
- GE Vernova
- Hitachi Vantara
- SAP SE
- Teradata
- Dell Technologies
- Spotfire/TIBCO
- C3 AI
- Emerson
- Pason Systems
第7章 市場機會與未來展望
According to Mordor Intelligence, big data in oil and gas exploration and production market size market size in 2026 is estimated at USD 23.15 billion, growing from 2025 value of USD 20.25 billion with 2031 projections showing USD 45.15 billion, growing at 14.3% CAGR over 2026-2031.
This report is Segmented by Component (Hardware, Software, and Services), Deployment Mode (On-Premise, Cloud, and Hybrid/Edge-Enabled), Data Type (Structured, Unstructured, and Semi-structured/Streaming), Application (Reservoir Management and EOR, Drilling and Well Planning, Predictive Maintenance, and More), and Geography (North America, Europe, Asia-Pacific, and More).
Global Big Data In Oil And Gas Exploration And Production Market Trends and Insights
Explosion of High-Frequency E&P Sensor Data
Modern rigs now carry more than 40,000 sensors that stream over 2 TB per well each day. Edge devices filter this torrent locally and then relay curated sets to cloud clusters for further processing. Real-time optimisation cuts non-productive time by up to 15% while raising wellbore placement accuracy. The International Energy Agency expects AI-linked industrial electricity demand to reach 1,500 TWh by 2030, underscoring the compute load behind these analytics . Operators already use multi-sensor correlation to predict equipment faults 72 hours ahead, lowering unplanned downtime by 25%.
Cost-Pressure Led Demand for Production Optimization
Low-margin environments prompt producers to extract every last drop from existing wells. ExxonMobil's automated gas-lift system delivered a 2.2% production uplift across 1,300 wells and trimmed USD 50 million in yearly costs . Machine-learning models review historical production, reservoir pressure, and ESP performance to identify underperforming assets. Vital Energy reported 2-4% lift-pump gains by continuously adjusting motor speed against downhole conditions. Baker Hughes' InjectRT software predicts chemical-injection needs with 90% accuracy, preventing overdosing and scale build-up.
Cyber-security & IP-Protection Concerns
More than half of the top oil and gas firms reported data breaches in 2024, with 69% scoring D or below on external security ratings. The blending of OT and IT networks opens fresh attack surfaces. Operators hesitate to move proprietary subsurface data-often worth billions-to public clouds despite the use of its strong encryption. Regulatory mosaics add extra hurdles; some jurisdictions insist seismic data stay within national borders. Together these issues slow universal adoption of shared analytics platforms.
Other drivers and restraints analyzed in the detailed report include:
- Cloud Migration of Subsurface Data Workloads
- Industry Adoption of OSDU Open Data Standard
- Legacy IT & Data-Silo Complexity
For complete list of drivers and restraints, kindly check the Table Of Contents.
Segment Analysis
Software contributed the largest 37.95% share of 2025 revenue, and it is forecast to grow at a 15.62% CAGR, underscoring that algorithm sophistication, not hardware count, drives the competitive edge in the Big Data market for oil and gas exploration & production. Providers bundle seismic interpretation, reservoir modelling, and predictive maintenance within cohesive suites that shorten time-to-value. Managed-service providers complement these offerings by deploying data scientists into field teams to operationalise models quickly.
Hardware retains relevance for high-performance computing and ruggedized edge gateways, yet cloud elasticity removes the need for constant capital expenditure (capex) refresh. Services-ranging from data integration to change-management training-help operators overcome legacy IT friction. As software matures, value migrates toward packaged use cases, such as automated gas-lift tuning or ESP failure prediction, that deliver measurable production gains within weeks.
On-premise estates still held a 41.90% share in 2025, reflecting perceived security benefits and regulatory mandates for local data storage. Even so, cloud workloads are growing at an 18.15% CAGR, the fastest of any deployment category within the big data market in oil and gas exploration & production. Hybrid architectures dominate: sensitive data sits inside operator firewalls while heavyweight simulations burst to cloud GPU clusters.
Edge computing provides the final layer, executing AI at the wellhead where milliseconds matter. This tiered model trims latency, controls bandwidth costs, and supports autonomous operations in remote basins. Vendors now offer pre-validated blueprints that streamline hybrid deployment, making the transition easier for conservative operators.
Complete Report Scope:
- By Component
- Hardware
- Software
- Services
- By Deployment Mode
- On-premise
- Cloud
- Hybrid/Edge-Enabled
- By Data Type
- Structured
- Unstructured
- Semi-structured/Streaming
- By Application
- Exploration and Seismic Imaging
- Drilling and Well Planning
- Production and Lift Optimization
- Reservoir Management and EOR
- Predictive Maintenance
- HSE and Emissions Monitoring
- Supply-Chain and Logistics
- Geography
- North America
- United States
- Canada
- Mexico
- Europe
- Germany
- United Kingdom
- France
- Italy
- NORDIC Countries
- Russia
- Rest of Europe
- Asia-Pacific
- China
- India
- Japan
- South Korea
- ASEAN Countries
- Rest of Asia-Pacific
- South America
- Brazil
- Argentina
- Colombia
- Rest of South America
- Middle East and Africa
- Saudi Arabia
- United Arab Emirates
- Qatar
- Nigeria
- South Africa
- Egypt
- Rest of Middle East and Africa
- North America
Geography Analysis
North America generated 37.25% of 2025 revenue, powered by shale players that pioneered horizontal drilling and data-rich completions. The region continues to scale automated gas-lift control and ESP analytics that deliver tangible cost savings. Government support for data-sharing consortia further expands the accessibility of subsurface libraries.
The Asia-Pacific region is the fastest-growing geography, projected to grow at an 18.42% CAGR through 2031. National oil companies in China and India are investing capital in AI-enabled exploration to enhance domestic supply security. Joint research programs between academia and industry accelerate the localization of algorithms for complex geology found in the South China Sea and Indian basins.
The Middle East leverages massive field datasets-Saudi Aramco alone stores 1,500 PB-to run AI models that optimise injection patterns across giant reservoirs. Europe focuses on emissions analytics to meet strict ESG rules, while South America adopts cloud platforms to overcome limited in-house computing capabilities. Collectively, these trends ensure the Big Data in oil and gas exploration & production market remains global in scope, yet locally nuanced in execution.
- IBM
- Schlumberger
- Halliburton
- Baker Hughes
- Microsoft
- AWS
- Google Cloud
- Oracle
- Accenture
- Palantir
- Cognite
- AspenTech
- GE Vernova
- Hitachi Vantara
- SAP SE
- Teradata
- Dell Technologies
- Spotfire/TIBCO
- C3 AI
- Emerson
- Pason Systems
Additional Benefits:
- The market estimate (ME) sheet in Excel format
- 3 months of analyst support
TABLE OF CONTENTS
1 Introduction
- 1.1 Study Assumptions & Market Definition
- 1.2 Scope of the Study
2 Research Methodology
3 Executive Summary
4 Market Landscape
- 4.1 Market Overview
- 4.2 Market Drivers
- 4.2.1 Explosion of high-frequency E&P sensor data
- 4.2.2 Cost-pressure led demand for production optimization
- 4.2.3 Cloud migration of subsurface data workloads
- 4.2.4 Industry adoption of OSDU open data standard
- 4.2.5 Edge / fog analytics at remote wellheads
- 4.2.6 ESG-driven methane-leak analytics mandates
- 4.3 Market Restraints
- 4.3.1 Cyber-security & IP-protection concerns
- 4.3.2 Legacy IT & data-silo complexity
- 4.3.3 Shortage of domain data-science talent
- 4.3.4 Regulatory-driven investment uncertainty
- 4.4 Supply-Chain Analysis
- 4.5 Regulatory Landscape
- 4.6 Technological Outlook
- 4.7 Porter's Five Forces
- 4.7.1 Bargaining Power of Suppliers
- 4.7.2 Bargaining Power of Buyers
- 4.7.3 Threat of New Entrants
- 4.7.4 Threat of Substitutes
- 4.7.5 Intensity of Rivalry
5 Market Size & Growth Forecasts
- 5.1 By Component
- 5.1.1 Hardware
- 5.1.2 Software
- 5.1.3 Services
- 5.2 By Deployment Mode
- 5.2.1 On-premise
- 5.2.2 Cloud
- 5.2.3 Hybrid/Edge-Enabled
- 5.3 By Data Type
- 5.3.1 Structured
- 5.3.2 Unstructured
- 5.3.3 Semi-structured/Streaming
- 5.4 By Application
- 5.4.1 Exploration and Seismic Imaging
- 5.4.2 Drilling and Well Planning
- 5.4.3 Production and Lift Optimization
- 5.4.4 Reservoir Management and EOR
- 5.4.5 Predictive Maintenance
- 5.4.6 HSE and Emissions Monitoring
- 5.4.7 Supply-Chain and Logistics
- 5.5 Geography
- 5.5.1 North America
- 5.5.1.1 United States
- 5.5.1.2 Canada
- 5.5.1.3 Mexico
- 5.5.2 Europe
- 5.5.2.1 Germany
- 5.5.2.2 United Kingdom
- 5.5.2.3 France
- 5.5.2.4 Italy
- 5.5.2.5 NORDIC Countries
- 5.5.2.6 Russia
- 5.5.2.7 Rest of Europe
- 5.5.3 Asia-Pacific
- 5.5.3.1 China
- 5.5.3.2 India
- 5.5.3.3 Japan
- 5.5.3.4 South Korea
- 5.5.3.5 ASEAN Countries
- 5.5.3.6 Rest of Asia-Pacific
- 5.5.4 South America
- 5.5.4.1 Brazil
- 5.5.4.2 Argentina
- 5.5.4.3 Colombia
- 5.5.4.4 Rest of South America
- 5.5.5 Middle East and Africa
- 5.5.5.1 Saudi Arabia
- 5.5.5.2 United Arab Emirates
- 5.5.5.3 Qatar
- 5.5.5.4 Nigeria
- 5.5.5.5 South Africa
- 5.5.5.6 Egypt
- 5.5.5.7 Rest of Middle East and Africa
- 5.5.1 North America
6 Competitive Landscape
- 6.1 Market Concentration
- 6.2 Strategic Moves (M&A, Partnerships, PPAs)
- 6.3 Market Share Analysis (Market Rank/Share for key companies)
- 6.4 Company Profiles (includes Global level Overview, Market level overview, Core Segments, Financials as available, Strategic Information, Products & Services, and Recent Developments)
- 6.4.1 IBM
- 6.4.2 Schlumberger
- 6.4.3 Halliburton
- 6.4.4 Baker Hughes
- 6.4.5 Microsoft
- 6.4.6 AWS
- 6.4.7 Google Cloud
- 6.4.8 Oracle
- 6.4.9 Accenture
- 6.4.10 Palantir
- 6.4.11 Cognite
- 6.4.12 AspenTech
- 6.4.13 GE Vernova
- 6.4.14 Hitachi Vantara
- 6.4.15 SAP SE
- 6.4.16 Teradata
- 6.4.17 Dell Technologies
- 6.4.18 Spotfire/TIBCO
- 6.4.19 C3 AI
- 6.4.20 Emerson
- 6.4.21 Pason Systems
7 Market Opportunities & Future Outlook
- 7.1 White-space & Unmet-Need Assessment

 巨量資料軟體即服務(SaaS) 市場-2026-2032 年全球市場預測
 巨量資料智慧引擎市場規模、佔有率和成長分析:按組件類型、引擎功能、部署模式、最終用戶產業和地區分類-2026-2033年產業預測巨量資料商業分析市場:按組件、分析類型、組織規模、資料類型、技術、定價模式、部署方法、應用分類 - 全球市場預測(2026-2032 年)
 永續程式工程市場預測至2034年-全球工程解決方案、製程類型、技術、應用、最終用戶和區域分析
 汽車產業的巨量資料:市場佔有率分析、產業趨勢與統計數據以及成長預測(2026-2031 年)巨量資料市場:2026-2032年全球市場預測(依組件、資料類型、部署方式、應用領域、產業及組織規模分類)
 巨量資料軟體市場規模、佔有率和成長分析:按軟體類型、部署模式、產業和地區分類-2026-2033年產業預測
 2026年全球資料轉換電路市場報告
 石油天然氣巨量資料市場-全球產業規模、佔有率、趨勢、機會與預測:按組件、應用、資料類型、地區和競爭對手分類,2021-2031年巨量資料技術市場預測至2034年-按解決方案、服務、部署類型、組織規模、應用、最終用戶和地區分類的全球分析