


 |
市場調查報告書
商品編碼
2113673
數位物流:市場佔有率分析、產業趨勢與統計、成長預測(2026-2031)Digital Logistics - Market Share Analysis, Industry Trends & Statistics, Growth Forecasts (2026 - 2031) |
||||||

※ 本網頁內容可能與最新版本有所差異。詳細情況請與我們聯繫。
根據 Mordor Intelligence 估計,到 2026 年,數位物流市值將達到 555.7 億美元,高於 2025 年的 455 億美元,預計到 2031 年將達到 1507.9 億美元。
預計從 2026 年到 2031 年,其複合年成長率將達到 22.1%。
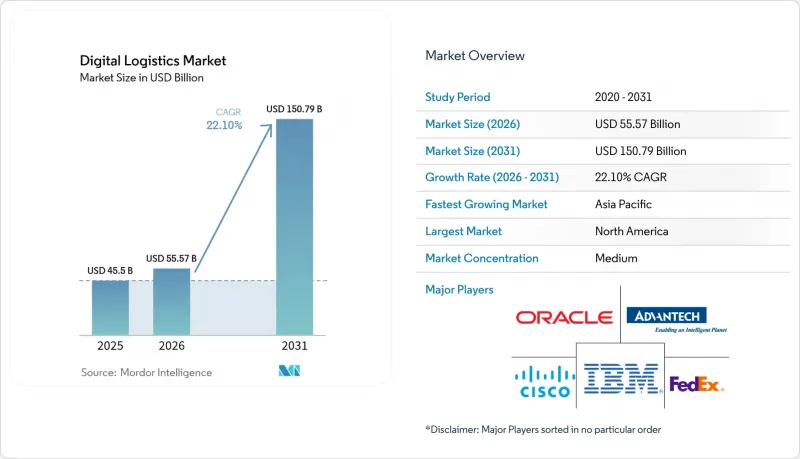
本報告按類型(解決方案和服務)、部署模式(雲端和本地部署)、系統/類型(庫存管理、倉庫管理系統 (WMS)、車輛管理等)、最終用戶行業(零售和電子商務、製造業、汽車業、製藥業、生命科學業等)以及地區進行細分。市場預測以價值(美元)表示。
全球數位物流市場趨勢與洞察
北美即時物聯網車輛遠端資訊處理技術的擴展
目前,連網的遠端資訊處理設備能夠即時傳輸引擎狀態、駕駛行為和貨物數據,從而實現預測性維護,減少30%的停機時間,並降低15-20%的油耗。物流業者正利用這些優勢提供有保障的高價值配送時段,在提升服務水準的同時減少排放。預計到2032年,物聯網物流領域的支出將超過1,147億美元,車隊遠端資訊處理已成為經營團隊重點,尤其對於那些希望透過永續發展實現差異化的承運商而言更是如此。
歐洲第三方物流公司正在實施人工智慧驅動的預測性倉庫分析。
歐洲第三方物流公司正將機器學習演算法和電腦視覺技術結合,建構倉庫的數位孿生模型,在不影響訂單滿足率的前提下,將庫存減少20-30%。情境建模使營運商能夠主動預防因人手不足造成的瓶頸,並在幾分鐘內(而非幾小時)完成揀貨路線的重新配置。這些功能為結合需求預測和履約的新型加值合約奠定了基礎,有助於第三方物流公司提高利潤率。
非洲5G走廊投資不足
在主要航運走廊中,僅有7%覆蓋了5G網路,這限制了跨境運輸的即時可視性。清關平均耗時48至72小時,遠長於通訊基礎設施完善地區4至6小時的通關時間,延長了貨物滯留時間,增加了庫存持有成本。據估計,需要47億美元才能彌補這一差距,這筆資金超過了目前公共和私人資金的總額。儘管如此,試點走廊的效率已開始提高。
細分市場分析
到2025年,數位化物流服務將佔總收入的32.65%,但其複合年成長率高達23.55%,顯示對外包專業知識的需求日益成長。缺乏足夠內部人才的企業擴大選擇外包管理服務,以統籌系統整合、資料清洗和持續最佳化。儘管解決方案在2025年仍將佔剩餘的67.35%收入,並構成許多轉型藍圖的基礎,但買家現在更重視模組化和開放API,而非單一的整體式套件。供應商的成功取決於將強大的核心平台與精心打造的合作夥伴生態系統相結合,以支援低溫運輸檢驗和清關等專業功能。中型企業的採用情況清楚地體現了這一轉變,72%的中型企業現在更傾向於簽訂服務合約而非直接購買軟體,以避免資本支出(CAPEX)並加快投資回報率(ROI)。像Tech Mahindra這樣的供應商正在將低程式碼加速器和人工智慧工具包捆綁在一起,使客戶能夠在幾天內(而不是幾個季度)重新配置工作流程。隨著法規、需求模式和永續性目標的不斷演變,這種柔軟性至關重要。供應商正透過提供模組化分割和「按需收費」的經營模式來應對這項挑戰,從而確保數位物流市場的持續多元化。
到2025年,雲端平台將佔數位物流市場57.60%的佔有率,預計到2031年將以22.93%的複合年成長率成長。擴充性、快速部署和全球可存取性使雲端架構成為全通路物流網路的首選。與本地部署解決方案相比,企業報告指出引進週期縮短了35%,整體擁有成本(TCO)降低了42%,凸顯了轉型的經濟合理性。雖然安全性曾經是採用雲端技術的障礙,但企業級加密、零信任框架和主權雲端選項已在很大程度上解決了這些問題。混合模式仍然在資料居住規則適用的高度監管行業中得到應用,但邊緣到雲端架構能夠在不犧牲管治的前提下滿足即時處理需求。北美以67%的雲端採用率領先,其次是歐洲,為63%。隨著頻寬的提升和超大規模資料中心業者開放新區域,新興市場正迅速迎頭趕上。預計本地部署仍將在機器人等需要超低延遲和專有傳統硬體的小眾應用場景中繼續使用,但其在整個數位物流市場中的佔有率預計將穩步下降。
區域分析
到2025年,北美將佔全球數位物流市場收入的37.55%。高電子商務滲透率、5G的廣泛部署以及充裕的創業投資資金投資,正在孕育一個充滿活力的生態系統,其中包括SaaS供應商、機器人公司和貨運科技新創公司。十分之八的物流公司計劃在2025年將人工智慧融入至少一個工作流程,監管機構也正在穩步推進自動駕駛卡車的試運行。
亞太地區是經濟成長的主要驅動力,預計到2031年將以23.58%的複合年成長率成長。中國、印度和東南亞地區正透過線上消費的激增和雄心勃勃的國家物流走廊建設,為此成長軌跡提供支撐。跨境經銷商受益於包含關稅的模式和智慧儲物櫃,但數據標準的差異推高了成本,並阻礙了中小企業的市場准入。微型倉配正在擴張,摩托車配送在都市區擁擠的背景下蓬勃發展,而無人機則被用於彌合離島基礎設施的差距。在歐洲,先進的基礎設施正與政策主導的永續性融合。碳排放掛鉤的道路收費和低排放氣體區的引入,增加了對路線最佳化軟體和電動末端配送車輛的需求。該地區的第三方物流(3PL)公司正在引領預測性倉庫分析技術的應用,以應對人手不足和人事費用上漲的問題。在中東,主權財富基金正投資智慧港口和鐵路網路,以減少對石油的依賴。非洲的潛力仍取決於5G和海關現代化,而南美洲正面臨勞動力短缺,這導致倉庫管理系統(WMS)的實施成本上升了高達40%。
其他好處:
- Excel格式的市場預測(ME)表
- 3個月的分析師支持
目錄
第1章:引言
- 研究假設和市場定義
- 調查範圍
第2章:調查方法
第3章執行摘要
第4章 市場狀況
- 市場概覽
- 市場促進因素
- 北美即時物聯網車隊遠端資訊處理技術的擴展
- 歐洲第三方物流供應商採用人工智慧驅動的預測性倉庫分析的現狀
- 亞洲地區當日送達的電子商務訂單處理量激增。
- 各國(中東)綠色貨運數位化獎勵
- 汽車製造商(OEM)面向消費者的數位化物流項目
- 後疫情時代歐洲藥品低溫運輸的強制數位化
- 市場限制因素
- 非洲5G走廊投資不足
- 亞太地區數據標準的差異阻礙了跨境貿易。
- 雲端物流平台的網路保險保費正在飆升。
- 拉丁美洲WMS人員短缺
- 價值鏈分析
- 監管和技術展望
- 波特五力分析
第5章 市場規模與成長預測
- 按組件
- 解決方案
- 服務
- 部署模式
- 基於雲端的
- 現場
- 系統/類型
- 庫存管理
- 倉庫管理系統(WMS)
- 車隊管理
- 數據管理與分析
- 追蹤和監控
- 其他類型
- 按最終用戶行業分類
- 零售與電子商務
- 製造業
- 車
- 製藥和生命科學
- 食品/飲料
- 石油、天然氣和能源
- 面向消費者的包裝商品
- 其他終端用戶產業
- 按地區
- 北美洲
- 美國
- 加拿大
- 墨西哥
- 南美洲
- 巴西
- 阿根廷
- 其他南美國家
- 歐洲
- 英國
- 德國
- 法國
- 西班牙
- 義大利
- 其他歐洲國家
- 亞太地區
- 中國
- 印度
- 日本
- 澳洲
- 韓國
- 其他亞太國家
- 中東和非洲
- 中東
- 沙烏地阿拉伯
- 阿拉伯聯合大公國
- 土耳其
- 其他中東國家
- 非洲
- 南非
- 肯亞
- 其他非洲國家
- 中東
- 北美洲
第6章 競爭情勢
- 市場集中度
- 策略趨勢
- 市佔率分析
- 公司簡介
- SAP SE
- IBM Corporation
- Oracle Corporation
- Honeywell International Inc.
- Advantech Co. Ltd.
- Blue Yonder(Formerly JDA Software)
- Manhattan Associates Inc.
- Korber Supply Chain(HighJump)
- Tech Mahindra Ltd.
- Infosys Ltd.
- HCL Technologies Ltd.
- Amazon Web Services(AWS)
- DHL Group
- FedEx Corp.
- Cisco Systems Inc.
- Trimble Inc.
- Verizon Communications Inc.
- Bosch Software Innovations GmbH
- Maersk Digital
- Vinculum Group
- Hexaware Technologies Ltd.
第7章 市場機會與未來展望
According to Mordor Intelligence, digital logistics market size in 2026 is estimated at USD 55.57 billion, growing from 2025 value of USD 45.5 billion with 2031 projections showing USD 150.79 billion, growing at 22.1% CAGR over 2026-2031.
This report is Segmented by Type (Solutions, and Services), Deployment Mode (Cloud-Based, and On-Premise), System / Type (Inventory Management, Warehouse Management System (WMS), Fleet Management, and More), End-User Vertical (Retail and E-Commerce, Manufacturing, Automotive, Pharmaceuticals, and Life Sciences and More), and Geography. The Market Forecasts are Provided in Terms of Value (USD).
Global Digital Logistics Market Trends and Insights
Expansion of real-time IoT fleet telematics in North America
Connected telematics devices now stream engine health, driver behavior, and cargo data in real-time, enabling predictive maintenance that cuts downtime by 30% and fuel consumption by 15-20%. Logistics providers translate these gains into premium, guaranteed delivery windows that raise service levels while shrinking emissions. With IoT logistics spending expected to top USD 114.7 billion by 2032, fleet telematics has become a boardroom priority, particularly for carriers seeking to differentiate on sustainability.
AI-powered predictive warehouse analytics adoption by European 3PLs
European 3PLs combine machine-learning algorithms and computer vision to create digital twins of warehouses, unlocking inventory reductions of 20-30% without compromising fill rates. Scenario modelling helps operators pre-empt labor bottlenecks and reroute pick paths in minutes rather than hours. These capabilities underpin new value-added contracts that bundle demand forecasting with fulfillment, helping 3PLs move up the margin curve.
Under-investment in 5G corridors across Africa
Only 7% of key transport corridors have 5G coverage, limiting real-time visibility for cross-border hauls. Customs clearance averages 48-72 hours, compared to 4-6 hours in well-connected regions, which prolongs dwell times and increases inventory carry costs. Closing the gap requires an estimated USD 4.7 billion, a figure that exceeds current public-private commitments, though pilot corridors are starting to demonstrate productivity uplifts.
Other drivers and restraints analyzed in the detailed report include:
- Surge in same-day e-commerce fulfillment across Asia
- National green-freight digitalization incentives (Middle East)
- Fragmented data standards blocking cross-border APAC trade
For complete list of drivers and restraints, kindly check the Table Of Contents.
Segment Analysis
Digital logistics services contributed 32.65% to 2025 revenue, but their stronger 23.55% CAGR points to a growing preference for outsourced expertise. Companies short on in-house talent increasingly contract managed services to orchestrate system integration, data cleansing, and continuous optimization. Solutions still generate the remaining 67.35% of 2025 revenue and anchor many transformation roadmaps, yet buyers now expect modularity and open APIs rather than monolithic suites. Vendor success hinges on coupling a robust core platform with curated partner ecosystems that address specialized functions such as cold-chain validation or customs brokerage. Mid-market adopters illustrate the shift; 72% now favor service contracts over direct software ownership to avoid capex and accelerate ROI. Providers such as Tech Mahindra bundle low-code accelerators and AI toolkits, allowing clients to reconfigure workflows in days rather than quarters. This flexibility is crucial as regulations, demand patterns, and sustainability targets evolve. Solution vendors respond by unbundling modules and offering pay-as-you-scale commercial models, ensuring the digital logistics market continues to diversify.
Cloud platforms accounted for a 57.60% share of the digital logistics market in 2025 and are expected to grow at a 22.93% CAGR through 2031. Scalability, rapid deployment, and global accessibility make cloud architectures the default choice for omnichannel logistics networks. Companies report deployment cycles 35% faster and total cost of ownership 42% lower than on-premise alternatives, underscoring the economic rationale for migration. Security once hindered adoption, but enterprise-grade encryption, zero-trust frameworks, and sovereign cloud options have alleviated most concerns. Hybrid models persist in highly regulated verticals where data-residency rules apply, yet edge-to-cloud architectures now satisfy real-time processing demands without relinquishing governance. North America leads with 67% cloud adoption, closely followed by Europe at 63%. Emerging markets are catching up as bandwidth improves and hyperscalers launch new regional zones. On-premise deployments will continue to serve niche use cases involving ultra-low-latency robotics or proprietary legacy hardware, but their share of the digital logistics market size is projected to contract steadily.
Complete Report Scope:
- By Component
- Solutions
- Services
- By Deployment Mode
- Cloud-based
- On-premise
- By System / Type
- Inventory Management
- Warehouse Management System (WMS)
- Fleet Management
- Data Management and Analytics
- Tracking and Monitoring
- Other Types
- By End-user Vertical
- Retail and E-commerce
- Manufacturing
- Automotive
- Pharmaceuticals and Life Sciences
- Food and Beverage
- Oil and Gas and Energy
- Consumer Packaged Goods
- Other End-user Verticals
- By Geography
- North America
- United States
- Canada
- Mexico
- South America
- Brazil
- Argentina
- Rest of South America
- Europe
- United Kingdom
- Germany
- France
- Spain
- Italy
- Rest of Europe
- Asia-Pacific
- China
- India
- Japan
- Australia
- South Korea
- Rest of Asia-Pacific
- Middle East and Africa
- Middle East
- Saudi Arabia
- United Arab Emirates
- Turkey
- Rest of Middle East
- Africa
- South Africa
- Kenya
- Rest of Africa
- Middle East
- North America
Geography Analysis
North America commanded 37.55% of the digital logistics market revenue in 2025. Deep e-commerce penetration, widespread 5G rollouts and abundant venture funding nurture a vibrant ecosystem of SaaS providers, robotics firms and freight-tech start-ups. Eight in ten logistics operators plan to embed AI in at least one workflow by 2025, while regulators steadily open corridors for autonomous trucking trials.
Asia-Pacific is the growth engine, expanding at a 23.58% CAGR through 2031. China, India, and Southeast Asia underpin this trajectory with surging online consumption and ambitious national logistics corridors. Cross-border sellers benefit from duty-paid models and smart lockers, yet fragmented data standards inflate costs and curb small-business participation. Urban congestion prompts micro-fulfillment build-outs and two-wheel deliveries, whereas remote islands adopt drones to bridge infrastructure gaps. Europe blends advanced infrastructure with policy-driven sustainability. Carbon-linked road tolls and low-emission zones amplify demand for routing software and electric last-mile fleets. The region's 3PLs pioneer predictive warehouse analytics to counter labor shortages and rising wage bills. The Middle East channels sovereign funds into smart ports and rail links to diversify beyond oil. Africa's potential remains tied to 5G and customs modernization, while South America contends with talent deficits that inflate WMS implementation costs by 40%.
- SAP SE
- IBM Corporation
- Oracle Corporation
- Honeywell International Inc.
- Advantech Co. Ltd.
- Blue Yonder (Formerly JDA Software)
- Manhattan Associates Inc.
- Korber Supply Chain (HighJump)
- Tech Mahindra Ltd.
- Infosys Ltd.
- HCL Technologies Ltd.
- Amazon Web Services (AWS)
- DHL Group
- FedEx Corp.
- Cisco Systems Inc.
- Trimble Inc.
- Verizon Communications Inc.
- Bosch Software Innovations GmbH
- Maersk Digital
- Vinculum Group
- Hexaware Technologies Ltd.
Additional Benefits:
- The market estimate (ME) sheet in Excel format
- 3 months of analyst support
TABLE OF CONTENTS
1 INTRODUCTION
- 1.1 Study Assumptions and Market Definition
- 1.2 Scope of the Study
2 RESEARCH METHODOLOGY
3 EXECUTIVE SUMMARY
4 MARKET LANDSCAPE
- 4.1 Market Overview
- 4.2 Market Drivers
- 4.2.1 Expansion of Real-time IoT Fleet Telematics in North America
- 4.2.2 AI-powered Predictive Warehouse Analytics Adoption by European 3PLs
- 4.2.3 Surge in Same-day E-commerce Fulfilment Across Asia
- 4.2.4 National Green-Freight Digitalization Incentives (Middle East)
- 4.2.5 Automotive-OEM Direct-to-Consumer Digital Logistics Programs
- 4.2.6 Post-COVID Pharma Cold-Chain Digitization Mandates in Europe
- 4.3 Market Restraints
- 4.3.1 Under-investment in 5G Corridors across Africa
- 4.3.2 Fragmented Data-standards Blocking Cross-Border APAC Trade
- 4.3.3 Cyber-insurance Premium Spikes for Cloud-Logistics Platforms
- 4.3.4 Skilled-WMS-Talent Shortage in Latin America
- 4.4 Value Chain Analysis
- 4.5 Regulatory or Technological Outlook
- 4.6 Porter's Five Forces Analysis
- 4.6.1 Bargaining Power of Suppliers
- 4.6.2 Bargaining Power of Consumers
- 4.6.3 Threat of New Entrants
- 4.6.4 Intensity of Competitive Rivalry
- 4.6.5 Threat of Substitute Products
5 MARKET SIZE AND GROWTH FORECASTS (VALUE)
- 5.1 By Component
- 5.1.1 Solutions
- 5.1.2 Services
- 5.2 By Deployment Mode
- 5.2.1 Cloud-based
- 5.2.2 On-premise
- 5.3 By System / Type
- 5.3.1 Inventory Management
- 5.3.2 Warehouse Management System (WMS)
- 5.3.3 Fleet Management
- 5.3.4 Data Management and Analytics
- 5.3.5 Tracking and Monitoring
- 5.3.6 Other Types
- 5.4 By End-user Vertical
- 5.4.1 Retail and E-commerce
- 5.4.2 Manufacturing
- 5.4.3 Automotive
- 5.4.4 Pharmaceuticals and Life Sciences
- 5.4.5 Food and Beverage
- 5.4.6 Oil and Gas and Energy
- 5.4.7 Consumer Packaged Goods
- 5.4.8 Other End-user Verticals
- 5.5 By Geography
- 5.5.1 North America
- 5.5.1.1 United States
- 5.5.1.2 Canada
- 5.5.1.3 Mexico
- 5.5.2 South America
- 5.5.2.1 Brazil
- 5.5.2.2 Argentina
- 5.5.2.3 Rest of South America
- 5.5.3 Europe
- 5.5.3.1 United Kingdom
- 5.5.3.2 Germany
- 5.5.3.3 France
- 5.5.3.4 Spain
- 5.5.3.5 Italy
- 5.5.3.6 Rest of Europe
- 5.5.4 Asia-Pacific
- 5.5.4.1 China
- 5.5.4.2 India
- 5.5.4.3 Japan
- 5.5.4.4 Australia
- 5.5.4.5 South Korea
- 5.5.4.6 Rest of Asia-Pacific
- 5.5.5 Middle East and Africa
- 5.5.5.1 Middle East
- 5.5.5.1.1 Saudi Arabia
- 5.5.5.1.2 United Arab Emirates
- 5.5.5.1.3 Turkey
- 5.5.5.1.4 Rest of Middle East
- 5.5.5.2 Africa
- 5.5.5.2.1 South Africa
- 5.5.5.2.2 Kenya
- 5.5.5.2.3 Rest of Africa
- 5.5.5.1 Middle East
- 5.5.1 North America
6 COMPETITIVE LANDSCAPE
- 6.1 Market Concentration
- 6.2 Strategic Moves
- 6.3 Market Share Analysis
- 6.4 Company Profiles (includes Global level Overview, Market level overview, Core Segments, Financials as available, Strategic Information, Market Rank/Share, Products and Services, Recent Developments)
- 6.4.1 SAP SE
- 6.4.2 IBM Corporation
- 6.4.3 Oracle Corporation
- 6.4.4 Honeywell International Inc.
- 6.4.5 Advantech Co. Ltd.
- 6.4.6 Blue Yonder (Formerly JDA Software)
- 6.4.7 Manhattan Associates Inc.
- 6.4.8 Korber Supply Chain (HighJump)
- 6.4.9 Tech Mahindra Ltd.
- 6.4.10 Infosys Ltd.
- 6.4.11 HCL Technologies Ltd.
- 6.4.12 Amazon Web Services (AWS)
- 6.4.13 DHL Group
- 6.4.14 FedEx Corp.
- 6.4.15 Cisco Systems Inc.
- 6.4.16 Trimble Inc.
- 6.4.17 Verizon Communications Inc.
- 6.4.18 Bosch Software Innovations GmbH
- 6.4.19 Maersk Digital
- 6.4.20 Vinculum Group
- 6.4.21 Hexaware Technologies Ltd.
7 MARKET OPPORTUNITIES AND FUTURE OUTLOOK
- 7.1 White-space and Unmet-need Assessment

 數位物流管理系統市場:全球市場預測(2026-2032年)數位物流市場:按組件、解決方案類型、部署模式、企業規模和最終用戶產業分類-2026-2032年全球市場預測
 低溫運輸數位化物流市場預測-全球分析(按組件、運輸方式、技術、應用、最終用戶和地區分類)——2034年
 數位物流市場:按行業和地區分類
 2026年全球數位物流市場報告
 數位物流市場規模、佔有率、成長及全球產業分析:按類型、應用和地區分類的洞察,2026-2034 年預測
 數位物流市場規模、佔有率和成長分析(按組件、物流類型、技術、最終用戶產業和地區分類)-2026-2033年產業預測
 數位物流市場-全球產業規模、佔有率、趨勢、機會和預測,依部署方式、系統、地區和競爭格局分類,2020-2030年預測2032 年數位物流市場預測:按組件、部署類型、組織規模、技術、應用、最終用戶和地區進行的全球分析
 數位物流的全球市場的評估:各解決方案,各用途,各部署方式,各終端用戶,各地區,機會,預測(2018年~2032年)