


 |
市場調查報告書
商品編碼
2113642
油井干預:市場佔有率分析、產業趨勢與統計、成長預測(2026-2031 年)Well Intervention - Market Share Analysis, Industry Trends & Statistics, Growth Forecasts (2026 - 2031) |
||||||

※ 本網頁內容可能與最新版本有所差異。詳細情況請與我們聯繫。
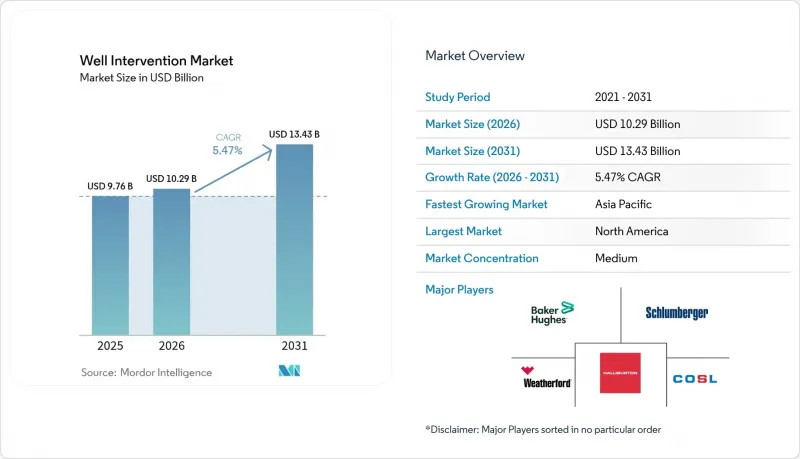
據 Mordor Intelligence 稱,2025 年油井干預市場價值為 97.6 億美元,預計到 2031 年將達到 134.3 億美元,而 2026 年為 102.9 億美元,預測期(2026-2031 年)的複合年成長率為 5.47%。
本報告按部署區域(陸上和海上)、服務類型(測井和海底勘測、增產處理等)、干預類型(輕度、中度、重度/修井)、井類型(水平井和垂直井)、井深(淺井、深井(400-1500米)和超深海)以及地區(北美、歐洲、亞太地區等分類。
全球油井干預市場趨勢及洞察
成熟陸上油井的改造需求日益成長
北美和歐洲的業者正透過優先進行修井作業而非新鑽井來延長資產壽命。在2010年至2015年頁岩油氣繁榮時期鑽探的油井需要對其自流井開採系統進行升級、增產和機械維修。與在成熟油田鑽探新井所能實現的5%至10%的增產相比,這些措施通常可將產量提高20%至30%。貝克休斯公司計畫在2024年完成超過15,000套自流井開採裝置的安裝,其中60%位於北美陸上盆地。與延長資產壽命相關的定期維護工作為服務供應商提供了穩定的收入,並鞏固了營運商的資本紀律和最大化現有基礎設施收益的策略。
深海與超深海開發擴張
超深水專案作業深度超過1500米,其特點是技術複雜性更高,服務費用也更高。雪佛龍公司在墨西哥灣的「Anchor」計畫(壓力達20000磅/平方英吋)就是一個典型的例子,該計畫需要使用專門的設備才能安全且有效率地進行干預作業。深水作業的服務價格比淺水作業高出40%至60%。巴西石油公司與SLB公司簽訂了一份價值18億美元的契約,計劃於2024年對整個鹽層下下層進行深水干預作業,這表明巴西對複雜的近海油田開發投入巨大。雖然一些改進的干預技術透過取代極其昂貴的鑽井船來降低成本風險,但深水領域的進入門檻仍然有利於擁有綜合能力體系的成熟跨國公司。
原油價格波動抑制了油氣探勘開發資本投資週期。
當油價跌破每桶55美元時,由於業者延後非必要項目,干預預算會被削減15%至25%。 2024年,海上鑽機運轉率下降,顯示現貨價格與非必要干預工作的範圍之間有直接關聯。業務收益會根據商業週期波動高達40%,迫使服務提供者控制成本並維持靈活的人員配置。在商品價格穩定之前,基於自由現金流指標的資本紀律仍將是油井干預市場成長的主要限制因素。
細分市場分析
預計到2025年,海上油井干預業務將實現強勁成長,其中深水和超深水油井將推高溢價,該領域預計到2031年將以6.78%的複合年成長率成長。這些高規格項目在油井干預市場中佔有重要佔有率,其服務價格通常比同等陸上作業高出40%至60%。以Expro公司的AX-S系統為代表的無立管輕型油井干預船,僅需6至8天即可完成海上作業,而傳統鑽井鑽機支援則需要15至20天。營運商優先考慮減少停機時間和透過精簡人員來提高安全性,這推動了海上作業需求,儘管其資本密集度較高。
即使到了2025年,陸上作業仍將維持主導地位,佔73.25%的市場。這是因為數以千計的老舊頁岩油井需要定期進行修井作業、更換人工採油設備以及更新增產措施。低廉的單位成本和良好的作業條件使得頻繁的作業成為可能,而改進的連續油管設備與傳統方法相比,已使作業成本降低了20%至30%。隨著能源需求的加速成長和國內資源開發的推進,繼北美之後,亞太地區和拉丁美洲正在崛起為活躍的陸上油氣中心。
預計到2031年,增產處理服務的複合年成長率將達到7.35%,位居成長率榜首。乳化酸、拉鍊式壓裂和Simulflax等技術進步提高了接觸效率,同時降低了所需的功率。貝克休斯公司的「OptiPort」技術已證明可改善丙烷分配並減少地面設備的面積。當大宗商品價格足以支持進一步增產時,業者會優先考慮這些高效益的處理服務。
測井和井底探勘服務佔據31.90%的市場佔有率,因為儲存成像和機械診斷仍然是有效干預計畫的先決條件。光纖傳輸和即時分析縮短了決策週期,使作業團隊能夠立即在現場調整作業。人工採油、修井和打撈以及油層隔離等特色服務,透過解決因產量下降或設備故障而產生的特定地下難題,豐富了服務組合。
區域分析
到2025年,北美將佔據油井干預市場38.95%的佔有率。這主要得益於持續高企的服務需求,而高產頁岩盆地、嚴格的甲烷排放法規以及墨西哥灣的深水資產是推動這一需求成長的主要因素。業者正利用數位化滑線、即時光纖工具和自主機器人,在滿足嚴格的環保標準的同時,將效率提高20%至30%。定期進行的壓裂作業能夠維持加壓泵送設備的運轉率,即使新鑽井活動放緩也能確保其正常運作。
歐洲緊隨其後,成為一個成熟而活躍的市場,其中心位於北海。在挪威和英國,鼓勵對報廢資產進行最佳化,而向二氧化碳捕集與儲存(CCS)的轉型正在催生新的干預需求。嚴格的ESG政策已將甲烷管理和油井健康管理列為首要營運重點,並大力推廣技術密集型服務合約。
亞太地區是油井干預市場成長最快的地區,預計到2031年將以6.28%的複合年成長率成長。東南亞強勁的能源需求、政府的支持性政策以及雄心勃勃的海上天然氣計畫正在推動先進的干預技術應用。中國對陸上鑽井鑽機的強勁需求以及印度上游產業的自由化正在擴大市場規模,而澳洲成熟的海上油田也需要先進的干預技術來維護其液化天然氣出口基礎設施。
其他好處:
- Excel格式的市場預測(ME)表
- 3個月的分析師支持
目錄
第1章:引言
- 研究假設和市場定義
- 調查範圍
第2章:調查方法
第3章執行摘要
第4章 市場狀況
- 市場概覽
- 市場促進因素
- 成熟陸上油井的工作量需求不斷增加
- 深海與超深海開發擴張
- 北美頁岩油產業的復甦正在推動對再次壓裂作業的需求。
- 甲烷洩漏的強制性糾正措施
- 引進數位滑線和自主式地下機器人
- 向新興捕碳封存(CCS)井的轉換
- 市場限制因素
- 原油價格波動抑制了探勘與生產(E&P)的資本投資週期。
- 對迴歸建構方法的偏好日益成長
- 由於環境、社會及公司治理(ESG)因素,資本從油氣產業外流。
- 供應鏈分析
- 監理情勢
- 技術展望
- 未來計畫開展的主要上游項目
- 波特五力模型
第5章 市場規模與成長預測
- 按部署位置
- 陸上
- 離岸
- 按服務類型
- 測井和井底調查
- 刺激
- 人工採油
- 作業和捕魚
- 其他(區域隔離、防止沙土侵入等)
- 按干預類型
- 輕型(滑線、E線、CT)
- 中等的
- 體重/鍛煉
- 按井類型
- 水平井
- 垂直井
- 按井深
- 淺水區(水深小於400公尺)
- 深海(400-1500公尺)
- 超深海(超過1500公尺)
- 按地區
- 北美洲
- 美國
- 加拿大
- 墨西哥
- 歐洲
- 英國
- 挪威
- 德國
- 俄羅斯
- 其他歐洲國家
- 亞太地區
- 中國
- 印度
- 日本
- 東南亞國協
- 澳洲
- 其他亞太國家
- 南美洲
- 巴西
- 阿根廷
- 其他南美國家
- 中東和非洲
- 沙烏地阿拉伯
- 阿拉伯聯合大公國
- 卡達
- 南非
- 其他中東和非洲國家
- 北美洲
第6章 競爭情勢
- 市場集中度
- 策略趨勢(併購、聯盟、購電協議)
- 市場佔有率分析(主要公司的市場排名和佔有率)
- 公司簡介
- Schlumberger Limited
- Halliburton Company
- Baker Hughes Company
- Weatherford International plc
- Expro Group Holdings NV
- National Oilwell Varco Inc.
- Vallourec SA
- Scientific Drilling International
- China Oilfield Services Ltd(COSL)
- Helix Energy Solutions Group Inc.
- Archer Ltd.
- Welltec A/S
- Superior Energy Services Inc.
- Trican Well Service Ltd.
- Aker Solutions ASA
- Altus Intervention AS
- Hunting PLC
- TechnipFMC plc
- Petrofac Ltd.
- Oceaneering International Inc.
第7章 市場機會與未來展望
According to Mordor Intelligence, the well intervention market size was valued at USD 9.76 billion in 2025 and estimated to grow from USD 10.29 billion in 2026 to reach USD 13.43 billion by 2031, at a CAGR of 5.47% during the forecast period (2026-2031).
This report is Segmented by Location of Deployment (Onshore and Offshore), Service Type (Logging and Bottom-Hole Survey, Stimulation, and More), Intervention Type (Light, Medium, and Heavy/Workover), Well Type (Horizontal Wells and Vertical Wells), Well Depth (Shallow Water, Deep Water (400 To 1500 M), and Ultra-Deep Water ), and Geography (North America, Europe, Asia Pacific, South America, and More).
Global Well Intervention Market Trends and Insights
Rising Workover Demand from Maturing Onshore Wells
North American and European operators stretch asset life cycles by prioritizing workover programs over fresh drilling. Wells drilled during the 2010-2015 shale expansion need artificial-lift upgrades, stimulation, and mechanical repairs that typically secure 20-30% production uplifts versus 5-10% gains from drilling new wells in mature fields. Baker Hughes completed more than 15,000 artificial-lift installations in 2024, 60% of which were in North American onshore basins. Recurring interventions across extended asset life cycles offer steady revenue to service providers and underscore operators' capital discipline and return-on-existing-infrastructure strategies.
Escalation of Deep- and Ultra-Deep-Water Developments
Ultra-deep-water projects beyond 1,500 m depth are raising technical complexity and service premiums. Chevron's 20,000 psi Anchor project in the Gulf of Mexico illustrates the specialized equipment needed to execute interventions safely and efficiently. Service prices in deep water stand 40-60% above shallow-water rates. Petrobras awarded SLB a USD 1.8 billion deep-water intervention contract across pre-salt fields in 2024, signaling robust investment in complex offshore plays. Rigless intervention technologies mitigate cost exposure by replacing ultra-expensive drillships, but deep-water barriers to entry still favor established multinationals with integrated capability suites.
Crude-Price Volatility Curbing E&P Capex Cycles
Every dip below USD 55 per barrel triggers 15-25% cuts in intervention budgets as operators defer non-essential projects. Offshore rig utilization slipped in 2024, revealing a direct link between spot pricing and discretionary intervention work scopes. Service revenues swing by up to 40% across cycles, forcing providers to manage cost bases and maintain flexible crews. Capital discipline anchored on free-cash-flow metrics remains a primary check on well intervention market growth until commodity prices stabilize.
Other drivers and restraints analyzed in the detailed report include:
- Shale Revival in North America Fuelling Re-fracturing Jobs
- Mandated Methane-Leak Remediation Interventions
- Growing Preference for Rigless Completions
For complete list of drivers and restraints, kindly check the Table Of Contents.
Segment Analysis
Offshore interventions generated robust revenue in 2025, and the segment is positioned for a 6.78% CAGR through 2031 as deep-water and ultra-deep-water wells drive premium-rate work. These high-specification projects underpin a sizeable portion of the well intervention market, and service prices often sit 40-60% above onshore equivalents. Riserless-light-well-intervention vessels, typified by Expro's AX-S system, can finish offshore jobs in 6-8 days versus 15-20 days for conventional rig support. Operators value reduced downtime and safer crew counts, reinforcing offshore demand despite elevated capital intensity.
Onshore operations still dominate with a 73.25% share in 2025 because thousands of aging shale wells need periodic workovers, artificial-lift changes, and stimulation refresh cycles. Lower unit costs and greater accessibility allow frequent interventions, and upgraded coiled-tubing units shave 20-30% from historical service bills. Asia Pacific and Latin America join North America as active onshore hubs as energy demand and domestic resource development accelerate.
Stimulation services rule the growth table with a forecast 7.35% CAGR through 2031. Advances such as emulsified acids, zipper fracturing, and simul-frac enhance contact efficiency while lowering horsepower requirements; Baker Hughes' OptiPort technology demonstrates better proppant distribution and reduced surface equipment footprint. Operators prioritize these high-impact treatments when commodity prices justify the incremental uplift.
Logging and bottom-hole survey services preserve a 31.90% share because reservoir imaging and mechanical diagnostics remain prerequisites for effective intervention planning. Fiber-optic conveyance and real-time analytics shorten decision loops, letting crews adjust operations on the fly. Artificial-lift, workover and fishing, and niche services such as zonal isolation round out portfolios by solving specific down-hole challenges that surface during production declines or equipment failures.
Complete Report Scope:
- By Location of Deployment
- Onshore
- Offshore
- By Service Type
- Logging and Bottom-hole Survey
- Stimulation
- Artificial Lift
- Workover and Fishing
- Others (Zonal Isolation, Sand Control etc.)
- By Intervention Type
- Light (Slickline, E-line, CT)
- Medium
- Heavy/Workover
- By Well Type
- Horizontal wells
- Vertical wells
- By Well Depth
- Shallow Water (Below 400 m)
- Deep Water (400 to 1,500 m)
- Ultra-Deep Water (Above 1,500 m)
- By Geography
- North America
- United States
- Canada
- Mexico
- Europe
- United Kingdom
- Norway
- Germany
- Russia
- Rest of Europe
- Asia Pacific
- China
- India
- Japan
- ASEAN Countries
- Australia
- Rest of Asia Pacific
- South America
- Brazil
- Argentina
- Rest of South America
- Middle East and Africa
- Saudi Arabia
- United Arab Emirates
- Qatar
- South Africa
- Rest of Middle East and Africa
- North America
Geography Analysis
North America held 38.95% of the well intervention market in 2025 as prolific shale basins, tough methane regulations, and deep-water Gulf of Mexico assets combine to sustain high service intensity. Operators leverage digital slickline, real-time fiber-optic tools, and autonomous robotics to improve efficiency by 20-30% while meeting stringent environmental standards. Recurring refrac campaigns maintain capacity utilization for pressure pumping fleets even when fresh drilling slows.
Europe follows with a mature yet active theater anchored by the North Sea. Norway and the UK incentivize late-life asset optimization, and carbon-capture storage conversions add fresh intervention demand streams. Stringent ESG policies elevate methane remediation and well-integrity management to core operating priorities, prompting technology-heavy service contracts.
Asia Pacific is the fastest-growing well intervention market fastest-growing region, set for a 6.28% CAGR through 2031. Strong energy demand, supportive government policies, and ambitious offshore gas projects in Southeast Asia spur the deployment of advanced intervention technologies. China's voracious land rig appetite and India's upstream liberalization add scale, while Australia's mature offshore fields require sophisticated interventions to sustain LNG export infrastructure.
- Schlumberger Limited
- Halliburton Company
- Baker Hughes Company
- Weatherford International plc
- Expro Group Holdings NV
- National Oilwell Varco Inc.
- Vallourec SA
- Scientific Drilling International
- China Oilfield Services Ltd (COSL)
- Helix Energy Solutions Group Inc.
- Archer Ltd.
- Welltec A/S
- Superior Energy Services Inc.
- Trican Well Service Ltd.
- Aker Solutions ASA
- Altus Intervention AS
- Hunting PLC
- TechnipFMC plc
- Petrofac Ltd.
- Oceaneering International Inc.
Additional Benefits:
- The market estimate (ME) sheet in Excel format
- 3 months of analyst support
TABLE OF CONTENTS
1 Introduction
- 1.1 Study Assumptions & Market Definition
- 1.2 Scope of the Study
2 Research Methodology
3 Executive Summary
4 Market Landscape
- 4.1 Market Overview
- 4.2 Market Drivers
- 4.2.1 Rising workover demand from maturing onshore wells
- 4.2.2 Escalation of deep- and ultra-deep-water developments
- 4.2.3 Shale revival in North America fuelling re-fracturing jobs
- 4.2.4 Mandated methane-leak remediation interventions
- 4.2.5 Adoption of digital slickline & autonomous down-hole robots
- 4.2.6 Emerging carbon-capture & storage (CCS) well conversions
- 4.3 Market Restraints
- 4.3.1 Crude-price volatility curbing E&P capex cycles
- 4.3.2 Growing preference for rigless completions
- 4.3.3 ESG-driven capital flight from hydrocarbons
- 4.4 Supply-Chain Analysis
- 4.5 Regulatory Landscape
- 4.6 Technological Outlook
- 4.7 Major Upcoming Upstream Projects
- 4.8 Porter's Five Forces
- 4.8.1 Bargaining Power of Suppliers
- 4.8.2 Bargaining Power of Buyers
- 4.8.3 Threat of New Entrants
- 4.8.4 Threat of Substitute Products & Services
- 4.8.5 Intensity of Competitive Rivalry
5 Market Size & Growth Forecasts
- 5.1 By Location of Deployment
- 5.1.1 Onshore
- 5.1.2 Offshore
- 5.2 By Service Type
- 5.2.1 Logging and Bottom-hole Survey
- 5.2.2 Stimulation
- 5.2.3 Artificial Lift
- 5.2.4 Workover and Fishing
- 5.2.5 Others (Zonal Isolation, Sand Control etc.)
- 5.3 By Intervention Type
- 5.3.1 Light (Slickline, E-line, CT)
- 5.3.2 Medium
- 5.3.3 Heavy/Workover
- 5.4 By Well Type
- 5.4.1 Horizontal wells
- 5.4.2 Vertical wells
- 5.5 By Well Depth
- 5.5.1 Shallow Water (Below 400 m)
- 5.5.2 Deep Water (400 to 1,500 m)
- 5.5.3 Ultra-Deep Water (Above 1,500 m)
- 5.6 By Geography
- 5.6.1 North America
- 5.6.1.1 United States
- 5.6.1.2 Canada
- 5.6.1.3 Mexico
- 5.6.2 Europe
- 5.6.2.1 United Kingdom
- 5.6.2.2 Norway
- 5.6.2.3 Germany
- 5.6.2.4 Russia
- 5.6.2.5 Rest of Europe
- 5.6.3 Asia Pacific
- 5.6.3.1 China
- 5.6.3.2 India
- 5.6.3.3 Japan
- 5.6.3.4 ASEAN Countries
- 5.6.3.5 Australia
- 5.6.3.6 Rest of Asia Pacific
- 5.6.4 South America
- 5.6.4.1 Brazil
- 5.6.4.2 Argentina
- 5.6.4.3 Rest of South America
- 5.6.5 Middle East and Africa
- 5.6.5.1 Saudi Arabia
- 5.6.5.2 United Arab Emirates
- 5.6.5.3 Qatar
- 5.6.5.4 South Africa
- 5.6.5.5 Rest of Middle East and Africa
- 5.6.1 North America
6 Competitive Landscape
- 6.1 Market Concentration
- 6.2 Strategic Moves (M&A, Partnerships, PPAs)
- 6.3 Market Share Analysis (Market Rank/Share for key companies)
- 6.4 Company Profiles (includes Global level Overview, Market level overview, Core Segments, Financials as available, Strategic Information, Products & Services, and Recent Developments)
- 6.4.1 Schlumberger Limited
- 6.4.2 Halliburton Company
- 6.4.3 Baker Hughes Company
- 6.4.4 Weatherford International plc
- 6.4.5 Expro Group Holdings NV
- 6.4.6 National Oilwell Varco Inc.
- 6.4.7 Vallourec SA
- 6.4.8 Scientific Drilling International
- 6.4.9 China Oilfield Services Ltd (COSL)
- 6.4.10 Helix Energy Solutions Group Inc.
- 6.4.11 Archer Ltd.
- 6.4.12 Welltec A/S
- 6.4.13 Superior Energy Services Inc.
- 6.4.14 Trican Well Service Ltd.
- 6.4.15 Aker Solutions ASA
- 6.4.16 Altus Intervention AS
- 6.4.17 Hunting PLC
- 6.4.18 TechnipFMC plc
- 6.4.19 Petrofac Ltd.
- 6.4.20 Oceaneering International Inc.
7 Market Opportunities & Future Outlook
- 7.1 White-space & Unmet-need Assessment

 油井干預市場:按服務、應用、類別和地區分類
 油氣井作業用有線壓力控制設備:市場佔有率分析、產業趨勢與統計及成長預測(2026-2031 年)隨鑽測井(LWD):市場佔有率分析、行業趨勢和統計數據、成長預測(2026-2031 年)
 油井干預市場:2026-2032年全球市場預測(依干預方法、服務類型、油井類型和應用分類)
 油井干預市場報告:按服務類型、油井類型、應用和地區分類(2026-2034 年)
 2026年全球油井干預市場報告
 全球油井修復市場規模、佔有率、趨勢和成長分析報告(2026-2034年)
 區域架構:智慧型執行器(微型馬達)子場景應用趨勢(2026)
 油井干預市場規模、佔有率和趨勢分析報告:按應用、干預類型、服務、地區和細分市場預測,2026-2033年
 油井干預服務市場-全球產業規模、佔有率、趨勢、機會、預測:按干預類型、服務、應用、地區和競爭格局分類,2021-2031年