

 |
市場調查報告書
商品編碼
2113441
工業機器人:市場佔有率分析、產業趨勢與統計、成長預測(2026-2031)Industrial Robotics - Market Share Analysis, Industry Trends & Statistics, Growth Forecasts (2026 - 2031) |
||||||

※ 本網頁內容可能與最新版本有所差異。詳細情況請與我們聯繫。
根據 Mordor Intelligence 預測,工業機器人市場規模預計在 2026 年達到 542.8 億美元,到 2031 年達到 943.8 億美元,在預測期內以 11.7% 的複合年成長率成長。
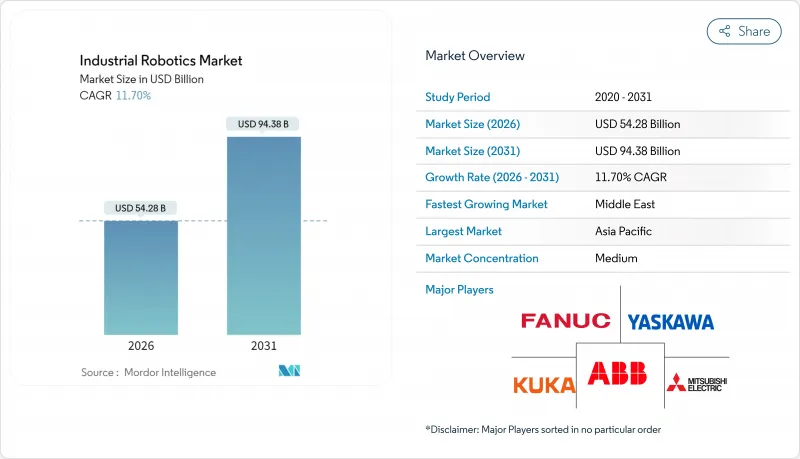
本報告按機器人類型(關節型機器人、線性機器人、 SCARA機器人、協作機器人等)、承重能力(15公斤以下、16-225公斤、其他)、應用領域(物料輸送和包裝等)、終端用戶行業(汽車、電氣和電子等)以及地區進行細分。市場規模和預測均以美元計價。
全球工業機器人市場趨勢與洞察
人事費用上升和勞動力老化
在經合組織成員國,2020年至2025年間,製造業工資增速平均每年比消費價格增速高出1.8個百分點,這給勞動密集型組裝流程的利潤率帶來壓力,並促使企業轉向能夠更快獲得回報的自動化生產。同期,日本勞動年齡人口減少了620萬,促使汽車業的一級供應商引入協作式夜班制度以彌補勞動力短缺。在德國,預計到2025年將出現42萬個技術崗位的缺口,這加速了關節式焊接機器人的普及,此前這種機器人對於中型工廠來說成本過高。在美國,預計到2030年製造業工人缺口將達到210萬,為此推出了一項聯邦稅額扣抵,相當於指定領域合格的自動化投資額的30%。 2025年,韓國推出了一項制度,如果關鍵職業的人員離職率超過40%,則補貼機器人實施成本的一半,並將中小型製造商的補貼額度提高了一倍。
利用人工智慧和工業物聯網的智慧工廠正在迅速普及
整合到機器人控制器中的邊緣處理器目前可執行封閉回路型最佳化,使汽車噴漆線和製藥塗層線的缺陷率降低高達 18%。數位孿生模擬平均縮短了 28 天的試運行週期,並將整合工作量減少了近五分之一。預測性維護可在故障發生前 72 小時檢測到軸承磨損,使高產運轉率工廠車身車間的意外停機時間減少了 41%。 IIC-PUB-G1 指南將 OPC UA 標準化為機器人和 PLC 之間的通訊協議,最終實現了與供應商無關的單元編配。到 2025 年,利用卷積類神經網路的機器視覺在電子產品檢測中將達到 98.4% 的準確率,在每分鐘 600 台的生產線速度下,其性能優於人工檢測員。
中小企業的大額初始資本投資
一套完整的六軸單元,包括防護裝置和末端執行器(EOAT),成本在 18 萬至 32 萬美元之間,對於年銷售額低於 1500 萬美元的公司而言,這相當於其年度資本支出預算的 70%。雖然透過「機器人即服務 (RaaS)」租賃可以降低初始成本,但每月 1800 至 3200 美元的費用超過了墨西哥、越南和印度一個班次的人事費用。根據歐洲投資銀行 (EIB) 的數據,到 2025 年,中小企業提交的自動化貸款申請中,62% 將因抵押品不足而被拒絕,這成為歐洲自動化普及的一大瓶頸。雖然在美國和德國,加速折舊允許在第一年全額累計費用,但對於EBITDA獲利率低於 15% 的公司而言,現金流仍面臨限制。售價在 30,000 美元到 50,000 美元之間的協作機器人雖然很有用,但其 10-15 公斤的有效載荷能力使其不適合重型焊接或金屬成型。
細分市場分析
到2025年,關節型機器人仍將佔據工業機器人市場62.52%的佔有率,這反映了它們在焊接、噴塗和碼垛等廣泛應用領域的多功能性。儘管關節型機器人在汽車和機械行業仍保持主導地位,但預計到2031年,協作機器人將以12.92%的複合年成長率超越關節型協作機器人,因為工廠越來越傾向於採用無需圍欄且可重新定位的、對人友好的生產單元。協作機器人在後端取放和小批量組裝的應用日益廣泛,快速重編程功能將設定時間縮短至20分鐘以內。笛卡爾座標機器人和龍門機器人在安裝超大型航太面板和擋風玻璃方面仍然發揮著重要作用,而SCARA機器人和Delta機器人憑藉其低於0.4秒的循環時間,在電子產品和食品分類等細分市場中保持著領先地位。在傳統的機械搬運領域,圓柱形單元的市場佔有率正在下降,因為鉸接式單元現在以相似的價格提供了類似的搬運範圍。
ABB的「GoFa」承重能力12公斤,速度為2.2公尺/秒,在中距離作業領域可與關節型機器人競爭。安川馬達的「HC系列」機器人整合了視覺系統和力感測器,而這些功能先前需要第三方套件才能實現。由於ISO/TS 15066標準對接觸力有所限制,軟體發揮至關重要的作用,能夠調整動態關節限位以平衡安全性和生產效率的供應商將成為差異化優勢。預計在預測期內,協作機器人將在35%的新生產線上部署,尤其是在電子設備組裝和醫療設備套件組裝等領域,由於這些領域的日產量波動較大,協作機器人的應用預計將會迅速普及。同時,由於關節型機器人承重能力和防爆要求,它們在重型焊接和噴漆車間仍然佔據主導地位。
重量在16至225公斤之間的中型機器人,在2025年佔出貨量的49.54%,這主要歸功於它們在汽車車身本體製造領域的廣泛應用。然而,預計到2031年,重量低於15公斤的機器人將達到13.72%的複合年成長率,這得益於小型化伺服驅動器打造的纖細機械臂,它們適用於電子和製藥生產線等狹小空間。協作機器人在該重量級別中佔據主導地位,佔出貨量的68%,因為ISO/TS 15066標準允許在施加力小於150牛頓的情況下進行無圍欄運作。智慧型手機和穿戴式裝置產量的不斷成長,正在加速對±0.01毫米重複精度要求極高的領域的需求。重量在226至500公斤之間的機器人則用於底盤升降和航太夾具。重量超過 500 公斤的機器人仍然是一個小眾市場,但對於協助處理超過 1 噸的負載的印刷工作以及搬運風力渦輪機葉片來說,它們是不可或缺的。
到2025年,電子組裝產業將佔輕量機器人需求的58%,這主要得益於亞秒級的放置週期。在處理藥品管瓶,需要使用5-10千噸的不鏽鋼機器人,以滿足ISO 14644 5級無塵室標準。電池模組生產線採用50-100千噸的機器人,其螺栓連接精度可達0.05毫米,以避免熱失控的風險。在食品加工產業,重量小於3公斤的Delta臂機器人因其每分鐘超過200次的抓取速度而備受青睞,並採用IP65防護等級、耐化學腐蝕的機殼。預計重量超過500公斤的重型機械手臂市場佔有率將會下降,因為系統整合商會用同步運行的中型機器人叢集來替代它們,從而簡化維護和備件管理。
區域分析
到2025年,亞太地區將佔全球銷售額的44.36%,其中中國本土製造商佔據了52%的國內裝機量,這得益於一項補貼計劃,該計劃可覆蓋高達40%的機器人成本。在日本,自動化正在彌補勞動力減少的缺口,使其機器人部署密度達到全球最高水平,每萬名工人擁有399台機器人。在印度,一項基於生產的獎勵計劃為提高生產效率提供4-6%的返利,從而刺激了智慧型手機和家電工廠採用輕型協作機器人。
到2025年,北美將佔工業機器人市場26%的佔有率,其中美國工廠的出貨量佔該地區總出貨量的78%。這主要得益於《晶片和工業產品法案》(CHIPS Act)的津貼以及關稅壓力,這些因素推動了當地半導體晶圓製造廠和電動車工廠採用機器人。墨西哥一項價值280億美元的近岸外包投資仰賴關節型機器人,以滿足美墨加協定(USMCA)的標準,同時維持成本優勢。加拿大的策略創新基金已撥款21億加幣用於先進製造業,強制要求在電池生產線上引入協作機器人。
到2025年,歐洲將佔全球銷售額的21%,其中德國將主導。在「數位轉型」(Digital Now)補貼計畫的支持下,德國將佔歐洲大陸所有安裝量的38%。義大利和法國緊追在後,這兩個國家的工資結構使得投資回收期不到20個月。更嚴格的網路安全法規,特別是強制性的ISO/IEC 62443標準,迫使買家優先選擇擁有強大控制器的供應商,間接增加了轉換成本。
到2025年,中東僅佔全球市場規模的4%,但預計其複合年成長率將高達12.22%,成為成長最快的地區。這主要得益於沙烏地阿拉伯的“2030願景”,該計劃將投資3.2兆美元用於非石油生產能力建設;以及阿拉伯聯合大公國強制要求到2031年實現50%的生產在地化。政府營運的工業園區提供自動化設備的免息貸款,而且機器人的成本與外籍勞工相比具有競爭力。到2025年,南美和非洲合計將佔全球市場規模的9%,但由於資金籌措模式要求40-50%的首付以及一體化運營商網路薄弱,機器人的普及仍然受到阻礙。儘管如此,智利鋰業和巴西農產品企業的先導計畫表明,市場對具備清洗功能和高負載能力的機器人需求正在不斷成長。
其他好處:
- Excel格式的市場預測(ME)表
- 3個月的分析師支持
目錄
第1章:引言
- 研究假設和市場定義
- 調查範圍
第2章:調查方法
第3章執行摘要
第4章 市場狀況
- 市場概覽
- 市場促進因素
- 人事費用上升和勞動力老化
- 利用人工智慧和工業物聯網的智慧工廠正在迅速普及
- 政府對自動化設備投資的補貼(中國、韓國、德國)
- 受關稅影響,製造業回流美國正在推動自動化投資。
- 推動ESG(環境、社會與治理)轉型為節能、低碳機器人
- 加速折舊制度正在推動「機器人即服務」的發展。
- 市場限制因素
- 對中小企業的大額初始資本投資
- 機器人整合人員短缺
- 網路化生產單元中的網路安全責任
- 稀土元素伺服馬達供應的波動性
- 產業價值鏈分析
- 監理情勢
- 技術展望
- 宏觀經濟因素對市場的影響
- 波特五力分析
第5章 市場規模與成長預測
- 按機器人類型
- 關節機器人
- SCARA機器人
- 笛卡兒/龍門式機器人
- 並聯/ Delta機器人
- 圓柱座標式機器人
- 協作機器人(cobots)
- 按有效載荷能力
- 15公斤或以下
- 16~225 kg
- 226~500 kg
- 500公斤或以上
- 透過使用
- 物料輸送和包裝
- 焊接和釬焊
- 組裝和塗層
- 自動化機器操作和CNC
- 油漆和塗層
- 品質檢驗
- 按最終用戶行業分類
- 車
- 電氣和電子設備
- 食品/飲料
- 機械和金屬
- 藥品和醫療保健
- 建築材料
- 其他終端用戶產業
- 按地區
- 北美洲
- 美國
- 加拿大
- 墨西哥
- 南美洲
- 巴西
- 阿根廷
- 其他南美國家
- 歐洲
- 德國
- 英國
- 法國
- 義大利
- 俄羅斯
- 其他歐洲國家
- 亞太地區
- 中國
- 日本
- 韓國
- 印度
- 其他亞太國家
- 中東
- GCC
- 土耳其
- 其他中東國家
- 非洲
- 南非
- 其他非洲國家
- 北美洲
第6章 競爭情勢
- 市場集中度
- 策略趨勢
- 市佔率分析
- 公司簡介
- ABB Ltd.
- FANUC Corporation
- Yaskawa Electric Corp.
- KUKA AG
- Mitsubishi Electric Corp.
- Kawasaki Heavy Industries(Robotics)
- DENSO Corporation
- Omron Corporation
- Panasonic Corp.
- Epson Robots
- Staubli Robotics
- Comau SpA
- Yamaha Robotics
- Universal Robots(Teradyne)
- Nachi-Fujikoshi Corp.
- Techman Robot Inc.
- Siasun Robot and Automation
- Doosan Robotics
- Hanwha Robotics
第7章 市場機會與未來展望
According to Mordor Intelligence, the industrial robotics market size stands at USD 54.28 billion in 2026 and is projected to reach USD 94.38 billion by 2031, advancing at an 11.7% CAGR over the forecast period.
This report is Segmented by Type of Robot (Articulated Robots, Linear Robots, SCARA Robots, Collaborative Robots, and More), Payload Capacity (<=15 Kg, 16-225 Kg, and More), Application (Material Handling and Packaging, and More), End-User Industry (Automotive, Electrical and Electronics, and More), and Geography. The Market Sizes and Forecasts are Provided in Terms of Value (USD).
Global Industrial Robotics Market Trends and Insights
Rising Labor Costs and Ageing Workforce
Manufacturing wage inflation outpaced consumer-price growth by 1.8 percentage points annually between 2020 and 2025 in OECD economies, squeezing margins for labor-intensive assembly and pushing businesses toward quick-payback automation. Japan's working-age population declined by 6.2 million over the same span, so tier-one automotive suppliers installed night-shift collaborative cells to offset hiring gaps. German factories reported 420,000 open skilled-trade positions in 2025, accelerating use of articulated welders that were once cost-prohibitive for mid-size shops. In the United States, a projected 2.1 million manufacturing-worker deficit by 2030 triggered federal tax credits worth 30% of qualified automation spend in designated zones. South Korea doubled subsidies for small manufacturers in 2025, covering half the robot bill when turnover exceeds 40% in key trades.
Rapid Adoption of AI and IIoT-Enabled Smart Factories
Edge processors embedded in robot controllers now execute closed-loop optimizations that lower scrap by up to 18% in automotive paint and pharma coating lines. Digital-twin simulations shorten commissioning by 28 days on average, cutting integration labor nearly one-fifth. Predictive maintenance flags bearing wear 72 hours before failure, slashing unplanned body-shop downtime by 41% at high-utilization plants. The IIC-PUB-G1 guideline standardized OPC UA for robot-to-PLC traffic, finally enabling vendor-agnostic cell orchestration. Machine-vision powered by convolutional neural networks achieved 98.4% accuracy in 2025 electronics inspection, surpassing human inspectors at six-hundred-part-per-minute line speeds.
High Upfront Cap-Ex for SMEs
A full six-axis cell, including guarding and end-of-arm tools, costs USD 180,000-320,000, absorbing up to 70% of annual capital budgets at firms below USD 15 million revenue. Robot-as-a-Service leases cut the entry ticket, yet USD 1,800-3,200 monthly still tops single-shift labor in Mexico, Vietnam, and India. EIB data show 62% of SME automation-loan proposals were denied in 2025 for collateral shortfalls, bottlenecking uptake in Europe. Although accelerated depreciation permits year-one expensing in the United States and Germany, cash-flow limits persist for companies with margins under 15% EBITDA. Cobots priced at USD 35,000-50,000 help, but 10-15 kilogram payloads exclude heavy welding and metal forming.
Other drivers and restraints analyzed in the detailed report include:
- Government Cap-Ex Subsidies for Automation
- Tariff-Driven Reshoring Fuels U.S. Automation Spend
- Scarcity of Robot-Integration Talent
For complete list of drivers and restraints, kindly check the Table Of Contents.
Segment Analysis
Articulated units retained 62.52% industrial robotics market share in 2025, reflecting their versatility across welding, painting, and palletizing. Their dominance holds in automotive and machinery, yet collaborative robots outpace with a 12.92% CAGR through 2031 as factories favor human-friendly cells that redeploy without fencing. Cobot deployments rose in late pick-and-place and small-batch assembly, where quick reprogramming trims changeovers under 20 minutes. Cartesian and gantry machines remain important for oversized aerospace panels and windshield installation, while SCARA and delta variants protect niches in electronics and food sorting through sub-0.4-second cycles. Cylindrical units keep a shrinking foothold in legacy machine tending because articulated models now match reach at similar prices.
ABB's GoFa combines 12-kilogram payloads with 2.2 m/second speed, overlapping mid-reach articulated performance. Yaskawa's HC series embeds vision and force sensors that previously required third-party kits. As ISO/TS 15066 caps contact force, software plays an outsized role, distinguishing vendors that can tune dynamic joint limits for simultaneous safety and throughput. Over the forecast, cobots are expected to infiltrate 35% of green-field cells, especially in electronics final assembly and medical-device kitting where daily product mixes oscillate sharply. Meanwhile, articulated stalwarts continue to rule heavy welding and paint booths due to payload and explosion-proof requirements.
Mid-range 16-225 kilogram machines represented 49.54% of 2025 shipments, owing to ubiquitous automotive body-in-white tasks. Nevertheless, sub-15 kilogram designs log a 13.72% CAGR to 2031, translating miniaturized servo drives into slender arms fit for cramped electronics and pharma lines. Collaborative models dominate this weight class, capturing 68% of units as ISO/TS 15066 permits uncaged operation when forces stay under 150 newtons. Demand accelerates with smartphone and wearable volumes, in which +-0.01 millimeter repeatability is mandatory. The 226-500 kilogram band serves chassis lifting and aerospace tooling; above 500 kilograms, robots remain niche yet indispensable for press tending and wind-blade handling where loads exceed one metric ton.
Electronics assembly generated 58% of lightweight demand in 2025, driven by sub-1-second placement cycles. Pharmaceutical vial handling specifies stainless-steel variants in the 5-10 kilogram range to meet ISO 14644 class 5 clean-room rules. Battery-module lines adopt 50-100 kilogram robots capable of 0.05 millimeter bolt-tightening to avert thermal runaway risks. Food processors prefer delta arms under 3 kilograms for 200-plus picks per minute, leveraging IP65 casings against washdown chemicals. Heavy-duty arms above 500 kilograms are expected to lose share as integrators substitute clusters of synchronized mid-range units that simplify maintenance and spares.
Complete Report Scope:
- By Robot Type
- Articulated Robots
- SCARA Robots
- Cartesian / Gantry Robots
- Parallel / Delta Robots
- Cylindrical Robots
- Collaborative Robots (Cobots)
- By Payload Capacity
- <=15 kg
- 16-225 kg
- 226-500 kg
- Above 500 kg
- By Application
- Material Handling and Packaging
- Welding and Soldering
- Assembly and Dispensing
- Machine Tending and CNC
- Painting and Coating
- Quality Inspection
- By End-User Industry
- Automotive
- Electrical and Electronics
- Food and Beverage
- Machinery and Metal
- Pharmaceuticals and Healthcare
- Construction Materials
- Other End-User Industries
- By Geography
- North America
- United States
- Canada
- Mexico
- South America
- Brazil
- Argentina
- Rest of South America
- Europe
- Germany
- United Kingdom
- France
- Italy
- Russia
- Rest of Europe
- Asia Pacific
- China
- Japan
- South Korea
- India
- Rest of Asia Pacific
- Middle East
- GCC
- Turkey
- Rest of Middle East
- Africa
- South Africa
- Rest of Africa
- North America
Geography Analysis
Asia Pacific generated 44.36% of 2025 revenue, anchored by China's domestic manufacturers capturing 52% of local installations under subsidy schemes that cover up to 40% of robot costs. Japan reached a density of 399 units per 10,000 workers, the world's highest, as automation offsets a shrinking labor base. India's production-linked incentive pays 4-6% rebates tied to productivity lifts, spurring smartphone and appliance plants to add lightweight cobots.
North America delivered 26% of the industrial robotics market in 2025, with United States factories absorbing 78% of regional shipments as CHIPS Act grants and tariff pressures prompt local wafer fabs and EV plants. Mexico's USD 28 billion near-shoring inflow relies on articulated units to satisfy USMCA thresholds while maintaining cost advantages. Canada's Strategic Innovation Fund earmarks CAD 2.1 billion for advanced manufacturing, demanding cobot integration in battery lines.
Europe accounted for 21% of global revenue in 2025, led by Germany, which booked 38% of continental installs helped by Digital Now reimbursement. Italy and France follow, where wage structures keep payback periods under 20 months. Rising cyber-security regulation, notably ISO/IEC 62443 mandates, compels buyers to favor suppliers with hardened controllers, indirectly elevating switching costs.
The Middle East, while only 4% of 2025 value, unlocks the steepest 12.22% CAGR as Saudi Vision 2030 invests USD 3.2 trillion in non-oil capacity and the United Arab Emirates mandates 50% localized output by 2031. Government industrial zones offer zero-interest loans for automation, making robots cost-competitive with migrant labor. South America and Africa jointly held 9% in 2025; adoption remains hampered by financing models that require 40-50% down payments and thin integrator networks. Nonetheless, Chilean lithium and Brazilian agribusiness pilots signal nascent demand for wash-down and heavy-payload variants.
- ABB Ltd.
- FANUC Corporation
- Yaskawa Electric Corp.
- KUKA AG
- Mitsubishi Electric Corp.
- Kawasaki Heavy Industries (Robotics)
- DENSO Corporation
- Omron Corporation
- Panasonic Corp.
- Epson Robots
- Staubli Robotics
- Comau S.p.A.
- Yamaha Robotics
- Universal Robots (Teradyne)
- Nachi-Fujikoshi Corp.
- Techman Robot Inc.
- Siasun Robot and Automation
- Doosan Robotics
- Hanwha Robotics
Additional Benefits:
- The market estimate (ME) sheet in Excel format
- 3 months of analyst support
TABLE OF CONTENTS
1 INTRODUCTION
- 1.1 Study Assumptions and Market Definition
- 1.2 Scope of the Study
2 RESEARCH METHODOLOGY
3 EXECUTIVE SUMMARY
4 MARKET LANDSCAPE
- 4.1 Market Overview
- 4.2 Market Drivers
- 4.2.1 Rising Labor Costs and Ageing Workforce
- 4.2.2 Rapid Adoption of AI and IIoT-Enabled Smart Factories
- 4.2.3 Government Cap-Ex Subsidies for Automation (China, Korea, Germany)
- 4.2.4 Tariff-Driven Reshoring Fuels US Automation Spend
- 4.2.5 ESG Push for Energy-Efficient, Low-Carbon Robots
- 4.2.6 Robot-as-a-Service Boosted by Accelerated Depreciation Rules
- 4.3 Market Restraints
- 4.3.1 High Upfront Cap-Ex for SMEs
- 4.3.2 Scarcity of Robot-Integration Talent
- 4.3.3 Cyber-Security Liabilities in Connected Production Cells
- 4.3.4 Rare-Earth Servo-Motor Supply Volatility
- 4.4 Industry Value Chain Analysis
- 4.5 Regulatory Landscape
- 4.6 Technological Outlook
- 4.7 Impact of Macroeconomic Factors on the Market
- 4.8 Porter's Five Forces Analysis
- 4.8.1 Bargaining Power of Suppliers
- 4.8.2 Bargaining Power of Buyers
- 4.8.3 Threat of New Entrants
- 4.8.4 Threat of Substitutes
- 4.8.5 Intensity of Competitive Rivalry
5 MARKET SIZE AND GROWTH FORECASTS (VALUE)
- 5.1 By Robot Type
- 5.1.1 Articulated Robots
- 5.1.2 SCARA Robots
- 5.1.3 Cartesian / Gantry Robots
- 5.1.4 Parallel / Delta Robots
- 5.1.5 Cylindrical Robots
- 5.1.6 Collaborative Robots (Cobots)
- 5.2 By Payload Capacity
- 5.2.1 <=15 kg
- 5.2.2 16-225 kg
- 5.2.3 226-500 kg
- 5.2.4 Above 500 kg
- 5.3 By Application
- 5.3.1 Material Handling and Packaging
- 5.3.2 Welding and Soldering
- 5.3.3 Assembly and Dispensing
- 5.3.4 Machine Tending and CNC
- 5.3.5 Painting and Coating
- 5.3.6 Quality Inspection
- 5.4 By End-User Industry
- 5.4.1 Automotive
- 5.4.2 Electrical and Electronics
- 5.4.3 Food and Beverage
- 5.4.4 Machinery and Metal
- 5.4.5 Pharmaceuticals and Healthcare
- 5.4.6 Construction Materials
- 5.4.7 Other End-User Industries
- 5.5 By Geography
- 5.5.1 North America
- 5.5.1.1 United States
- 5.5.1.2 Canada
- 5.5.1.3 Mexico
- 5.5.2 South America
- 5.5.2.1 Brazil
- 5.5.2.2 Argentina
- 5.5.2.3 Rest of South America
- 5.5.3 Europe
- 5.5.3.1 Germany
- 5.5.3.2 United Kingdom
- 5.5.3.3 France
- 5.5.3.4 Italy
- 5.5.3.5 Russia
- 5.5.3.6 Rest of Europe
- 5.5.4 Asia Pacific
- 5.5.4.1 China
- 5.5.4.2 Japan
- 5.5.4.3 South Korea
- 5.5.4.4 India
- 5.5.4.5 Rest of Asia Pacific
- 5.5.5 Middle East
- 5.5.5.1 GCC
- 5.5.5.2 Turkey
- 5.5.5.3 Rest of Middle East
- 5.5.6 Africa
- 5.5.6.1 South Africa
- 5.5.6.2 Rest of Africa
- 5.5.1 North America
6 COMPETITIVE LANDSCAPE
- 6.1 Market Concentration
- 6.2 Strategic Moves
- 6.3 Market Share Analysis
- 6.4 Company Profiles (includes Global Level Overview, Market Level Overview, Core Segments, Financials as Available, Strategic Information, Market Rank / Share for Key Companies, Products and Services, and Recent Developments)
- 6.4.1 ABB Ltd.
- 6.4.2 FANUC Corporation
- 6.4.3 Yaskawa Electric Corp.
- 6.4.4 KUKA AG
- 6.4.5 Mitsubishi Electric Corp.
- 6.4.6 Kawasaki Heavy Industries (Robotics)
- 6.4.7 DENSO Corporation
- 6.4.8 Omron Corporation
- 6.4.9 Panasonic Corp.
- 6.4.10 Epson Robots
- 6.4.11 Staubli Robotics
- 6.4.12 Comau S.p.A.
- 6.4.13 Yamaha Robotics
- 6.4.14 Universal Robots (Teradyne)
- 6.4.15 Nachi-Fujikoshi Corp.
- 6.4.16 Techman Robot Inc.
- 6.4.17 Siasun Robot and Automation
- 6.4.18 Doosan Robotics
- 6.4.19 Hanwha Robotics
7 MARKET OPPORTUNITIES AND FUTURE OUTLOOK
- 7.1 White-Space and Unmet-Need Assessment

 2026年全球倉庫人工智慧(AI)機器人市場報告
 2026-2030年全球工業機器人市場
 工業機器人市場-全球及區域分析:按應用、產品和國家分類-分析與預測(2026-2035年)
 工業、協作和商業機器人研究服務
 工業機器人市場預測至2034年:按組件、類型、承重能力、應用、最終用戶和地區分類的全球分析
 工業機器人市場:按機器人類型、互動模式、承重能力、軸數、安裝方式、應用和產業分類-2026-2032年全球市場預測
 全球工業機器人市場:依機器人類型、承重能力、產品系列、應用領域、終端用戶產業和地區分類-預測至2032年2026年全球貨架式機器人市場報告製造機器人市場預測—全球分析(按組件、機器人類型、有效載荷能力、部署模式、應用、最終用戶和地區分類)—2034年商業和工業機器人